
Key Takeaways
- A defensible workflow diagram encodes three layers at once: the seven-stage content lifecycle, a RACI overlay naming one Accountable person per stage, and an automation overlay separating human-decided from rule-executed work.
- Redraw the linear calendar as a hub-and-spoke loop once a second parallel work stream appears, routing every spoke through the Reviewer node with a defined payload and SLA.
- Color-code sub-tasks green, yellow, or red only after mapping activity chains and naming the input, decision logic, and output system for each candidate cell 18.
- Multi-location teams should split the Reviewer role by decision type and push formatting and location-token work into green cells, where the 60–70% execution-task savings band applies 14.
Why Linear Editorial Calendars Fail Lean Teams
A two-to-six person content team running a Google Sheet or Airtable calendar hits the same wall around month four: the calendar tracks when things ship, but not who decides what moves, and not which steps could run without a human touching them. The calendar is a schedule, not a workflow. It records intent and leaves the actual coordination in Slack threads, email chains, and standing meetings.
That gap shows up in the readiness data. Only 27% of CMOs report their organizations feel equipped to handle expanded remits that now include generative AI, and just 5% of marketers are actively building gen AI capabilities 13. The pressure to double throughput without new headcount is real, but the artifact most lean teams use to plan the work — a linear editorial calendar — was designed for a smaller, slower content function.
Three failure modes recur:
- First, approval bottlenecks compound: every piece routes through the same one or two reviewers, and the calendar has no way to show a stuck queue.
- Second, role ambiguity slows handoffs; without documented decision rights, a draft can sit for days while everyone assumes someone else owns the next move 6.
- Third, the calendar treats every asset as a bespoke event, which prevents the team from separating tasks a human must judge from tasks a rule or agent could execute 15.
A workflow diagram fixes what a calendar cannot. It encodes stages, decision rights, and execution triggers in one artifact — the three layers the rest of this piece defines.
The Three Layers Every Workflow Diagram Must Encode
Layer One: The Seven Lifecycle Stages
The base layer of a defensible workflow diagram is the content lifecycle itself: what actually happens to a piece of work from first signal to retirement. A useful reference model breaks this into seven components — intake, analysis, create, manage, distribute, repurpose, and measure — and treats each as a documented stage rather than an implicit step in someone's head 3.
- Intake is where requests, briefs, and topic signals land in one place.
- Analysis is where those signals are scored against strategy, audience research, and existing coverage.
- Create covers drafting, editing, and design.
- Manage is the version-control and asset-storage stage most calendars ignore entirely.
- Distribute pushes the asset to owned, earned, and paid channels.
- Repurpose extracts secondary formats — clips, summaries, threads — from the primary asset.
- Measure closes the loop with performance data that feeds the next intake cycle.
Lean B2B teams working from a similar model tend to compress this into five visible stages — ideation, planning, production, review, publication — because a two-to-six person team cannot staff seven separate stations 8. That compression is fine, but the diagram should still show the missing components as sub-tasks inside adjacent stages, not delete them. Repurpose folded into distribute, for example, keeps the stage count manageable without losing the discipline of asking what secondary assets each primary piece should generate.
The rule for this layer is simple: draw every stage a piece of content actually passes through, even the ones no single person owns. If manage or measure are not on the diagram, they are not happening consistently, which is why performance data rarely flows back into the intake queue.
Layer Two: The RACI Overlay for Decision Rights
The lifecycle layer answers what happens. It does not answer who decides. That is the job of a RACI overlay drawn on top of the stages, marking who is Responsible, Accountable, Consulted, and Informed at each transition 6.
On a lean team, the trap is assuming role clarity because everyone sits within earshot of each other. In practice, a draft still stalls because the writer thinks the editor owns the SEO sign-off, the editor thinks the content lead owns it, and the content lead is waiting for legal to weigh in on a claim nobody flagged. A RACI cell removes that ambiguity by naming a single Accountable person per stage, even when the Responsible work is shared.
A minimal role structure that survives contact with a small team is Owner → Editor → Reviewer → Publisher, with each role tied to explicit handoff criteria 7:
- The Owner is Accountable for intake and analysis.
- The Editor is Accountable for create and manage.
- The Reviewer is Accountable for the approval decision.
- The Publisher is Accountable for distribute and the initial measure snapshot.
Two rules keep the overlay usable. Only one person can be Accountable per stage; multiple Responsible contributors are fine, but shared accountability collapses into no accountability. And Consulted roles need a defined response window — 24 hours, 48 hours — after which the stage advances by default. Without that timer, the RACI overlay becomes a veto map and the diagram loses its throughput function.
Layer Three: The Automation Trigger Overlay
The third layer marks which transitions run on human judgment and which run on triggers. A trigger is a defined condition — a form submission, a status change, a scoring threshold, a scheduled interval — that moves work forward without a person clicking a button. Drawing this layer forces the team to separate tasks that require editorial judgment from tasks that only require a rule.
The starting point is not a tool selection. It is a task inventory. McKinsey's guidance on rewiring workflows with agentic AI is explicit: teams cannot configure agents without first developing a granular understanding of how work gets done today, broken into the full chain of activities and the systems each activity touches 18. On the diagram, that means annotating each stage with the sub-tasks inside it, then marking each sub-task as human-decided, rule-triggered, or agent-executed.
The scale case for this overlay is no longer speculative. Scaled agentic AI deployments are modeled to deliver 3–5% annual productivity improvements and 10% or more growth lift when embedded in marketing and sales workflows, with agents functioning as active collaborators rather than passive tools 16. Ecosystem adoption tracks that shift: job postings related to agentic AI rose 985% between 2023 and 2024, indicating that the labor market is already staffing for trigger-based execution as a defensible operating pattern rather than a pilot 17.
For a lean team, the practical output is a color-coded overlay on the lifecycle diagram:
- Green marks stages where a rule or agent can execute without human touch — status updates, distribution to a scheduled queue, repurposing a primary asset into pre-templated secondary formats.
- Yellow marks stages where an agent drafts and a human approves.
- Red marks stages that stay fully human: brand-voice calls, sensitive-topic judgment, final publish approval.
The red cells are where editorial control lives, and the diagram should show them clearly enough that a CMO can point to them and see the governance intact.
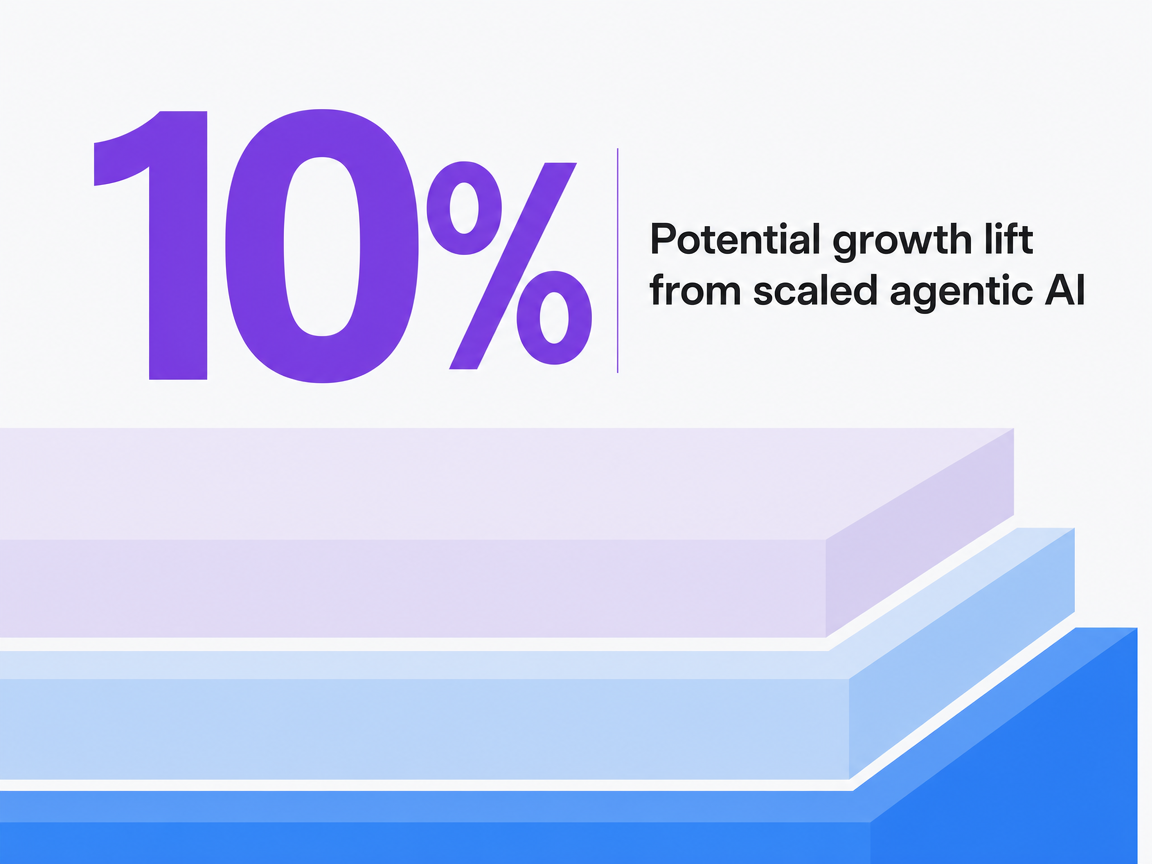 Potential growth lift from scaled agentic AI
Potential growth lift from scaled agentic AI
Redrawing the Diagram as a Hub-and-Spoke Approval Loop
The standard small-team workflow is a straight line: Backlog → Ready → In progress → Review → Scheduled → Published 4. It reads cleanly on a whiteboard and it fails as soon as the team adds a second parallel work stream — an AI-drafted variant, a repurpose branch, a paid-social adaptation — because the line has no place to put work that runs alongside the main draft rather than after it.
The redraw replaces the line with a hub. At the center sits a single approval node — the Reviewer role from the Owner → Editor → Reviewer → Publisher structure 7. Every work stream, whether a human-drafted long-form piece, an agent-generated distribution asset, or a repurposed clip, terminates at that node before it advances. The spokes are the parallel execution branches: one for human production, one for agent-executed tasks, one for scheduled distribution, one for measurement pulls that re-enter the intake queue as new signals.
Three properties make the hub structure defensible on a lean team:
- Queue visibility improves because every stuck item is stuck in one place, not scattered across five columns.
- Decision rights concentrate: the Reviewer approves or rejects, and the diagram shows exactly which cell holds that authority.
- Parallelism becomes explicit — the diagram no longer pretends that a repurpose task waits for the primary asset to finish its own review; both can run against the same hub on different cycles.
The linear flow still has a place. For a two-person team publishing one asset a week, Backlog → Ready → In progress → Review → Scheduled → Published is enough, and the overhead of drawing a hub is wasted 4. The trigger to redraw is the appearance of the second work stream. Once a team is producing a primary asset and any parallel derivative — social clips, email cutdowns, localized variants — the linear diagram starts hiding queue state, and the Reviewer node stops being a step and starts being a bottleneck the diagram cannot show.
The hub also changes what handoff criteria mean. In a line, a handoff is a status change. In a hub, a handoff is an entry into the approval queue with a defined payload: the asset, the stage it came from, the decision requested, and the SLA on response. The Reviewer is not deciding whether the piece is finished; the Reviewer is deciding whether the piece can advance to its next spoke — publish, repurpose, distribute, or return to Edit. That framing keeps the approval loop from turning back into a review committee, which is the failure mode most linear workflows collapse into once volume rises.
Test a Lean Content Workflow in Real Time
Experience a streamlined approval and publishing process with your own live content, risk-free for seven days.
The Payoff: What the Approval Loop Actually Moves
The hub structure has an operational logic, but the case for redrawing the diagram rests on outcomes a content lead can defend in a quarterly review: revenue contribution, demand fulfillment, and execution cost. Deloitte Digital's 2023–2024 comparison of organizations using process automation and AI use cases against industry peers not using automation found a 29% greater revenue impact from content marketing and a 24% higher likelihood of meeting content demand 9. Scope matters: the delta was measured across organizations that had already implemented automation and AI, not across teams that had merely purchased tools, and the comparison window covers the period when content demand nearly doubled.
Those two numbers map cleanly onto what the approval loop is actually built to do. The 24% demand-fulfillment gap corresponds to throughput — a hub with parallel spokes moves more work through the same Reviewer without adding drafting capacity. The 29% revenue delta corresponds to what happens when measurement re-enters the intake queue as a signal, so the next cycle of work is scored against performance rather than opinion.
The upper-bound modeling reinforces the direction. McKinsey estimates that marketing organizations rewired around AI-integrated workflows can capture 4–7% revenue growth and 60–70% savings in execution-related tasks, framed as modeled potential when workflows — not tools — are the unit of redesign 14. Lean teams should read the 60–70% figure as a ceiling on execution tasks specifically (distribution, formatting, repurposing, status coordination), not a promise on total headcount cost. The savings show up in the green cells of the automation overlay, not the red ones.
The practical read for a lean team: the approval loop is worth drawing when the calendar starts hiding either the demand gap or the measurement gap. If briefs are landing faster than the Reviewer can advance them, the 24% throughput lever is on the table. If published assets never re-enter the intake queue as scored signals, the 29% revenue lever is the one the diagram unlocks by design.
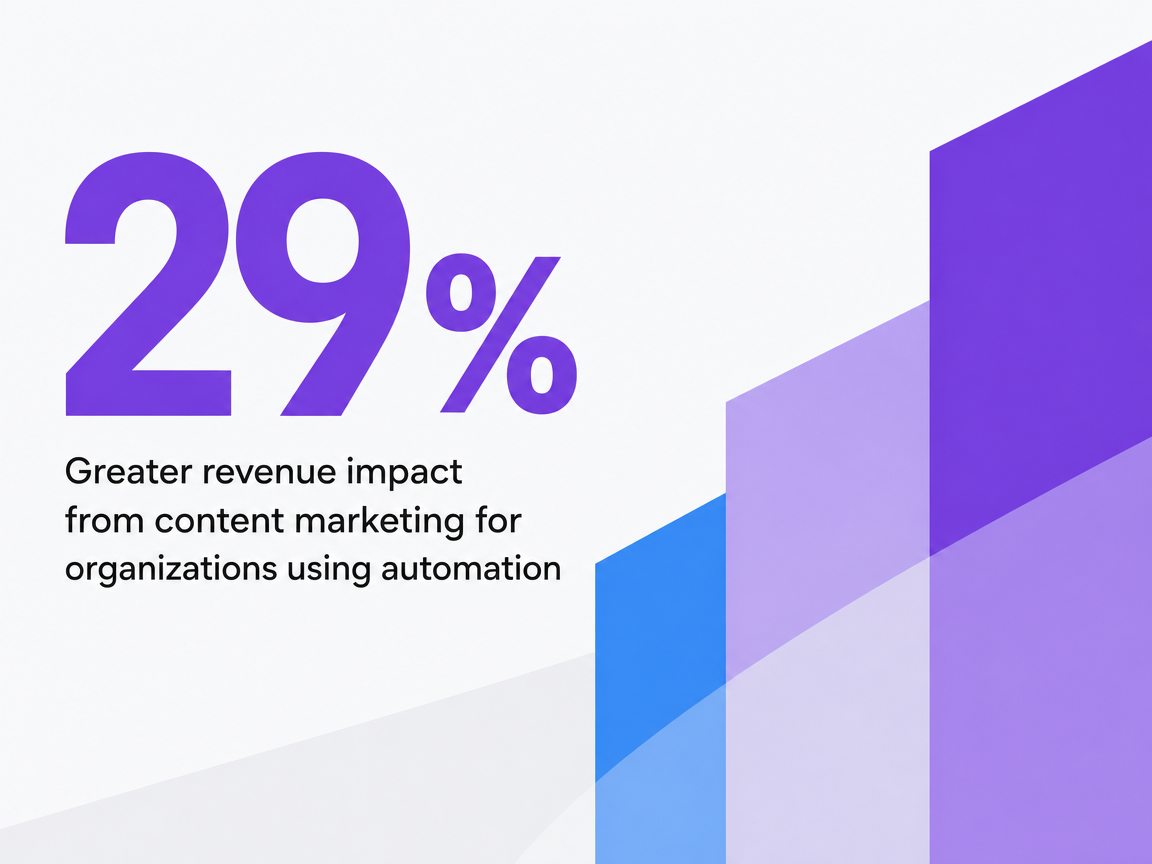 Greater revenue impact from content marketing for organizations using automation
Greater revenue impact from content marketing for organizations using automation
Where AI Belongs Inside the Diagram
Mapping Activity Chains Before Assigning Agents
The mistake most lean teams make with AI is procurement-first: buy a tool, then hunt for tasks to run through it. The workflow diagram inverts that sequence. Before any agent gets configured, the team maps the existing chain of activities inside each stage and identifies the systems each activity touches — the CMS, the DAM, the analytics platform, the CRM, the scheduler 18.
On the diagram, that means every stage in the lifecycle layer gets decomposed into its sub-tasks with their input and output artifacts named. Intake breaks into signal capture, deduplication against existing coverage, and scoring against strategy. Create breaks into outline, draft, edit pass, and asset generation. Distribute breaks into channel formatting, scheduling, and tracking-parameter application. Each sub-task gets a system tag showing where the work actually happens.
Only then does the automation overlay get drawn on top. A sub-task qualifies for agent execution when three conditions hold:
- The input is structured or predictably shaped,
- The decision logic can be written as a rule, and
- The output feeds a system the agent can already reach.
A sub-task stays human when any of those three fail — most often when the decision requires brand-voice judgment or sensitive-topic reading. The diagram makes the qualification explicit rather than leaving it to a vendor demo.
The Productivity Band Lean Teams Should Plan Around
The headline figure worth planning around is 5–15% productivity gain from generative AI, expressed as a share of total marketing spend, not as a per-writer speedup 10. That framing matters. A two-to-six person team applying the band to its own operating cost gets a directional envelope for how much drafting, formatting, and coordination work can shift into the automation overlay before human oversight becomes the binding constraint.
Two adjustments keep the number honest on a lean team. First, the band assumes workflows are redesigned around AI, not that AI is bolted onto the existing linear calendar. Teams that skip the redraw tend to land near the bottom of the range because the human review step still gates every asset serially. Second, the band is a modeled potential across marketing functions broadly; content operations sits inside that scope but does not capture the full figure alone.
The planning read: treat the 5–15% band as the space the automation overlay is competing for, and target the middle of the range as a realistic year-one outcome once the diagram's green and yellow cells are actually wired to systems.
Closing the CMO Readiness Gap With the Diagram Itself
The readiness gap flagged earlier — only 27% of CMOs reporting their organizations feel equipped for expanded AI remits — is usually treated as a training problem or a hiring problem. On a lean team, it is a documentation problem. The reason executives feel unequipped is that no artifact shows them where AI is running, who approved it, and what would break if a specific cell were turned off.
The three-layer diagram is that artifact. The lifecycle layer shows what work exists. The RACI overlay shows who holds decision rights at every transition. The automation overlay shows exactly which sub-tasks run on triggers versus human judgment, color-coded so the red cells — brand voice, sensitive topics, final publish — are visible at a glance.
For a content lead defending the operating model to a CMO or a board, the diagram converts an abstract governance question into a concrete map. That is the artifact platforms like Vectoron's Command Center are built to render: an approval-first view where every AI-executed cell terminates at a named human before it advances.
Request a Custom Workflow Diagram for Scaling Content Approvals
Connect with our team for a walkthrough of centralized content management diagrams designed for lean, multi-channel teams—built to accelerate approvals, reduce bottlenecks, and improve operational oversight.
If You Manage Multiple Locations: Approval Fan-Out Economics
The reader shifts here. This section is for content leads running the function inside a multi-location operator — a DSO with 40 practices, a law firm network with 12 offices, a senior living portfolio with 25 communities. The hub-and-spoke diagram from the prior sections still holds, but the Reviewer node behaves differently once the same approval structure has to serve dozens of localized variants.
The fan-out problem is arithmetic. A single Reviewer approving 8 primary assets a month at a single-location company handles roughly 8 decisions. The same Reviewer at a 25-location operator producing 2 localized variants per primary asset per location is looking at 400 approval decisions against the same headcount. The diagram does not fail because the stages are wrong; it fails because the red cells — the human-approval nodes — cannot scale linearly with location count.
Two design changes keep the diagram usable at fan-out:
- Split the Reviewer role by decision type: brand-voice and sensitive-topic decisions stay centralized at one Reviewer, while location-specific fact checks (hours, providers, service lines) route to a local Approver with a defined SLA.
- Push formatting, channel adaptation, and location-token substitution into the automation overlay's green cells, so the Reviewer is not deciding on assets that differ only by inserted variables.
The variable-driven read below is directional. It applies the McKinsey 60–70% execution-task savings band 14 only to the execution-related sub-tasks in the workflow — distribution formatting, location-token substitution, scheduling, repurposing — not to the review or drafting cells. Plug in your own editor hourly rate and cycle counts.
| Portfolio size | Primary assets / mo | Localized variants per asset | Execution hours / cycle (baseline) | Execution hours after overlay (60–70% band) |
|---|---|---|---|---|
| 5 locations | 4 | 2 | L × 4 × 2 × H | 0.30–0.40 × baseline |
| 12 locations | 6 | 2 | L × 6 × 2 × H | 0.30–0.40 × baseline |
| 25 locations | 8 | 2 | L × 8 × 2 × H | 0.30–0.40 × baseline |
| 40+ locations | 8 | 3 | L × 8 × 3 × H | 0.30–0.40 × baseline |
L : location count
H : per-cycle editor hours at baseline
The savings band applies to the execution sub-tasks the automation overlay covers, not to the Reviewer's judgment work — which is exactly the cell the diagram protects.
Building the Diagram on Monday: A Working Sequence
The diagram is not a design project. A content lead can produce a defensible v1 in a single working session by treating it as three overlays drawn in order, not one artifact drawn from scratch.
- Step 1: List every stage a piece of content actually passes through in the last 30 days. Not the aspirational stages — the ones that happened. Compress into the five visible stations most lean B2B teams operate: ideation, planning, production, review, publication 8. Note the sub-tasks under manage and measure even if no one currently owns them.
- Step 2: Assign one Accountable name per stage. Owner for intake and analysis, Editor for create and manage, Reviewer for the approval decision, Publisher for distribute and the first measurement pull 7. Add a 24- or 48-hour default response window for Consulted roles so the stage advances if silence holds 6.
- Step 3: Color-code each sub-task. Green for rule- or agent-executed, yellow for agent-drafted and human-approved, red for fully human. Before assigning any green cell, write the input, decision logic, and output system for that sub-task 18. If any of the three is unclear, the cell stays yellow until it is.
- Step 4: Redraw as a hub if a second work stream exists. Route every spoke through the Reviewer node with a defined payload — asset, source stage, decision requested, SLA.
The v1 is drawable in two hours. The value comes from what it forces the team to name.
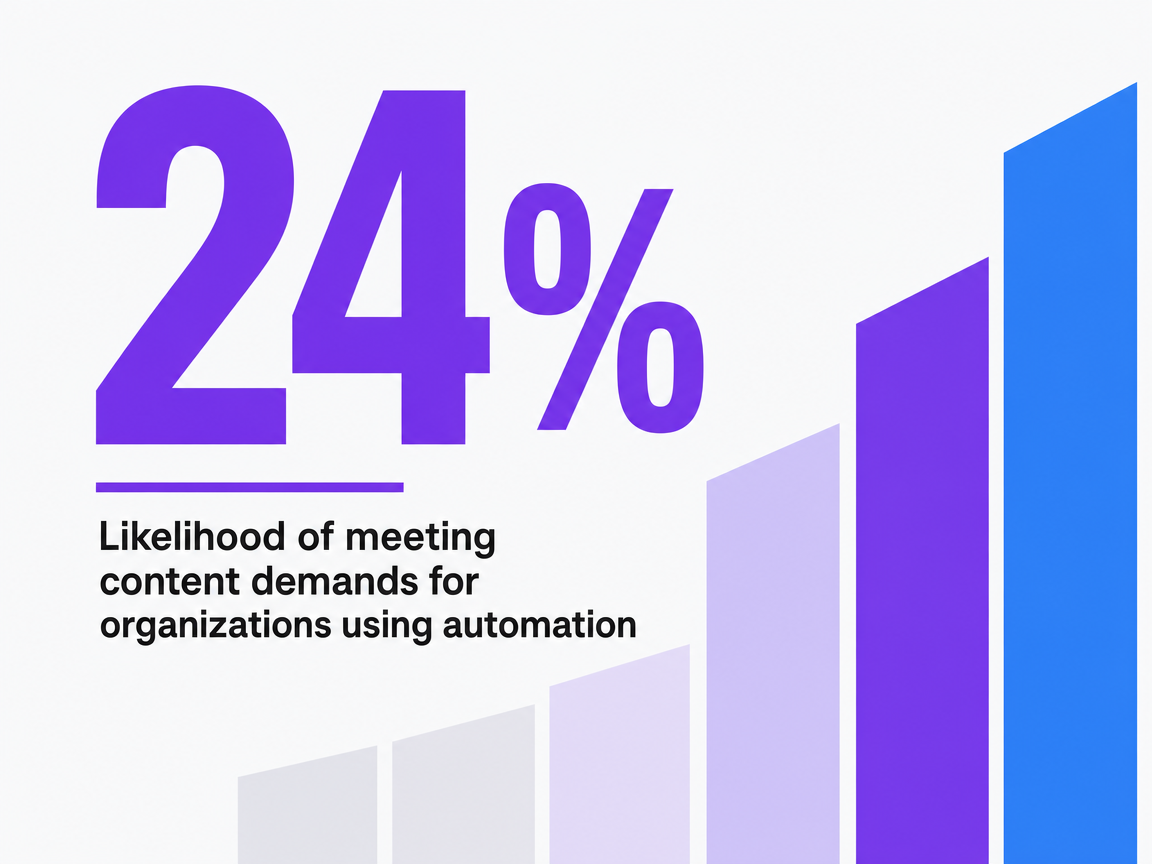 Likelihood of meeting content demands for organizations using automation
Likelihood of meeting content demands for organizations using automation
Frequently Asked Questions
References
- 1.How To Document Your Content Marketing Workflow.
- 2.5 Steps To Build a Content Operation Workflow That Helps Everybody.
- 3.Master Content Operations and Keep Your Team Moving Forward.
- 4.Agile Content Marketing: A Weekly Workflow for Small Teams.
- 5.Processes, workflows and team management in content strategy.
- 6.How to Scale Your Content Operations with a Lean Team.
- 7.Guide to Building a High-Performance Content Operation.
- 8.Content Operations Framework: A Guide for Lean B2B Teams.
- 9.Marketing content automation.
- 10.How generative AI can boost consumer marketing.
- 11.AI-powered marketing and sales reach new heights with generative AI.
- 12.The state of AI in early 2024.
- 13.McKinsey: CMOs feel unprepared as duties pile up.
- 14.The future of marketing in the age of AI.
- 15.A marketing organization that thrives with AI.
- 16.Agents for growth: Turning AI promise into impact.
- 17.McKinsey: AI agents reshape advertising landscape.
- 18.Reinventing marketing workflows with agentic AI.