
Key Takeaways
- Content marketing earns budget when defined as a revenue system operating under four conditions: ICP precision, lifecycle coverage, pipeline-grade measurement, and execution that scales without proportional headcount.
- ICP precision is the highest-leverage variable, with clearly defined profiles linked to up to 36% higher conversion and 68% higher ROI 7, controlling every downstream theme and account decision.
- Lifecycle coverage corrects the budget mispricing that occurs when acquisition consumes the calendar while 77% of B2B revenue comes from existing customers 1, requiring funded onboarding, expansion, and renewal content.
- VPs rebuilding the function should focus next on swapping traffic dashboards for pipeline influenced, CAC, and CLV reporting, and consolidating execution into one governed loop with human approval gates.
Why the Textbook Definition Fails in a Budget Meeting
The textbook definition of content marketing—creating and distributing valuable, relevant content to attract and retain a defined audience—does not survive a CFO's first question. That question is almost always some version of: what does this spend produce, and when?
The standard definition has no answer. It describes an activity, not an outcome. It tells a finance leader what the marketing team does on Tuesday, not what the pipeline will look like in Q3. For a VP of Marketing defending a content budget against paid media, sales headcount, or product investment, that gap is the entire problem.
The definition that holds up in a budget meeting is operational. It treats content as a revenue system with measurable inputs and forecastable outputs, not a publishing practice. The shift matters because the underlying economics have shifted. Forrester reports that 77% of B2B customer revenue comes from existing customers, yet only 41% of organizations can analyze content performance by audience and 34% by theme 1. A function tied to 77% of the revenue base cannot be evaluated on traffic charts.
CMI's 2025 benchmark research found that high performers are more likely to have a documented strategy and to use metrics tied to revenue outcomes 2. The correlation is not subtle. Programs that survive scrutiny describe themselves in pipeline terms, not engagement terms.
What follows is a working definition built from four operating conditions—ICP precision, lifecycle coverage, revenue-grade measurement, and execution that scales without proportional headcount. Each condition is the answer to a question a CFO will ask.
An Operating Definition Built From Four Conditions
Content marketing, defined for predictable growth, is the system that converts published material into forecastable pipeline, retention revenue, and customer lifetime value under four operating conditions. Strip any of the four and the program reverts to a publishing habit with unpredictable financial output.
The four conditions are precise: an ICP precise enough to determine which accounts and themes get resourced; lifecycle coverage that funds existing-customer expansion at the same priority as acquisition; measurement anchored to pipeline influence, CAC, and CLV rather than sessions and shares; and an execution model that produces volume and relevance without scaling headcount in lockstep with output.
This framing matches what CMI's 2025 and 2026 benchmark research identifies in high performers—documented strategy, audience insight, and integration with sales, not format experimentation, as the variables that separate growth-producing programs from cost centers 2, 3. The sections that follow examine each condition, the benchmark it must clear, and the specific point at which most mid-market programs break it.
Condition One: ICP Precision as the Highest-Leverage Variable
Of the four conditions, ICP precision moves the most revenue per unit of effort. It is also the condition most often treated as a one-time exercise rather than an ongoing investment, which is why it tends to silently cap the performance of otherwise well-resourced content programs.
The math is direct. CXL's analysis of B2B ICP practice reports that companies with clearly defined ideal customer profiles see up to 36% higher conversion rates and up to 68% higher ROI, and that sales-marketing alignment built on a shared ICP correlates with a 38% lift in win rates 7. Those figures describe the gap between programs that resource the right accounts and programs that resource accounts they can name. A VP looking for the single highest-leverage place to spend the next quarter of analyst time will find it here.
What makes ICP a definitional condition rather than a tactic is what it controls downstream. The ICP determines which themes get funded, which formats earn budget, which keywords are worth ranking for, and which accounts the sales team will accept as marketing-sourced. A vague ICP—"mid-market companies in regulated industries"—produces a content calendar that hedges across audiences and converts none of them well. A precise ICP, built from closed-won data, firmographic patterns, product-usage signals, and disqualification reasons, narrows the calendar to themes that pipeline-stage buyers actually search and share.
The IAB's account-based marketing framework formalizes the same point: content must align to the role of each individual in the buying committee and map to specific stages in the buyer's journey, not to a generic persona 9. Salesforce's ABM guidance extends this by treating selected accounts as markets of one, with content engineered to the buying group rather than a category average 8. Both frameworks assume the ICP is already empirical. Without that, account selection inherits whatever bias was in the original persona document.
Two operational tests separate a working ICP from a decorative one. The first is whether the sales team can name the three reasons an account gets disqualified inside the first call. The second is whether the content roadmap can be filtered by ICP segment and produce a defensible answer for why each piece exists. Programs that fail either test are leaving the 36% and 68% lifts on the table, regardless of how much they publish 7.
ICP precision is not a deliverable. It is a moving target that gets sharper as closed-won data accumulates, as disqualification reasons stabilize, and as expansion patterns emerge inside the existing book—which is where the second condition begins.
Condition Two: Lifecycle Coverage Beyond Acquisition
The second condition is the one most content programs structurally violate. Budgets, calendars, and headcount tend to follow the acquisition funnel—top-of-funnel SEO, mid-funnel comparison content, bottom-of-funnel demos—while the customer base that already pays the company is served by a renewals email and an occasional product update.
That allocation is upside down relative to where the revenue actually lives. Forrester reports that 77% of B2B customer revenue originates from existing customers 1. Two implications follow. First, a program that spends the majority of its production capacity on net-new acquisition is under-resourcing the larger revenue pool. Second, most organizations cannot tell which content is working for which segment, so even the existing-customer content they do publish is flying blind.
Lifecycle coverage, as a definitional condition, means the content roadmap is built to influence four distinct revenue events—new logo acquisition, onboarding and time-to-value, expansion and cross-sell, and renewal—with measurable content assigned to each. Onboarding content shortens the path to first value and reduces early churn. Expansion content surfaces adjacent use cases inside accounts that have already cleared procurement. Renewal content gives champions internal ammunition to defend the line item. None of those events show up in a traffic dashboard, which is part of why they get underfunded.
Forrester's guidance on sales-content partnership reinforces the point: content must support the entire buyer's journey, co-created with the people who carry the account after the contract is signed, not just the people who close it 12. CMI's 2026 outlook surfaces the same pattern, finding that operational efficiency and improved customer engagement—both lifecycle metrics—rank among the top benefits marketers attribute to programs that have evolved past acquisition-only models 3.
A working test for this condition is budget allocation by lifecycle stage. If acquisition content consumes more than roughly two-thirds of production capacity in a business where existing-customer revenue dominates, the program is mispriced against its own revenue model. The corrective move is not to cut acquisition. It is to fund onboarding, expansion, and renewal content as named line items with their own performance metrics, and to close the analytics gap that prevents segment-level reporting in the first place 1.
Lifecycle coverage also changes what counts as a content asset. Implementation guides, customer-only benchmark reports, in-product education sequences, and account-specific business reviews become part of the content function rather than handoffs to customer success. That reclassification is what makes the 77% revenue base addressable 1.
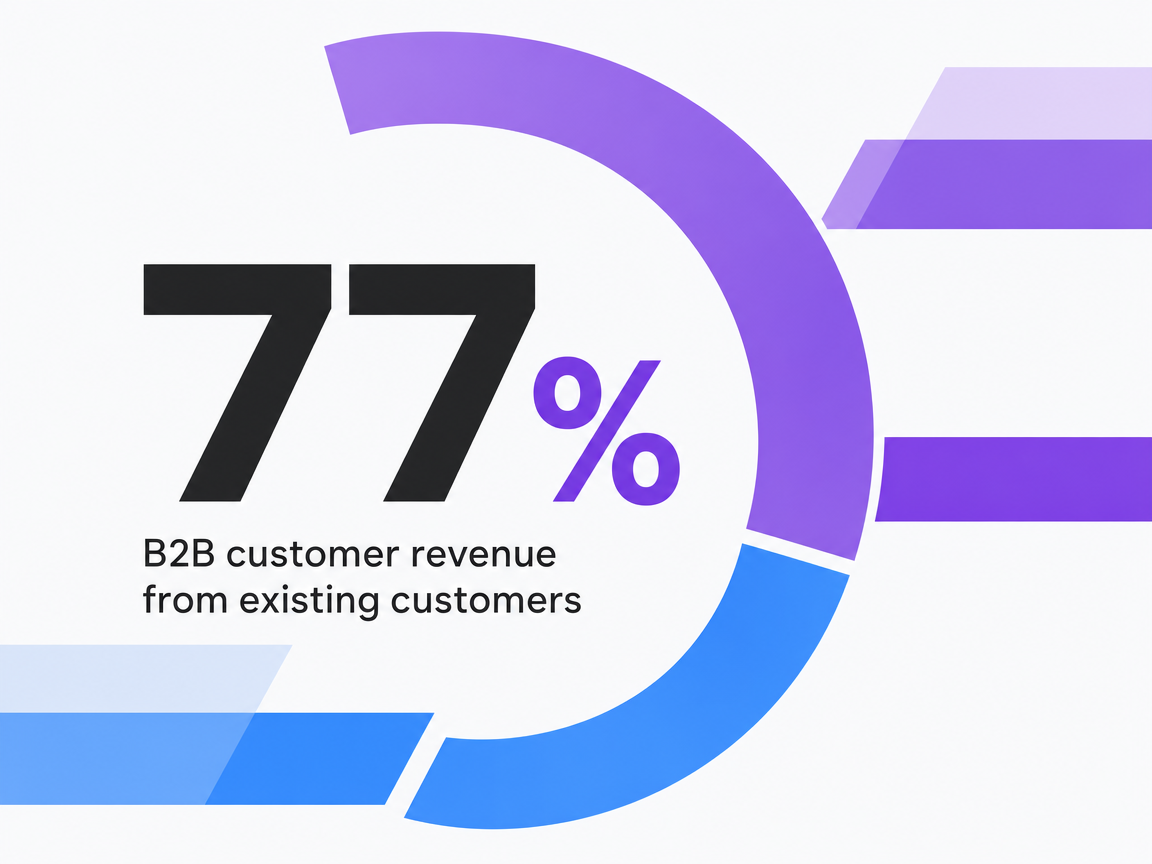 B2B customer revenue from existing customers
B2B customer revenue from existing customers
Test Predictable Content Workflows With Live Publishing
Evaluate true pipeline impact by publishing and measuring real content performance during your free trial period.
Condition Three: Measurement Tied to Pipeline, Not Traffic
The third condition is where most programs lose the argument with finance. A content team can report record sessions, time on page, and social shares while the CFO sees no movement in the pipeline forecast. The metrics being reported and the metrics being asked for are not in the same category.
Predictable growth requires a measurement model anchored to three financial primitives: pipeline influenced, customer acquisition cost, and customer lifetime value. Traffic and engagement remain useful as diagnostic indicators—signals that distribution and message-market fit are working—but they cannot stand in for revenue evidence. The ZoomInfo framework formalizes this by separating content metrics into five categories: traffic, engagement, distribution, lead generation, and revenue & ROI, with the first four feeding the fifth rather than substituting for it 13.
The benchmark a VP can cite in a budget conversation is concrete. Taboola's 2026 statistics roundup reports an average 2025 content marketing ROI of $7.65 per dollar spent, with a recommended 2026 budget mix that places content and SEO at 25–30% of marketing spend 15. That figure gives a defensible reference point for what a working content program returns when measurement is tied to revenue rather than reach. A program reporting only traffic cannot be compared to it.
CMI's 2025 research identifies the same maturity gap from the inside: nearly all B2B marketers use content marketing, but proving ROI and tying content metrics to business outcomes remain persistent pain points, particularly for teams without documented strategy 2. The gap is rarely an analytics problem in the technical sense. It is a definition problem. Teams measuring what their stack reports by default end up with traffic dashboards because that is what arrives pre-built. Teams measuring what the CFO will ask about end up with pipeline dashboards because they have to construct them deliberately.
The operational test for this condition is whether the content team can answer, in a single sentence per asset class, what financial event each piece of content is supposed to influence and how that influence is measured. Programs that pass this test can defend their budget. Programs that cannot are reporting activity.
The Five-Category Metric Stack a VP Can Hand to an Analyst
The measurement model that survives finance review fits on a single page. ZoomInfo's framework organizes content metrics into five categories, each feeding the next, so that traffic and engagement data eventually resolve into revenue evidence rather than sitting next to it 13.
Traffic : Measures whether the program is reaching the right audience: organic sessions from ICP-matched accounts, branded versus non-branded splits, and share of search against named competitors. Volume alone is diagnostic, not directional.
Engagement : Measures whether the audience is doing something with what it finds: scroll depth on high-intent pages, return visits from target accounts, and content consumption sequences inside known buying committees. This is where account-level analytics replace pageview averages.
Distribution : Measures whether the content reaches its audience without paying for the same impression twice: email open and click rates by segment, organic share by referring domain, and sales-team usage of content in active opportunities 12.
Lead generation : Measures qualified conversions tied to specific assets: MQLs by source content, demo requests by topic cluster, and form completion rates segmented by ICP fit.
Revenue and ROI : Closes the loop with three calculations: pipeline influenced by content touchpoints, CAC payback by acquisition channel, and CLV by cohort entry point. The ROI formula reduces to (revenue from content − cost of content) ÷ cost of content 13. That is the number the CFO wants.
Condition Four: Execution That Scales Without Proportional Headcount
The fourth condition is where strategy meets the calendar. A precise ICP, lifecycle coverage, and a pipeline-grade measurement model still produce nothing until the team can ship the work that those conditions require—at the volume, cadence, and segment-level relevance the model assumes. Most programs cannot.
This is the execution gap. Harvard Business Review–branded research on B2B go-to-market programs identifies it directly: companies design strategies that depend on cross-functional coordination, segment-specific messaging, and disciplined process, then fall short because the operating model cannot keep pace with what was planned 10. The strategy is rarely the failure point. The throughput is.
Inside content specifically, the gap shows up as a math problem. A lifecycle program with four revenue events, three to five ICP segments, and a sales-enabled mid-funnel requires production capacity that a 2–6 person team plus a single agency retainer cannot sustain without quality slipping or coverage thinning. Hiring linearly against the calendar collapses margin. Outsourcing linearly against the calendar collapses brand voice and institutional knowledge. Neither path produces predictable output.
The structural answer is an execution model where strategy, production, and publishing run inside one governed loop rather than across briefing cycles between disconnected vendors and freelancers. AI-augmented production is the mechanism most programs are adopting to close the gap. CMI's 2026 outlook reports that AI is now widespread in B2B content operations, with operational efficiency among the top benefits marketers attribute to evolving programs 3. The category has moved past pilot-stage curiosity.
The market data confirms the institutionalization. Market.us values the global AI content marketing market at roughly $2.4 billion in 2023 and projects it to reach approximately $17.6 billion by 2033, at a compound annual growth rate of 25.68% 16. A category compounding at that rate over a decade is not speculative tooling. It is the production layer the next generation of content functions will be built on.
What separates an execution model that scales from one that simply produces more is governance. AI-augmented production without human approval at the strategy and publishing gates reverts to volume without judgment, which is precisely the failure mode that erodes brand voice and trust 3. The model that holds the four conditions together is approval-first: AI handles signal reading, ranking, drafting, and tracking; the marketing team retains decision authority on what ships and why. That division of labor is what allows a 2–6 person content function to operate against an ICP-segmented, lifecycle-covered, pipeline-measured roadmap without adding headcount in proportion to the work.
Execution, defined this way, is not a downstream concern. It is the condition that determines whether the other three conditions ever produce revenue.
See How Enterprise Teams Define and Operationalize Predictable Content Pipelines
Request a workflow consultation to benchmark your content marketing process against data-driven standards for pipeline predictability—ideal for marketing leaders managing complex, multi-channel execution.
If You Run Content Across Multiple Locations or Practices
A note for a narrower audience: VPs running content for multi-location service businesses—law firm groups, DSOs, home services rollups, behavioral health networks, senior living portfolios—operate under a different math problem than single-entity B2B. The four conditions still hold, but each one multiplies by the number of locations or practices in the portfolio.
ICP precision becomes ICP precision per market, because a personal injury practice in Phoenix does not convert on the same themes as one in Boston. Lifecycle coverage becomes lifecycle coverage per service line, since a dental implant patient and an orthodontic patient share almost no content path. Measurement becomes location-level pipeline attribution, not portfolio-level averages that hide which markets are funding which. And execution multiplies fastest of all, because what was one calendar becomes ten or fifty.
The traditional consolidation model—an agency retainer per region, a freelance bench for overflow, an internal PM coordinating across them—does not survive that multiplication without cost growing faster than pipeline. CMI's 2026 outlook identifies operational efficiency as one of the top benefits marketers attribute to programs evolving past legacy production models, which for portfolio operators is less a preference than a margin requirement 3.
The directional shift is from per-location vendor stacks to a unified execution layer where ICP, lifecycle assets, and measurement run inside one governed loop across every location, with human approval at the strategy and publishing gates. Output scales with the portfolio; headcount does not.
Where Most Programs Fail the Definition
Most mid-market content programs fail not because they violate the definition in obvious ways, but because they pass three of the four conditions and quietly miss the fourth. The pattern is consistent enough to predict.
- The most common failure is measurement. A program with a credible ICP, lifecycle ambitions, and an AI-assisted production stack still reports sessions and shares to the executive team because no one has rebuilt the dashboard around pipeline influence, CAC, and CLV. The result is a function that may be working and cannot prove it—a category CMI's 2025 research describes as the persistent maturity gap between content activity and revenue attribution 2.
- The second failure mode is lifecycle starvation. Acquisition consumes the calendar, expansion and renewal content sit on a wish list, and the 77% of revenue that comes from existing customers is served by whatever customer success can produce on its own 1.
- The third is ICP drift. The profile was defined two years ago, closed-won data has since contradicted it, and no one has refreshed the inputs. Conversion and ROI lifts of 36% and 68% available to programs operating on a current ICP go unclaimed 7.
- The fourth, and increasingly common, is execution capacity that cannot match the strategy on paper.
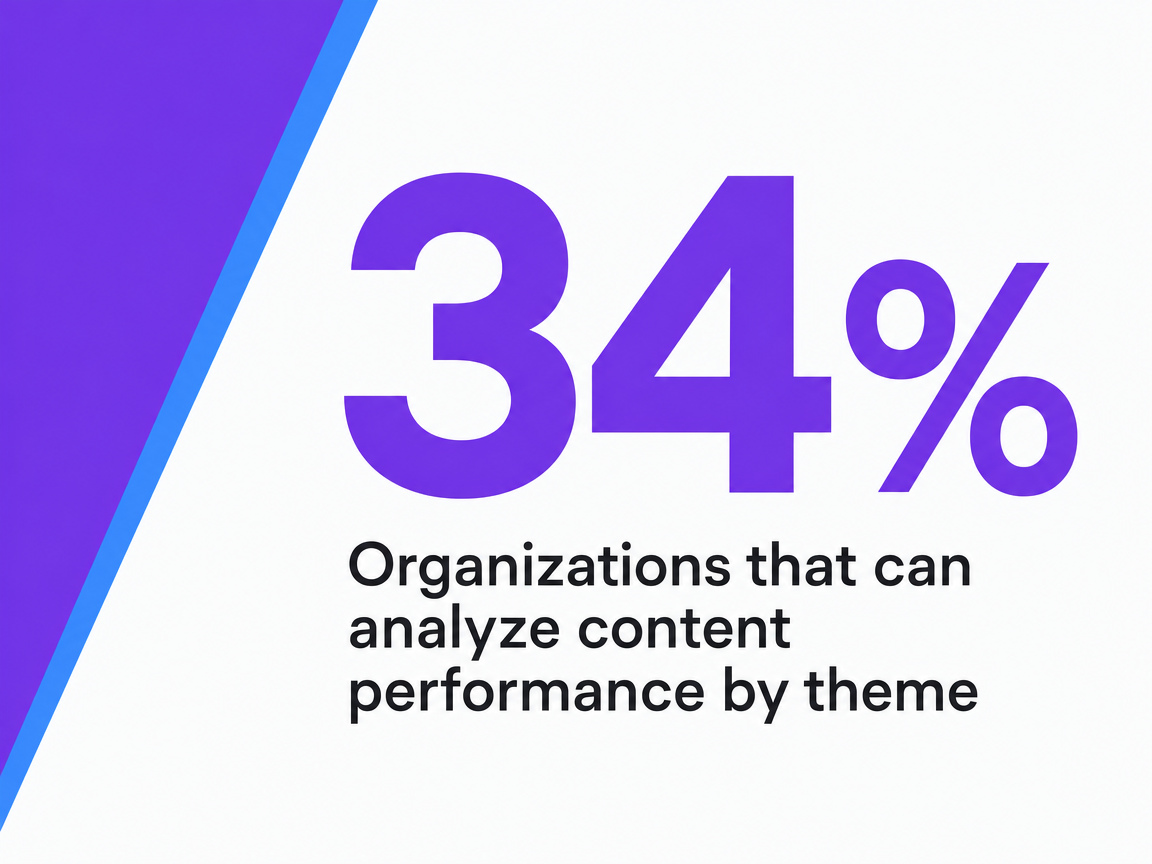 Organizations that can analyze content performance by theme
Organizations that can analyze content performance by theme
What This Means for the 2026 Content Function
The content function that produces predictable growth in 2026 looks structurally different from the one most mid-market teams inherited. It is organized around four conditions, not four channels. ICP precision is treated as an analyst-grade input that gets refreshed on closed-won data, not a slide deck from a 2023 offsite. Lifecycle coverage is a budget category, not an aspiration. Measurement resolves to pipeline influenced, CAC, and CLV, with traffic and engagement positioned as diagnostics feeding those numbers 13. Execution runs inside one governed loop where AI handles signal reading, drafting, and tracking while the marketing team retains approval authority over what ships.
The shift is already visible in the benchmark data. CMI's 2026 outlook documents that strategy, audience insight, and sales integration—not format experimentation—separate growth-producing programs from cost centers, and that operational efficiency is now among the top benefits marketers attribute to evolved programs 3. For VPs rebuilding the function against that benchmark, platforms such as Vectoron exist to consolidate the execution layer without surrendering the judgment that makes the other three conditions work.
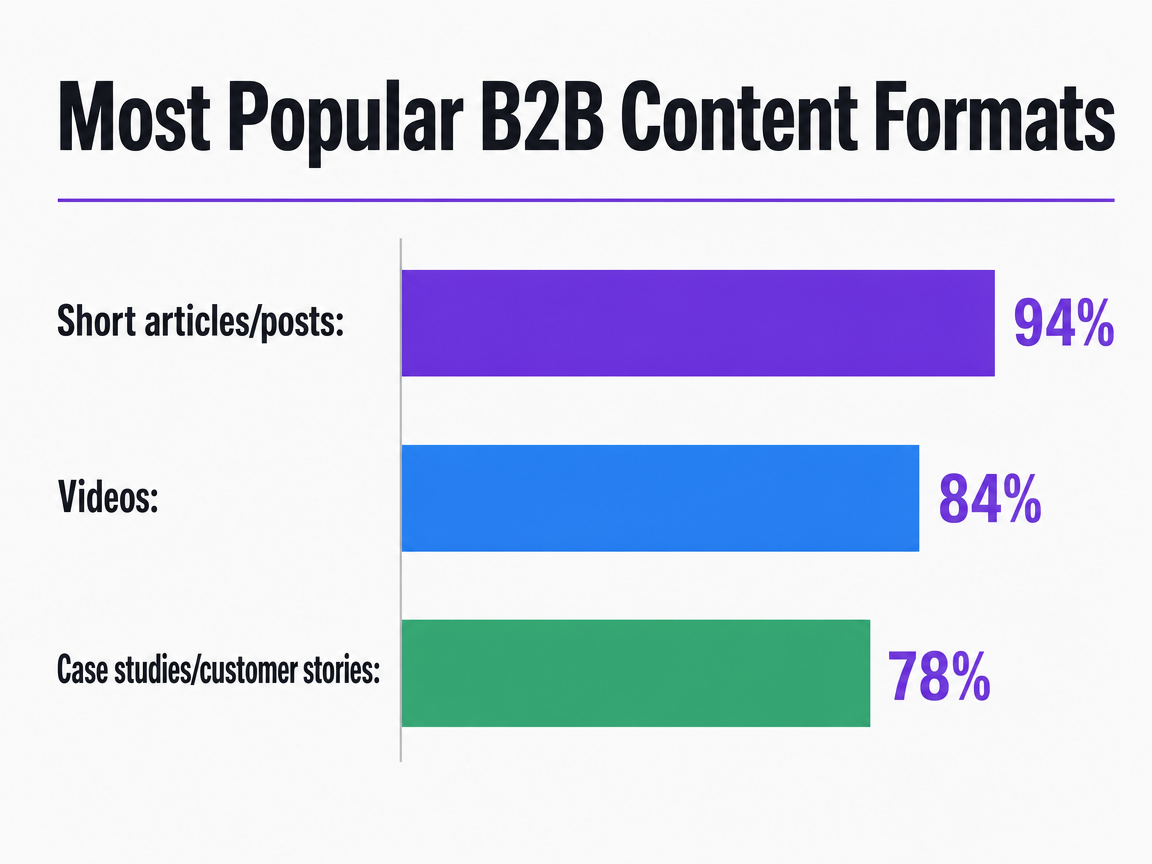 Most Popular B2B Content Formats
Data from a CMI benchmark study (via MarketingProfs) shows the percentage of B2B marketers who use the following content formats.
Frequently Asked Questions
References
- 1.What's Next In B2B Content? Five Important Focus Areas For 2022.
- 2.B2B Content Marketing: 2025 Benchmarks & Trends.
- 3.B2B Content and Marketing Trends: Insights for 2026.
- 4.B2B Content Marketing Benchmarks, Budgets, and Trends: Outlook for 2024.
- 5.B2B Content Marketing Benchmarks, Budgets, and Trends: Outlook for 2024.
- 6.B2B Marketing Benchmark Report.
- 7.The ICP gap costing you conversions (and your B2B marketing).
- 8.Account-Based Marketing (ABM).
- 9.B2B Account-Based Marketing Playbook.
- 10.HBR Research Reveals Execution Gap in B2B Go-to-Market Strategy.
- 11.Why Your Sales Team Needs Pipeline Management Training.
- 12.The B2B Content Guide: Make Sales Your Ally In Content Marketing.
- 13.Content Marketing Metrics B2B Teams Need to Prove Revenue Impact.
- 14.Content marketing guide: strategy framework for business growth.
- 15.2026 Content Marketing Statistics: Key Data to Shape Your Strategy.
- 16.AI Content Marketing Market Share | CAGR of 25.68%.