
Key Takeaways
- Predictable pipeline comes from instrumenting each funnel stage with conversion targets and feedback loops tied to opportunity progression, not from increasing publishing cadence.
- Reframe the funnel around Forrester's buying-group waterfall: track account-level opportunity advancement across five to ten stakeholders rather than individual lead handoffs 15.
- Content contribution thins toward revenue—76% of marketers tie it to demand but only 58% to revenue—so bottom-funnel assets need the deepest CRM instrumentation per piece 3.
- Focus next on a Monday diagnostic: map the active opportunity set to last content touch by role and flag accounts missing asset consumption in 60 days.
Why Publishing on Schedule Still Misses the Pipeline Number
Most content programs hit their publishing calendar and miss their pipeline number. The blog ships weekly. The gated assets launch on time. The webinar runs. Yet the qualified opportunities meeting marketing-sourced targets remain stubbornly flat, and the VP of Marketing walks into the quarterly review with output metrics instead of revenue contribution.
The disconnect is not a content quality problem. It is an instrumentation problem. In the CMI/MarketingProfs survey of 894 B2B marketers, 76% reported that content marketing generated demand or leads, but only 58% could tie it to sales or revenue—an improvement from 42% the year prior, yet still the weakest measurement point in the funnel 3. The further down the funnel content is expected to perform, the less most teams can prove it does.
Predictable pipeline comes from treating each stage as a system with defined inputs, conversion targets, and feedback loops tied to opportunity progression—not from increasing publishing cadence. Forrester's Revenue Waterfall reframes this around buying groups and opportunities rather than individual leads, giving marketing leaders a structured way to track how content moves real deals forward 15.
The sections that follow rebuild the funnel as an operating model: stage-specific assets, benchmarked conversion math, velocity instrumentation for a compressing buying cycle, and a diagnostic for where predictability breaks. The calendar is the easy part. The economics underneath it are what determine whether content hits the number.
From Lead Funnel to Buying-Group Waterfall: Resetting the Operating Model
The standard funnel diagram—awareness on top, decision on the bottom, one prospect moving down it—was built for a world where a single buyer requested a demo and signed a contract. That world no longer exists in most B2B categories. Purchases now route through buying groups of five to ten stakeholders, each consuming different content, entering the process at different times, and exiting just as unevenly. A funnel drawn around individual leads cannot model that behavior, which is why pipeline forecasts built on lead counts keep missing.
Forrester's Revenue Waterfall replaces the lead-based funnel with an opportunity-based one. It is designed to
"focus on buying groups rather than traditional leads"
and to align marketing, revenue development, and sales around the same unit of progression: the qualified opportunity tied to a specific buying group at a specific account 15. The shift is not cosmetic. It changes what marketing instruments, what it forecasts, and what it counts as progress.
Under a lead-funnel model, marketing's job ends when an MQL is handed off. A blog visit, a gated download, and a webinar registration all count as separate "leads," even when they come from three people at the same account researching the same problem. Under a buying-group waterfall, those three signals consolidate into one opportunity in motion, and content's job is to expand coverage across the group—reaching the economic buyer, the technical evaluator, and the end user with assets each one will actually open.
Operationally, the reset changes three things. Reporting moves from lead volume to account-level opportunity progression. Content planning moves from persona-by-persona campaigns to buying-group coverage maps, where the question becomes whether every required role at a target account has consumed a relevant asset in the last 60 days. And measurement moves from MQL-to-SQL conversion to stage-to-stage opportunity advancement, the metric that actually correlates with closed revenue.
For marketing leaders running predictable pipeline programs, the practical implication is that the funnel diagram on the wall is probably wrong. It shows stages a single person passes through. What needs to be instrumented is how a group of people, working in parallel on the same purchase decision, advances through evaluation. Every stage discussed in the sections that follow assumes this reframing: the unit of analysis is the buying group's opportunity, not the individual's email address.
Where Content Actually Moves the Funnel
Content's measurable contribution is not evenly distributed across the funnel. It compounds at the top, holds steady through the middle, and thins out at the bottom—where revenue attribution lives. The CMI/MarketingProfs 2024 benchmark, drawn from 894 B2B marketers, quantifies the gradient:
- 76% reported that content marketing generated demand or leads
- 63% said it nurtured leads
- 58% said it helped generate sales or revenue, an improvement from 42% the year prior 3
That 18-point gap between demand generation and revenue contribution is the predictability gap. It does not mean content stops working at the bottom of the funnel. It means most teams stop instrumenting it there. Top-of-funnel performance reads cleanly in analytics—organic sessions, asset downloads, newsletter signups. Mid-funnel engagement still shows up in email open rates and webinar attendance. Bottom-of-funnel attribution requires CRM integration, opportunity stamping, and a closed feedback loop between content consumption and deal progression, which is exactly where most content operations lose visibility.
The strategic implication for marketing leaders is not to abandon bottom-funnel content investment. It is to recognize that the funnel's economics are front-loaded in measurement maturity and back-loaded in revenue weight. A program that publishes prolifically at the top and goes dark at the bottom will report strong engagement metrics and weak pipeline contribution—the exact pattern most quarterly reviews surface.
Reallocating effort follows from this asymmetry. Top-of-funnel assets earn their keep through volume and SEO compounding, so the discipline there is editorial throughput and topical coverage. Mid-funnel assets—comparison guides, analyst-style benchmark reports, implementation walkthroughs—need fewer pieces but higher conversion engineering, because each one carries a heavier opportunity-progression load. Bottom-of-funnel assets, including ROI calculators, security and procurement documentation, and reference case studies, deserve the deepest instrumentation budget per asset, because they are what closes the 18-point measurement gap.
The benchmark also exposes a planning error common in publishing-calendar-driven programs: treating all stages as equally productive content factories. They are not. Each stage has a different ratio of asset volume to instrumentation depth, and the funnel only produces predictable pipeline when production planning reflects that ratio. The next section breaks the math down stage by stage.
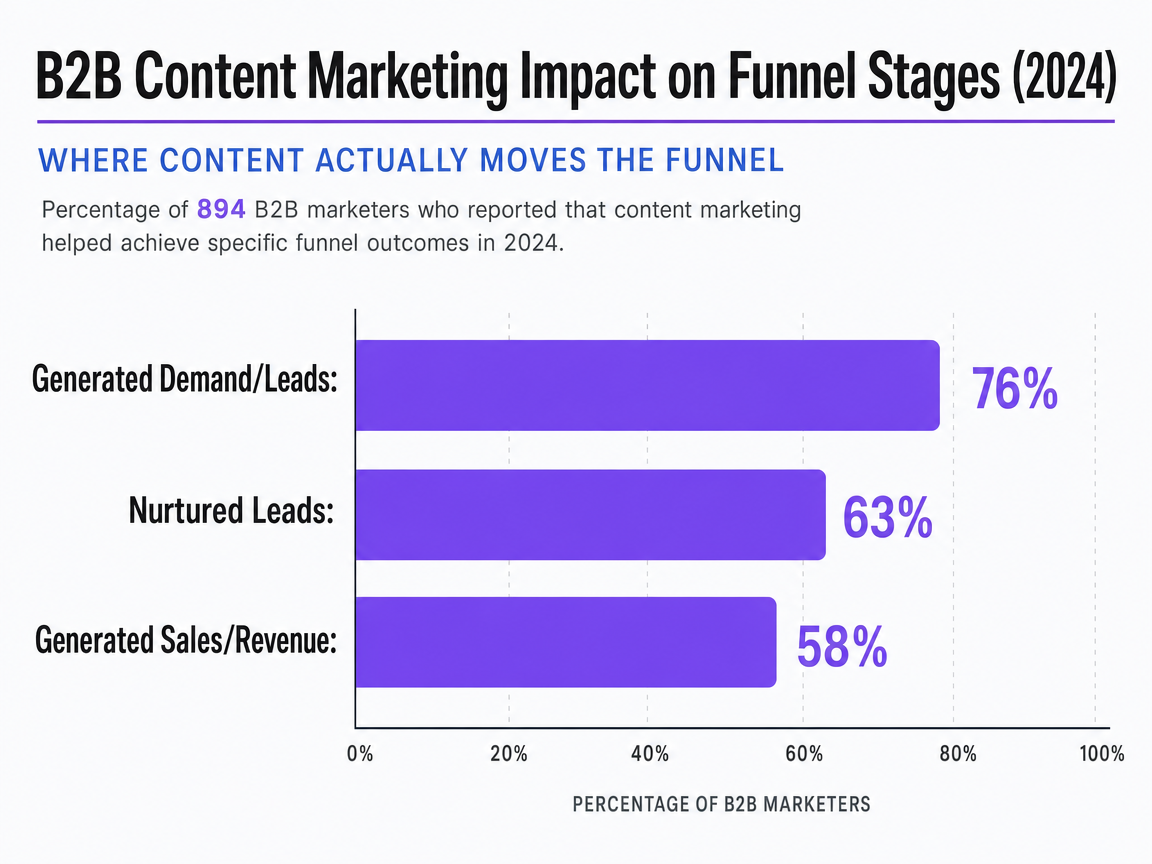 B2B Content Marketing Impact on Funnel Stages (2024)
A bar chart showing the percentage of 894 B2B marketers who reported that content marketing helped achieve specific funnel outcomes, based on CMI/MarketingProfs 2024 research.
Test a Predictable Content Funnel This Week
Publish real campaigns and measure pipeline impact during your free trial—no delays, no commitment required.
Stage-by-Stage Instrumentation
Top of Funnel: Buyer Question, Asset Format, and the Velocity Metric That Matters
At the top of the funnel, the buying group is not asking which vendor to choose. It is asking whether the problem is worth solving at all. Content here answers diagnostic questions: how the problem manifests, what it costs to ignore, and what categories of solution exist. The buyer arrives through organic search, peer referral, or a social post that named a symptom they had not yet articulated.
Asset formats follow the question. SEO-anchored pillar pages, category explainers, benchmark roundups, and short analyst-style commentary do the heavy lifting. The CMI/MarketingProfs 2024 study found that 69% of B2B marketers plan to increase video investment and 53% plan to increase thought leadership investment—both formats that earn awareness without demanding a form submission 3. Stage-appropriate distribution matters as much as the asset itself, since McKinsey's B2B Pulse work found that companies deploying five advanced omnichannel tactics are twice as likely to grow market share by more than 10% annually 5.
The velocity metric that matters at this stage is not traffic. It is the rate at which net-new accounts from the target list show first-touch engagement within a defined window—typically 30 days from publication. Page views and impressions describe reach. Account-level first-touch rate describes whether the funnel is loading the right inventory. A program publishing 12 pieces a month that touches three target accounts is underperforming a program publishing four pieces that touches forty. Output detached from account coverage is the most common predictability failure at this stage, and it shows up only when reporting moves from session counts to account-list penetration.
Mid Funnel: Engineering the Consideration-to-Opportunity Conversion
Mid-funnel content is where most pipeline programs leak. The buying group has accepted that the problem is real and is now comparing approaches, vendors, and internal build options. The question shifts from "does this matter" to "which path is defensible to the rest of the committee." Content at this stage carries the burden of arming an internal champion with material that survives a procurement review.
The asset mix narrows and deepens. Comparison guides that name categories rather than competitors, implementation walkthroughs, analyst-style benchmark reports, vendor-evaluation checklists, and recorded technical deep-dives do the work. Each piece is built to be forwarded inside an account, not just read by one person. Email remains the dominant nurture channel, with a B2B average conversion rate around 2.53% across sectors—a benchmark that calibrates list-to-opportunity expectations rather than dictating targets, since list quality and offer strength move the number significantly 11.
The conversion engineering happens in three places:
- Every mid-funnel asset includes an explicit next step tied to opportunity progression, not just another download.
- The asset library is built for buying-group coverage: a single insight is repackaged into a technical brief for the evaluator, a financial summary for the economic buyer, and a one-page workflow diagram for the end user.
- Engagement is stamped to the account record so sales sees which roles have consumed which materials before the first call.
The metric that defines mid-funnel health is the consideration-to-opportunity conversion rate measured at the account level, not the lead level. A 5% MQL-to-opportunity rate looks acceptable on a dashboard but masks the reality that 70% of accounts touched at the top never reach the middle. The instrumentation question is which accounts moved from passive consumption to active multi-stakeholder engagement in the last quarter, and which mid-funnel assets correlated with that movement.
Bottom of Funnel: Decision Assets, Buying-Group Coverage, and Win-Rate Inputs
Bottom-of-funnel content is the smallest asset category by volume and the largest by revenue weight. The buying group has narrowed the field and is now building the internal case to sign. Risk dominates the conversation: implementation risk, vendor risk, integration risk, and the political risk of recommending the wrong choice. Content that does not address those risks directly does not move deals, regardless of how well it ranks.
The asset set is narrow and operationally heavy. ROI calculators with editable inputs, security and procurement documentation, reference case studies tied to comparable use cases, implementation timelines, and customer-led recorded sessions form the core 7. Each piece is built to answer a procurement question, not to generate a click. The buying-group coverage test applies most strictly here: every required role—economic buyer, technical evaluator, legal reviewer, end-user sponsor—needs a corresponding asset that addresses their specific objection.
The metric that matters is the opportunity-to-closed-won rate, segmented by which bottom-funnel assets the buying group consumed before contract signature. This is the measurement gap that the 18-point spread between demand generation and revenue contribution exposes across the broader benchmark data. Closing it requires CRM-level stamping of asset consumption against opportunity stage transitions, so the question "which case study correlates with shorter procurement cycles in the financial services segment" becomes answerable rather than anecdotal.
The predictability failure at this stage is asset gaps in the coverage map. A program with strong top and mid-funnel libraries but no recent reference case study in the buyer's vertical, or no current security documentation, watches opportunities stall in late stages without a clear cause. The fix is inventory management, not more publishing.
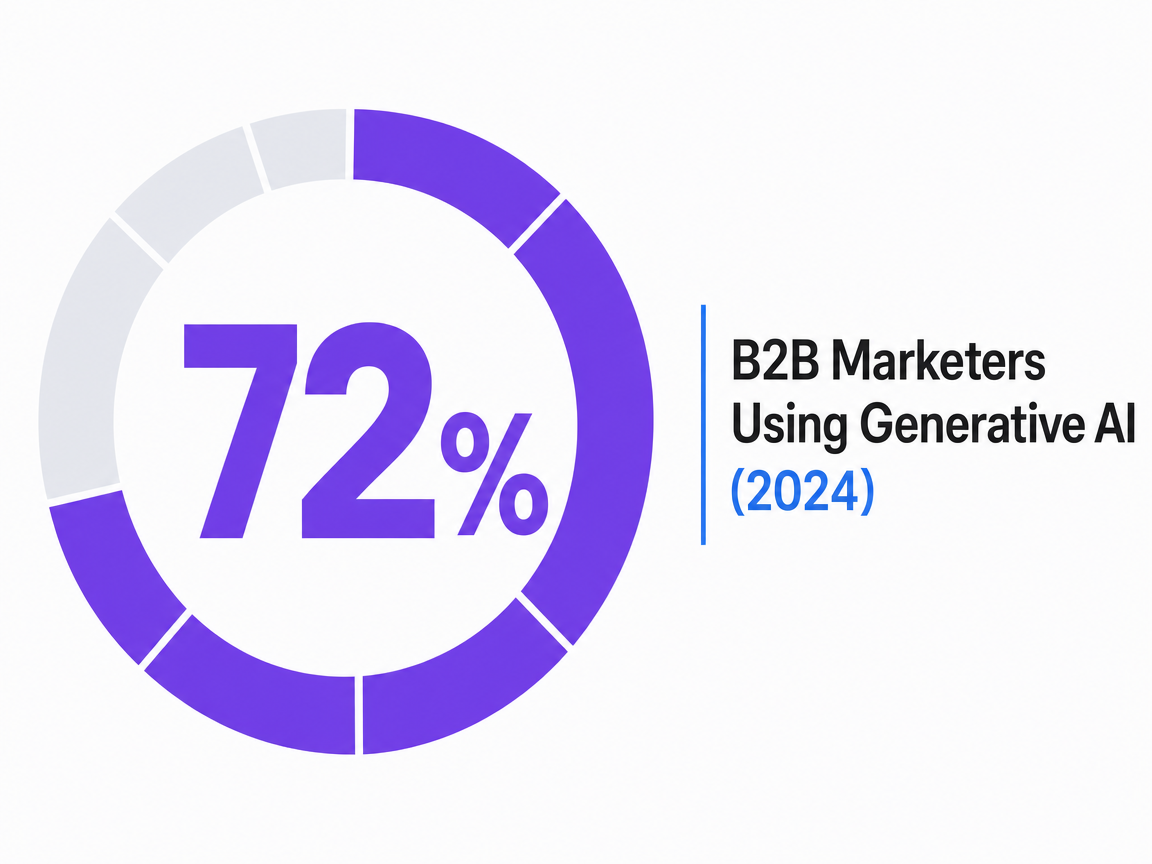 B2B Marketers Using Generative AI (2024)
B2B Marketers Using Generative AI (2024)
The 10.1-Month Reality: Designing for Compression, Not Volume
The average B2B buying cycle is getting shorter. 6sense data compiled by Directive Consulting shows the average cycle fell from 11.3 months in 2024 to 10.1 months in 2025, a 10.6% compression in a single year 13. That month-and-change feels small on a calendar and large on a content operation. Every stage of the funnel has roughly 11% less time to do its work, and most editorial calendars were not rebuilt to reflect it.
Compression changes what predictable pipeline requires. Output volume becomes the wrong optimization target. A program that adds two more blog posts a month into a cycle that is shrinking by weeks is solving last year's problem. The right targets are stage SLAs and feedback-loop latency: how fast a buying-group signal at one stage triggers the next relevant asset, and how fast that asset reaches the right role at the account.
Three instrumentation moves matter when the cycle compresses:
- Asset response time—the gap between a mid-funnel engagement and a tailored follow-up reaching the same buying group—needs a defined SLA measured in days, not weeks.
- Stage-to-stage advancement reporting needs to update weekly, not quarterly, so stalled opportunities surface while they are still salvageable.
- Content inventory gaps need to be flagged against the active opportunity set, so a missing vertical case study or outdated security brief becomes a production ticket the day an opportunity stalls on it.
The implication for marketing leaders is that the calendar is no longer the operating document. The active opportunity set is. Production planning that starts with "what publishes this month" produces content that arrives after the cycle has already moved past it. Production planning that starts with "which buying groups are mid-stage right now and what asset gap is holding them" produces content that compresses with the cycle instead of fighting it.
The Predictability Diagnostic: What Breaks at Each Stage
Predictability fails in patterns, not in random places. A VP of Marketing reviewing a content program against pipeline targets can run a five-minute diagnostic by stage and find the same three or four breakages in most organizations. The value of naming them is that each has a different fix, and most teams attempt the wrong one.
At the top of the funnel, the dominant failure is coverage drift. The editorial calendar fills with topics that earn traffic but do not touch the target account list. Symptom: rising organic sessions, flat first-touch account penetration. Fix: rebuild the topical map against the named account list, not against keyword volume alone.
In the middle, the failure is single-role asset design. The team produces strong comparison content for the technical evaluator and nothing for the economic buyer or the end-user sponsor. Symptom: mid-funnel engagement concentrated in one job function per account, opportunities that stall when the champion presents internally. Fix: convert each insight into role-specific formats, a discipline the CMI/MarketingProfs benchmark indirectly surfaces when 48% of marketers cite "aligning content with the buyer's journey" as a top challenge 3.
At the bottom, the failure is inventory gaps. The library lacks a current case study in the buyer's vertical, the security brief is two product versions old, or the ROI calculator does not reflect the latest pricing model. Symptom: late-stage opportunities slipping quarters without a clear objection. Fix: tie content inventory to the active opportunity set, so a missing asset becomes a production ticket the day an opportunity stalls on it.
The cross-stage failure is reporting cadence. Programs that review funnel performance quarterly cannot intervene inside a 10.1-month cycle with any precision. Weekly opportunity-progression reporting, tied to which assets the buying group consumed between stage transitions, is the minimum instrumentation a predictable program runs. A VP can administer this diagnostic Monday morning: pull the active opportunity set, map each to the last content touch by role, and flag every account where a required role has no asset consumption in the last 60 days. The gaps that surface are the pipeline problem.
See How Leading Brands Build Predictable Content Pipelines With AI Coordination
Request a walkthrough of AI-powered workflows that align content, SEO, and conversion tracking—designed for agencies and enterprise teams seeking measurable efficiency without additional headcount.
Production Economics: Three Ways to Run a Stage-Instrumented Funnel
Running a funnel as an instrumented system, not a publishing calendar, exposes a cost question most marketing budgets do not model well. The line item on the spreadsheet is usually "content"—a single number for a bundle of agency retainers, freelance invoices, and salaried producers. The relevant question is cost per stage-output and time-to-publish per asset type, because those are the variables that determine whether the funnel can keep pace with a 10.1-month buying cycle and the budget pressure of 46% of B2B marketers expecting content spend to rise in 2025 4.
Three operating models dominate:
- The traditional stack combines a mid-market content agency retainer with specialist freelancers for video, design, and technical writing.
- The in-house model expands the team with senior strategists, editors, and producers carrying fully-loaded salaries plus tooling.
- The AI-coordinated model routes briefing, drafting, and stage-tagged distribution through a platform with human approval gates—Vectoron publishes a $599/month post-trial rate as one reference point in this category.
The comparison below uses variables the VP plugs in rather than invented figures, because retainer and salary ranges vary too widely by market to anchor a single number.
| Variable | Agency + Freelance Stack | In-House Team Expansion | AI-Coordinated Platform |
|---|---|---|---|
| Monthly fixed cost | Agency retainer + freelance pool | Fully-loaded senior strategist + editor + producer salaries | Platform fee (e.g., $599/mo published rate) + internal approver time |
| Cost per TOFU asset | Retainer ÷ deliverables; high variance | Salary load ÷ output; low marginal cost at volume | Platform throughput; flat marginal cost |
| Cost per MOFU asset | Premium per deliverable (research, design) | Higher load—senior input required | Platform + heavier approver review |
| Cost per BOFU asset | Often scoped separately | Concentrated in senior headcount | Platform + SME and legal review time |
| Time-to-publish (typical) | 2–6 weeks (briefing + revision cycles) | 1–3 weeks (internal queue dependent) | Days, gated by approval cadence |
| Coordination overhead | High—briefs, status meetings, handoffs | Medium—internal but still cross-functional | Low—signals routed to execution in one loop |
| Predictability risk | Vendor turnover, scope creep | Hiring cycle, attrition | Approval bottlenecks, governance maturity |
The instructive column is time-to-publish. A compressing buying cycle penalizes any model with multi-week briefing rounds, regardless of unit cost. Coordination overhead—not asset price—is what most often breaks production economics inside a stage-instrumented funnel.
AI as Coordination Layer, Not Content Volume Hack
The dominant framing of AI in content marketing—write more, write faster, publish at scale—solves the wrong problem. A funnel already producing 12 pieces a month does not become predictable by producing 24. It becomes predictable when signals from the buying-group opportunity set reach production decisions inside days, not the two-to-six-week briefing cycles that traditional stacks impose.
The adoption data backs the reframing. 72% of B2B marketers in the CMI/MarketingProfs survey of 894 practitioners already use generative AI tools, but 61% report their organization lacks guidelines for that use 3. The gap between adoption and governance is what produces the flood of low-signal output most VPs are now trying to filter out of their own programs. Volume without coordination compounds the predictability problem rather than solving it.
The operationally useful application of AI in a stage-instrumented funnel is coordination, not drafting. Three coordination jobs matter:
- Signal routing: an account moving from passive consumption to multi-stakeholder engagement should trigger the next stage-appropriate asset against the named gap, not wait for the next editorial planning meeting.
- Buying-group coverage tracking: a system that knows which roles at which target accounts have consumed which assets in the last 60 days surfaces inventory gaps before opportunities stall on them.
- Approval-gated execution: production moves through human sign-off on strategy and copy, so AI compresses cycle time without removing editorial control.
Framed this way, AI is not a replacement for the senior strategist or the editor. It is a replacement for the briefing-and-handoff overhead that sits between them and the published asset. Platforms built on this premise—Vectoron among them—route signals to ranked recommendations, hold every decision at a human approval gate, and execute only the approved work, which is the part of the operating model that determines whether a 10.1-month cycle gets matched or missed.
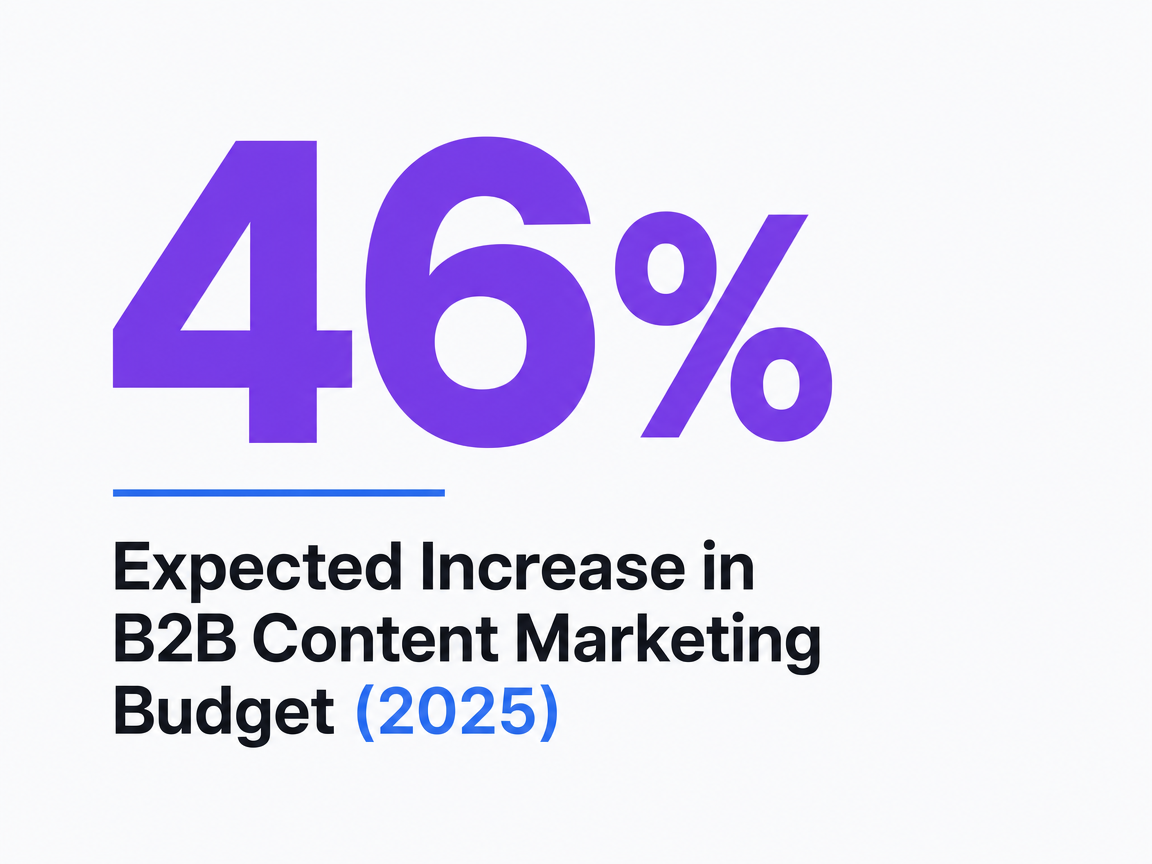 Expected Increase in B2B Content Marketing Budget (2025)
Expected Increase in B2B Content Marketing Budget (2025)
Frequently Asked Questions
References
- 1.Understanding and mapping the B2B buyer journey - Qualtrics.
- 2.Content marketing across a B2B buyer journey (University of Minnesota thesis).
- 3.B2B Content Marketing Benchmarks, Budgets, and Trends: Outlook for 2024 [Research].
- 4.B2B Content Marketing Benchmarks, Budgets, and Trends: Outlook for 2025 (Key Takeaways).
- 5.The multiplier effect: How B2B winners grow.
- 6.The future of B2B sales is hybrid.
- 7.The B2B Buyer Journey: Create Content That Guides Your Audience.
- 8.The Buyer's Journey Guide: Turning Prospects into Customers.
- 9.The B2B Buyer's Online Journey: From Awareness to Consideration to Conversion.
- 10.B2B Conversion Rates By Industry – 2026.
- 11.B2B Conversion Rates in Numbers: Our Data + Benchmarks.
- 12.B2B Content Marketing Benchmarks, Budgets, And Trends.
- 13.B2B Content Marketing Statistics: 6 Signals to Guide 2026 Decisions.
- 14.2024 B2B Marketing Benchmark Report.
- 15.Accelerate Opportunities With The Forrester B2B Revenue Waterfall.