
Key Takeaways
- SaaS content writing now serves buying committees of five to ten stakeholders, each pulling three to five role-specific assets, which pushes deals to 20-35 distinct content interactions 4.
- Briefs built around committee gaps, naming the role, stage, and internal argument a reader must make, outperform keyword-led briefs because 51% of buyers call vendor content too generic 6.
- A six-stage production pipeline with AI assistance underneath research and drafting, while humans own briefs and subject-matter review, lets teams scale from eight to thirty assets monthly without adding writers.
- Measurement should tag every asset by committee role and buying stage, then report coverage, influence on progressed deals, and decay, giving finance a fundable model rather than session counts 7.
The buying committee changed the job description
The work called "content writing" inside a SaaS team in 2025 is not the same job it was five years ago, and the change did not come from the writing side. It came from the buyer. McKinsey's tracking of B2B channel preference puts the shift in plain numbers: the share of B2B businesses whose buyers prefer digital interactions climbed from roughly 20% in 2017 to 67% in its recent reads 2. That figure measures stated channel preference across surveyed B2B firms, not a single SaaS vertical, but the direction holds across categories that have been studied.
What that means operationally is straightforward. A buying committee now expects to self-educate across multiple sessions before a vendor ever joins the conversation. The asset they read at 9pm on a Tuesday is doing the work a sales engineer used to do on a discovery call.
That reframes what a SaaS content team is actually shipping. The deliverable is no longer "an article on topic X." It is evidence built for a specific role on a specific committee at a specific stage of evaluation. A VP of Engineering scanning a technical comparison, a Director of RevOps validating integration depth, a CFO checking implementation risk, and a Procurement lead pressure-testing pricing logic are reading entirely different documents, even when those documents share a URL.
The job description, then, has shifted from craft output to production operations. Writing quality still matters, but it is now table stakes inside a larger system: research that surfaces what each committee role needs, briefs that turn those needs into specific arguments, drafts that are accurate enough to survive subject-matter review, and measurement that reports back on which assets actually moved deals. The rest of this article treats content writing as that system, not as a discipline organized around individual writers.
The production math behind committee buying
If a single buyer reads three to five assets before booking a demo, the math is manageable. The committee scenario looks different. Research synthesized in a recent academic review of B2B SaaS buying puts the typical decision group at five to ten stakeholders, with roughly 75% of B2B buyers preferring digital or remote interactions across the journey 4. That figure is drawn from survey data spanning multiple B2B categories rather than a single SaaS cohort, but the structural implication holds: each role on the committee is self-serving through content before sales engagement happens.
Multiply that out. A seven-person committee, each consuming three to five assets specific to their role, lands between 21 and 35 distinct content interactions per deal. Not 21 page views on the same blog post. Twenty-one to thirty-five reads on documents that have to answer different questions: a security overview for IT, an integration map for RevOps, a pricing rationale for Procurement, a category-defining piece for the executive sponsor.
Two operational consequences follow:
- First, asset volume per account has to rise without a proportional increase in cost per asset, because the unit economics of a deal cannot absorb seven custom documents produced at agency rates.
- Second, the asset library has to be deep enough that committee roles find role-appropriate evidence already published, rather than waiting on bespoke creation inside a live sales cycle.
That is the production problem a modern SaaS content function is actually solving. It is not "publish more blog posts." It is "maintain a standing library of role-specific evidence across active categories, refreshed at the pace buyers are reading," which is what NetLine's consumption data also shows: committees pull multiple assets per stakeholder before progressing 5. The rest of the operating model exists to make that library possible at sustainable cost.
Why generic content stopped working
The specificity ceiling
The clearest signal that template-driven content has run out of room sits in Demand Gen Report's 2024 buyer survey: 51% of B2B buyers said vendor content was too generic and irrelevant, up from 38% the prior year 6. The sample is self-reported preference data from a buyer panel, not a controlled study, so the absolute number deserves some caution. The 13-point year-over-year jump is harder to wave off.
What "too generic" usually means in practice is not that the writing was bad. It means the asset answered a question the reader did not have. A category overview lands in the inbox of a Director of Security who needed a SOC 2 control-mapping document. A buyer's guide written for a generalist lands with a Head of Data Engineering who needed throughput benchmarks. The writing can be clean and still miss.
That specificity ceiling is where the old playbook breaks. Producing more posts on the same head terms, with the same outline templates and the same generalist framing, raises traffic but not pipeline contribution. Each additional asset competes against an asset library the buyer has already dismissed once. The teams that respond by tightening voice guidelines or hiring stronger writers tend to plateau in the same place, because the bottleneck is not prose quality. It is what the brief asked the writer to argue.
Briefs derived from committee gaps, not keyword lists
A keyword-led brief tells a writer the topic, the target query, the recommended length, and a few semantically related terms to include. A committee-gap brief tells a writer which role on which committee currently has no evidence to bring back to their group, and what argument that role needs to make internally to advance the deal.
Those produce different documents. The keyword brief on "data warehouse migration" yields a competent overview optimized for search. The committee-gap brief on the same topic, written for the Director of Analytics who has to defend a platform choice to a skeptical CTO, yields a teardown of three migration paths with explicit failure modes, a cost-of-delay model, and a paragraph the Director can paste into an internal memo. The first ranks. The second gets forwarded.
Building briefs this way changes inputs. The research stage pulls from sales-call transcripts, win/loss notes, support tickets, and review-site language to find the questions specific roles are actually asking before they convert. Search data still informs distribution and topic prioritization, but it stops being the only source of the argument. NetLine's consumption analysis points the same direction: committees pull multiple role-specific assets per stakeholder before progressing, and the assets that perform are the ones built around stakeholder questions rather than category overviews 5.
The operational shift is small in description and large in consequence. A brief template that requires a named role, a named stage, and a named internal argument before a writer is assigned forces specificity at the planning step, which is the only step where it is cheap to add.
Experience AI-Driven Content Production in Action
Generate, approve, and publish data-backed articles live on your site in your first week.
The asset mix buyers actually use
Buyer panels are unusually consistent on what they reach for during evaluation. Demand Gen Report's 2024 benchmark found that short-form content ranked first at 67% reliance, with webinars and digital events close behind at 65% 6. The sample is a self-reported buyer panel rather than a controlled experiment, so the numbers describe stated reliance, not measured behavior on a specific deal. The ordering, though, has held across multiple years of the same survey.
Two things follow from those numbers that often get missed inside content planning. Short-form is doing the early triage work: a 600-to-1,200-word piece that lets a committee member decide in under five minutes whether the vendor understands their problem well enough to keep reading. Webinars, paired with their on-demand replays and clipped excerpts, are doing the mid-stage validation work: a Director can forward a 12-minute segment to a peer and get sign-off without scheduling a call. Long-form research reports, ebooks, and analyst pieces still matter, but they sit lower in reported reliance because they require more commitment than most committee members will give a vendor they have not yet vetted.
For an in-house team running a finite production budget, the implication is concrete. The asset mix should weight toward formats buyers say they actually use, not formats the team finds easiest to template. That usually means more short-form pieces written for specific committee roles, a webinar program treated as a content factory rather than a one-off event, and fewer 5,000-word definitive guides published on the assumption that length signals authority. Length signals length. Specificity signals fit.
A production operating model that compresses cycle time
Six stages: research, brief, draft, review, publish, measure
Teams that ship role-specific assets at the volume the committee math demands tend to run their function as a pipeline with six named stages, each with its own owner and cycle-time target. The names vary; the sequence does not.
- Research pulls the inputs: search data, win/loss notes, sales-call transcripts, support tickets, review-site language, and competitor gaps. Target one to two days per topic cluster, not per asset.
- Brief converts research into a one-page document naming the committee role, the buying stage, the internal argument the reader needs to make, and the failure modes a writer should address. Target half a day. A brief that cannot specify the role and the argument is sent back, not forward.
- Draft is the stage most teams overweight in headcount and underweight in upstream specificity. With a tight brief, a 1,000-to-1,500-word short-form piece should clear first draft in one to two days.
- Review splits into two passes: an editorial pass for argument and clarity, and a subject-matter pass for technical accuracy by a product manager, solutions engineer, or domain lead. The second pass is where most cycles stall. Booking standing review windows, rather than ad-hoc requests, typically cuts review latency from a week to 48 hours.
- Publish handles CMS staging, metadata, internal linking, and distribution scheduling across owned channels. Target same-day once review closes.
- Measure closes the loop with attribution back to pipeline influence, not just sessions, and feeds the next research cycle.
CMI's annual B2B research flags attribution as the persistent weak point in B2B content operations 7, which is exactly why measurement belongs inside the production loop rather than in a separate quarterly report.
Where AI assistance fits as a workflow layer
The useful question is not whether to use AI in content production. Eighty-one percent of B2B marketers already report using generative AI tools in their workflows 9, which puts adoption past the novelty stage and into the baseline. The useful question is where AI compresses the specific stages above without degrading the output buyers will actually read.
AI assistance lands cleanly in research and draft scaffolding. Synthesizing 40 sales-call transcripts into recurring committee questions, clustering search queries into argument families, and pulling competitor positioning language across a category are tasks where speed gains compound. Harvard's review of AI in marketing notes that routine tasks once measured in hours now run in minutes, freeing time for strategy work 8. That time is best spent on briefs and review, the two stages where human judgment changes the asset.
The pattern that works treats AI as a layer underneath each stage rather than a replacement for any stage. Research uses AI to widen the input net and tighten the synthesis. Brief writing uses AI to draft a first cut that a content lead edits against the committee-gap framework. Drafting uses AI to produce structural scaffolds and first-pass prose that a writer rewrites for argument and voice. Review and measurement stay human-led, because subject-matter accuracy and pipeline attribution are where errors are most expensive.
Run that way, the same team can move from publishing six to eight assets per month to publishing twenty to thirty without adding writers, because the bottleneck shifts from drafting hours to brief quality and review throughput.
Production economics: agency-led vs. AI-assisted in-house
The committee math from earlier in this article sets a floor on output: a team serving deals that need 20-plus role-specific assets cannot survive long on a per-asset cost structure built for occasional thought-leadership pieces. The economics of how that output gets produced is where most content budgets either compound or quietly bleed.
Content marketing as a channel already carries a favorable return profile against paid alternatives. Synthesized SaaS benchmark data puts content marketing at roughly $3 returned per $1 invested, against approximately $1.80 per $1 for paid ads 9. Those figures aggregate self-reported marketer data across multiple SaaS cohorts rather than a controlled study of a single program, so the ratio describes a directional advantage, not a guaranteed multiple. The directional advantage is consistent enough across the cited benchmarks to support a budget conversation with a CFO: shifting incremental dollars from paid placement into a content engine that produces role-specific assets tends to compound, where the same dollar in paid plateaus at the auction price.
The harder economic question sits inside the production model itself. Two cost structures dominate in-house SaaS teams today.
The agency-led or freelancer-led model carries a per-asset cost that scales linearly with output. A 1,200-word short-form piece commissioned externally typically runs through a brief, a draft, one or two revision rounds, and an internal review, with cycle times of two to four weeks and a fixed cost per unit. Shipping 25 role-specific assets a month under that structure means 25 unit costs plus the in-house hours to manage briefs and reviews.
The AI-assisted in-house model inverts the cost curve. Fixed platform and tooling costs replace most of the per-asset variable cost, while internal hours concentrate on the two stages where judgment changes the asset: brief specificity and subject-matter review. Output scales without a proportional increase in writer headcount, because draft production is no longer the binding constraint. The team plugs its own variables into the model — average cost per asset, target assets per month, review hours per asset — and the breakeven against the agency line tends to arrive between 12 and 20 assets per month for most SaaS programs.
The point is not that one model is universally cheaper. It is that the unit economics of committee-led buying make linear per-asset cost structures harder to defend each quarter the asset target rises.
See How Top SaaS Teams Automate Content Writing at Scale
Request a walkthrough of AI-driven content workflows proven to reduce production timelines by 60% and deliver publish-ready articles from your keyword research, without bottlenecks or added headcount.
Customer evidence as a first-class asset class
Most SaaS content plans still treat case studies as a separate program run by product marketing, published quarterly, and linked from a footer page. The buying data argues for promoting them to a primary asset class managed inside the same production loop as everything else. Corporate Visions' aggregation of recent B2B buying research reports that 56% of buyers consult existing product users before purchasing, and that figure climbs to 71% on enterprise deals 10. The sample mixes self-reported survey data across categories rather than isolating SaaS, but the directional weight is hard to ignore: a majority of committees are routing around vendor narratives to find someone running the product.
That changes what a customer story has to do. A two-page logo-and-quote PDF written for the website does not answer the questions a Director of Engineering asks a peer on a call. The asset that gets forwarded inside a buying committee names the stack the customer replaced, the migration timeline, the integration headaches, the metric that moved, and the metric that did not. It reads like a postmortem, not a press release.
Operationally, this means customer evidence belongs in the same six-stage pipeline as every other asset, with one addition: a standing interview cadence with recent customers, scoped to specific committee roles. One quarter's research target might be three RevOps leaders, two security reviewers, and a CFO who signed the deal. Each conversation feeds multiple assets, short-form teardowns, webinar segments, and quoted evidence dropped into role-specific briefs across the library.
Measurement: mapping assets to committee stages
Most content dashboards in SaaS still report sessions, scroll depth, and form fills, then attempt to bolt pipeline influence onto that picture at the end of the quarter. The order is backwards. Measurement that actually informs production starts with the committee map and works back to the asset, not the other way around.
A workable framework assigns every published asset two attributes at publication: the committee role it was written for and the buying stage it serves. Three stages cover most SaaS cycles cleanly:
- frame (the role is defining the problem and the category)
- shortlist (the role is comparing two to four vendors against named criteria)
- defend (the role is building the internal case to advance the deal)
An asset tagged "Director of Security, shortlist" gets measured against a different bar than one tagged "VP Engineering, frame."
That tagging lets the team report three numbers that matter:
- Coverage: which role-stage cells in the matrix have at least one performing asset, and which are empty.
- Influence: which assets appear in the content path of opportunities that progressed to the next stage, weighted by role match.
- Decay: which assets stopped influencing pipeline after a product release, a competitor launch, or a category shift, and need refresh rather than retirement.
CMI's annual research flags attribution as the persistent weak spot in B2B content operations 7, and the gap is usually not tooling. It is that traffic-first dashboards cannot answer the question a CFO asks next quarter, which is whether the library is getting more efficient at moving committees forward. A role-stage matrix produces that answer in a format the rest of the revenue org can read.
The business case to take upstream
The argument that travels well to a CFO is not about content quality. It is about revenue capture. McKinsey's tracking of hybrid B2B sales models, which depend on a working content engine to support self-directed buying, attributes up to 50% more revenue against traditional field-only approaches 1. That uplift assumes the digital evidence is there when the committee reaches for it. A content function that cannot keep pace with committee asset demand is the constraint on that revenue, not a marketing line item.
Framed that way, the upstream conversation has three numbers in it:
- Coverage of role-stage cells in the buyer matrix.
- Cycle time from research to publish.
- Cost per asset at the target output rate.
A team reporting against those three, rather than against sessions and rankings, gives finance and revenue leadership a model they can actually fund. Vectoron is built for content teams running that model at scale.
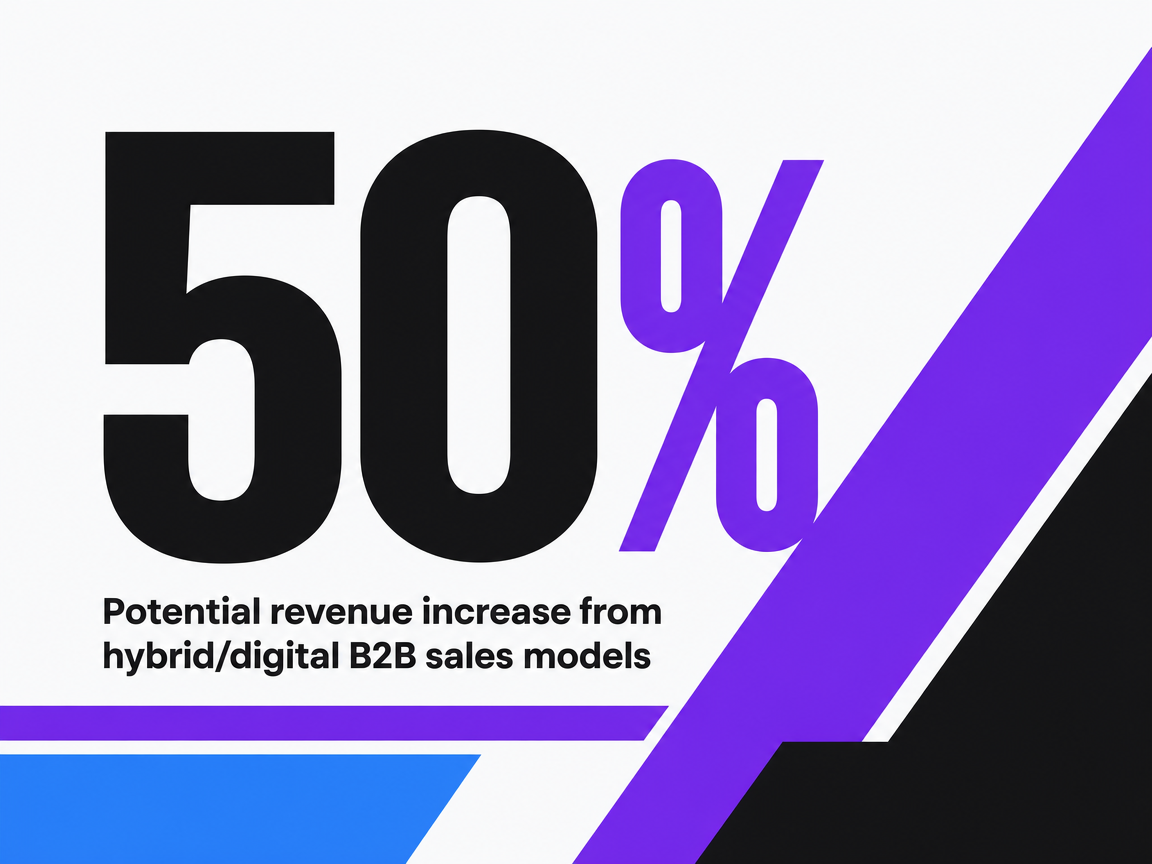 Potential revenue increase from hybrid/digital B2B sales models
Potential revenue increase from hybrid/digital B2B sales models
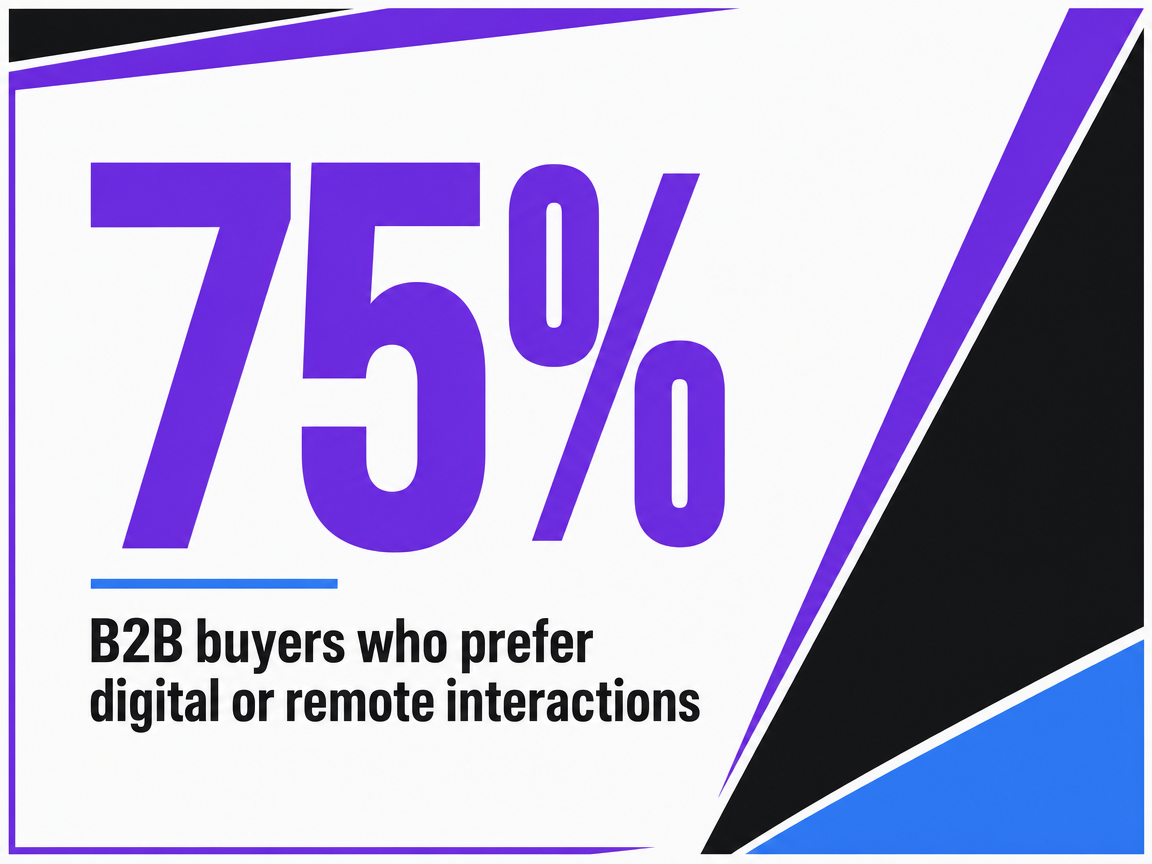 B2B buyers who prefer digital or remote interactions
B2B buyers who prefer digital or remote interactions
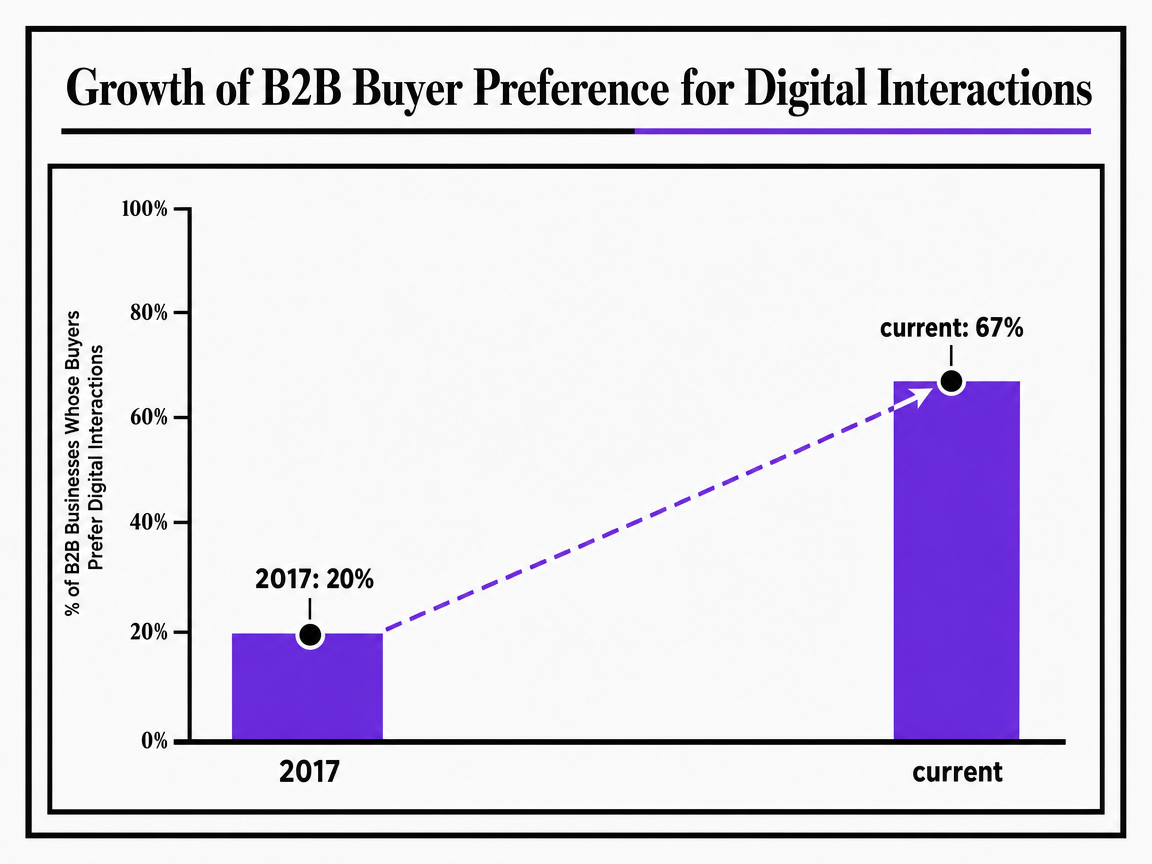 Growth of B2B Buyer Preference for Digital Interactions
The percentage of B2B businesses whose buyers prefer digital interactions has grown from approximately 20% in 2017 to 67% currently, showing a major shift in buyer behavior.
Frequently Asked Questions
References
- 1.The future of B2B sales is hybrid.
- 2.McKinsey: B2B buyers demand digitally enabled sales channels.
- 3.Future of B2B sales: The big reframe.
- 4.Modern Sales methodologies, and strategies for B2B organizations (Master’s thesis).
- 5.2024 State of B2B Content Consumption & Demand Report.
- 6.2024 Content Preferences Benchmark Survey.
- 7.B2B Content and Marketing Trends: Insights for 2026.
- 8.AI Will Shape the Future of Marketing.
- 9.39 B2B SaaS Marketing Statistics Every Founder Needs.
- 10.B2B Buying Behavior in 2026: 57 Stats and Five Hard Truths.