
Key Takeaways
- Revenue-connected content depends on three linked systems: signal-driven topic selection, measurement tied to conversion and retention, and a production loop that runs under editorial approval 2.
- Topic selection should follow observable behaviors like sales-call transcripts, chat logs, and returning-visitor paths rather than keyword volume, since conversation surfaces buyer questions before search does 1.
- Every recurring report should pair one activity metric with one revenue-connected metric, and each page should be engineered as a conversion instrument with a single primary action tied to decision stage 15.
- Portfolio operators gain more from consolidating into one governed content operation with location-level personalization than from per-market agencies, because consistency drives retention and share of wallet 6.
Why Most Content Programs Miss Revenue by Design
Content programs rarely miss pipeline targets because the writing is weak. They miss because the operating design never connected content decisions to revenue in the first place. Topic selection is delegated to a keyword tool, measurement is delegated to a traffic dashboard, and production is delegated to a rotating cast of freelancers or an agency queue. Each function optimizes its own metric, and none of them share a customer decision journey.
That fragmentation is the actual failure mode. A peer-reviewed analysis of digital marketing analytics warns that
"metrics and data are empty shells without proper theories and interpretations behind them,"
and argues that KPI fixation on a single platform metric can produce strategic failure even when the numbers look healthy 2. A content calendar full of high-volume keywords can generate sessions for a year without moving a single qualified opportunity, and the team will not know why until a CFO asks.
Revenue-connected content strategy treats the program as one designed system with three linked functions: topic selection driven by decision-stage signals 1, measurement tied to conversion and retention rather than reach 15, and a production loop that can execute at cadence under editorial control 3. When any one of those functions is owned by a different vendor or tool, the reconciliation cost eats the return.
The Three Systems That Determine Whether Content Produces Pipeline
Three systems decide whether a content program produces pipeline:
- Signal-driven topic selection
- A measurement layer tied to conversion and retention
- A production loop that runs at cadence under editorial approval
Each one is a well-understood discipline on its own. The revenue problem shows up when they are owned by different people, tools, or vendors and never reconcile against a shared decision journey 2.
Signal-driven selection means treating observable behaviors across touchpoints as the input to what gets written, not keyword volume in isolation 1. The measurement layer means selecting KPIs that reflect movement through the journey and into pipeline, then optimizing pages as conversion instruments rather than reach vehicles 15. The production loop means executing at cadence with human approval at every consequential decision, so quality and compliance do not degrade as volume climbs 3.
The sections that follow examine each system in operating detail, then consolidate governance, multi-location economics, and business-model fit.
Selecting Topics from Decision-Stage Signals, Not Keyword Volume
What Digital Signals Reveal That Search Volume Hides
Keyword volume answers a narrow question: how many people typed a string into a search box last month. It does not describe intent, urgency, or where the reader sits in a decision. A page ranked for a high-volume term can pull steady traffic while producing nothing that a sales team recognizes as a qualified conversation.
Digital signals are the corrective. A peer-reviewed analysis frames these signals as observable interactions across touchpoints that firms can use to understand and influence the journey, not isolated clicks to be optimized in a silo 1. The operative shift is from counting queries to reading behavior:
- which pages a returning visitor revisits before booking a call
- which comparison questions get asked in chat
- which sales objections repeat in recorded calls
- which competitor names appear in branded search after an initial visit
Those signals point to topics that keyword tools cannot surface, because the questions are asked in conversation before they are ever typed into Google. A VP running a lean team gets more pipeline from ten assets built against observed friction than from fifty ranked against volume. The topic list stops being an SEO artifact and starts functioning as a queue of documented buyer questions.
Mapping Assets to Problem-Aware, Solution-Aware, and Vendor-Aware Stages
Three stages capture how most buyers move toward a purchase decision in high-consideration service categories.
- Problem-aware readers know something is wrong but have not named the category of solution.
- Solution-aware readers have named the category and are comparing approaches.
- Vendor-aware readers have shortlisted providers and are validating a specific choice.
Journey mapping literature describes these stages as a visual representation of the customer's end-to-end experience, capturing attitudes and needs even before direct contact with the organization 7.
Each stage has an asset format that fits its cognitive load, and each format has a KPI that connects it to revenue. Problem-aware content works as diagnostic articles, symptom checklists, and explainers that name the problem in the reader's own language. The KPI is assisted conversions and returning-visitor rate, because these pages rarely convert on first touch. Solution-aware content works as comparison guides, methodology explainers, and framework pieces that show how categories of solutions differ. The KPI is scroll-depth-weighted email captures and demo requests from repeat visitors. Vendor-aware content works as case studies, pricing pages, credential pages, and proof assets. The KPI is booked meetings, qualified pipeline, and win rate on sourced deals.
Content marketing effectiveness research reinforces this logic: perceived usefulness, credibility, and enjoyment mediate downstream outcomes like purchase intention, so a mismatch between stage and format erodes conversion even when reach looks strong 3. Wharton's journey-mapping analysis makes the same operational point, describing the map as a way to benchmark expectations against actual experience and identify pain points where content can intervene 8. A matrix that pairs the three stages with format and KPI turns those principles into an assignment sheet a small team can execute against.
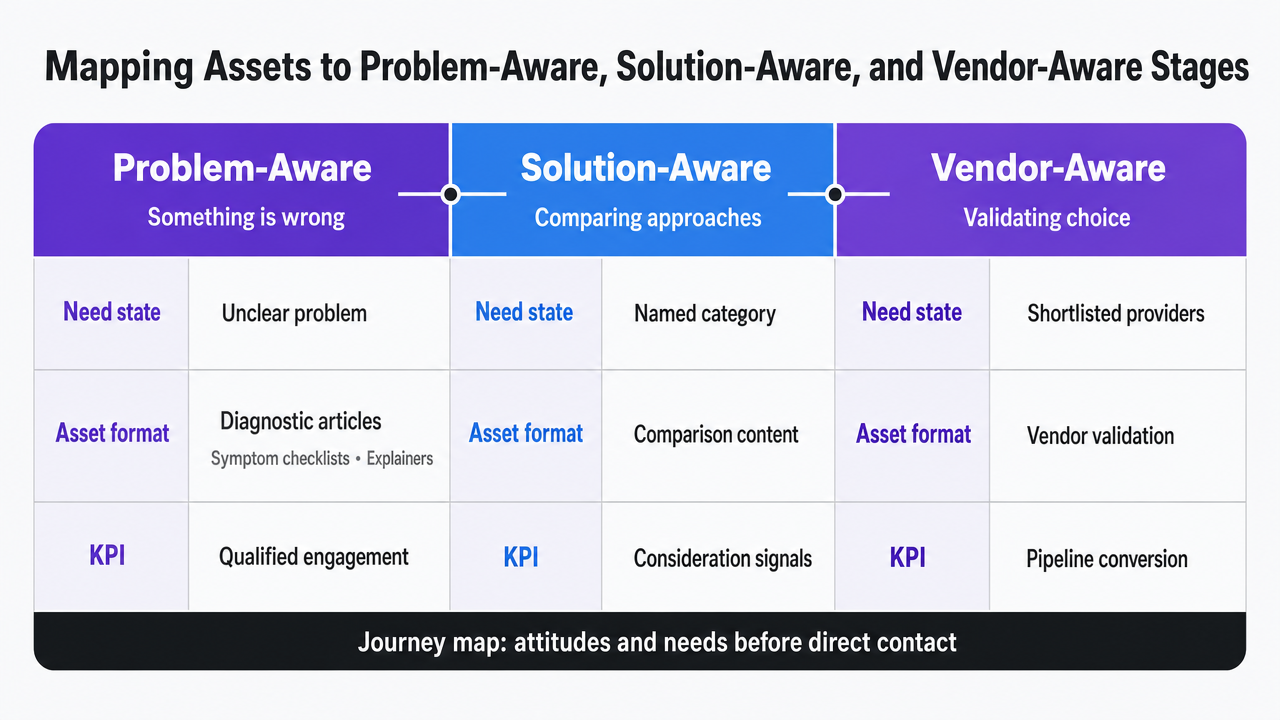 Visualize the three-stage content matrix pairing decision stage with asset format and revenue-connected KPI, directly supporting the section's cited framework
Why Journey-Aligned Content Compounds Revenue
Stage-aligned content compounds because it does two things a keyword-first library does not. It shortens the distance between a reader's question and the answer that moves them one stage forward. And it accumulates into a library of assets that support personalization at each stage rather than a pile of top-of-funnel pages that all address the same audience.
That second effect is where the revenue math becomes visible. McKinsey's cross-sector research, drawn from company-reported outcomes, finds that personalization most often drives a 10 to 15 percent revenue lift, with company-specific results spanning a 5 to 25 percent range depending on sector and ability to execute 5. The scope matters: the number reflects self-reported lift across a mix of industries and initiatives, and the execution capabilities required to reach the higher end of that range are material. A firm without stage-aligned assets cannot personalize meaningfully, because there is nothing differentiated to serve.
The compounding effect shows up in a second place: buyer psychology. Consumer behavior research links stage-appropriate messaging to brand memory, emotional response, and loyalty, which are the drivers of repeat revenue rather than one-time acquisition 17. Content that meets a problem-aware reader with a diagnostic and later meets the same reader with a vendor-aware proof asset builds recall across the decision window.
A library organized this way makes each new asset more valuable than the last, because it fits into a system that already moves readers forward. A library organized by keyword volume tends to plateau, because every new page competes with the old ones for the same shallow attention.
Test a Data-Driven Content Strategy in Days
Validate your content’s direct impact on pipeline and see measurable outcomes before committing.
Building a Measurement Layer That Treats Content as a Conversion Instrument
Vanity Metrics vs. Revenue-Connected Metrics
Sessions, impressions, and time-on-page describe activity. They do not describe whether that activity moved a reader closer to a purchase decision. A dashboard that reports only those numbers can trend up for four quarters while sourced pipeline stays flat, and no one on the team will be able to explain the gap to a finance partner.
The analytics-myopia critique lands directly on this failure mode. The peer-reviewed argument is that
"metrics and data are empty shells without proper theories and interpretations behind them,"
and that optimizing a single platform metric in isolation can produce strategic failure even when reporting looks healthy 2. The theory that gives KPIs meaning is the customer decision journey. Once that framework is in place, KPI selection follows from it rather than the reverse.
Revenue-connected metrics measure movement, not motion.
- Assisted conversions credit the pages that touched a converting visitor before the final action.
- Pipeline sourced attributes qualified opportunities back to the content asset that opened the account.
- CAC payback measures how long revenue takes to recover acquisition spend, including the content investment.
- Retention and repeat-purchase rate close the loop by showing whether content-acquired customers stay.
The practical rule for a lean team: every recurring report should pair one activity metric with one revenue-connected metric on the same row. Sessions next to assisted conversions. Rankings next to sourced pipeline. Time-on-page next to demo-request rate. The pairing forces interpretation. It also exposes the pages that generate reach without producing anything a sales leader would recognize as progress.
Turning Content Pages into Conversion Instruments
A content page becomes a conversion instrument when it is engineered to move a specific reader to a specific next action, and when that action is measured against the page rather than the site. The conversion rate optimization literature frames this as a discipline that links optimization frameworks to a more effective and consistent customer journey management strategy, rather than a bag of A/B testing tricks applied at random 15.
Three design decisions carry most of the weight:
- A single primary action per page, chosen for the reader's decision stage. A problem-aware article does not need a demo button; it needs a related diagnostic or an email capture that keeps the reader in the library. A vendor-aware page does need the demo button, placed above the fold and repeated after the proof section.
- Instrumentation at the page level: form-fill rate, scroll-to-CTA rate, and returning-visitor conversion, tracked as page attributes rather than site averages.
- A rewrite trigger. Any page that reaches statistical volume without hitting its conversion target gets rebuilt against the observed friction, not archived.
Content effectiveness research supports the underlying claim that perceived usefulness, credibility, and enjoyment mediate the path from reading to buying, which is why page-level design decisions show up in conversion data rather than staying invisible 3. The library becomes a set of instruments, each one tuned to a specific reading and buying moment.
Consistency as a Retention and Share-of-Wallet Lever
Measurement gets harder past the first conversion, and that is precisely where a large share of content-driven revenue actually lives. Repeat purchase, expansion, and referral all depend on whether the experience after signup matches the one before it. McKinsey's analysis of consistency across customer journeys links consistent experiences to higher customer satisfaction and better financial performance, driven by retention and share of wallet rather than by first-touch acquisition 6.
For content, consistency is a measurable variable, not a slogan. Voice, claim structure, and proof standards should be the same on a top-of-funnel article and on a post-sale onboarding email. When a prospect reads a diagnostic article that describes a category in one vocabulary and then encounters a product experience that uses a different vocabulary, the mismatch shows up in expansion metrics and churn timing.
The operational takeaway is to add two retention-adjacent measures to the content report: content-touched retention rate and content-touched expansion rate, segmented by which pre-sale assets the customer consumed. Content that produces high acquisition but low retention is a warning, not a win. It usually points to a message set that oversold the category or undersold the work required.
An Approval-Governed Production Loop That Runs Without New Headcount
The Capacity-Versus-Oversight Tradeoff That Breaks Small Teams
A lean marketing team hits the same wall on the way to a revenue-connected content program. Publishing at the cadence required to cover three decision stages, several service lines, and a personalization layer means producing more assets than two or three people can research, draft, and quality-check on their own. The usual response is to add freelancers, retain an agency, or both. Both moves import a coordination tax that shows up as briefing cycles, revision loops, status meetings, and version drift across channels.
Cutting oversight to buy capacity is the failure mode on the other side. When a VP hands off approval to keep volume moving, message consistency degrades, claims start to wander, and the retention signal weakens. McKinsey's analysis of consistency across customer journeys ties consistent experiences to better financial performance through retention and share of wallet, which means every uninspected asset carries a small but real revenue cost 6.
The practical constraint is not idea supply. It is throughput under editorial control. A revenue-connected program needs a production loop that raises volume without moving approval authority away from the people accountable for the pipeline number.
Signal, Recommendation, Approval, Execution, Feedback
Five stages describe a production loop that scales without diluting oversight:
- Signal capture pulls from the same sources that already sit in a modern marketing stack: search behavior on owned pages, sales-call transcripts, chat logs, form-abandon patterns, and returning-visitor paths. The digital-signals literature frames these as observable interactions across touchpoints that firms can use to influence the journey, not raw data to be admired in a dashboard 1.
- Recommendation converts those signals into a ranked list of specific assets, each tagged with the decision stage it serves and the KPI it targets.
- Approval is where a human editor accepts, rejects, or reshapes the recommendation before any writing begins.
- Execution produces the asset against the approved brief.
- Feedback closes the loop by attaching page-level conversion data back to the originating signal, so the next recommendation set is sharper than the last 15.
Each stage has a clear owner and a clear artifact, which is what keeps the loop from collapsing back into a briefing queue.
The design point is that approval sits at the top of the loop, not at the end. Editorial judgment shapes what gets built, rather than reviewing what has already been drafted at cost. Content marketing effectiveness research supports the underlying logic: perceived usefulness and credibility are the mediators between reading and buying, and both degrade when unreviewed volume ships into the library 3. A loop with approval at the front produces more assets per editor hour and fewer assets that need to be quietly retired six months later.
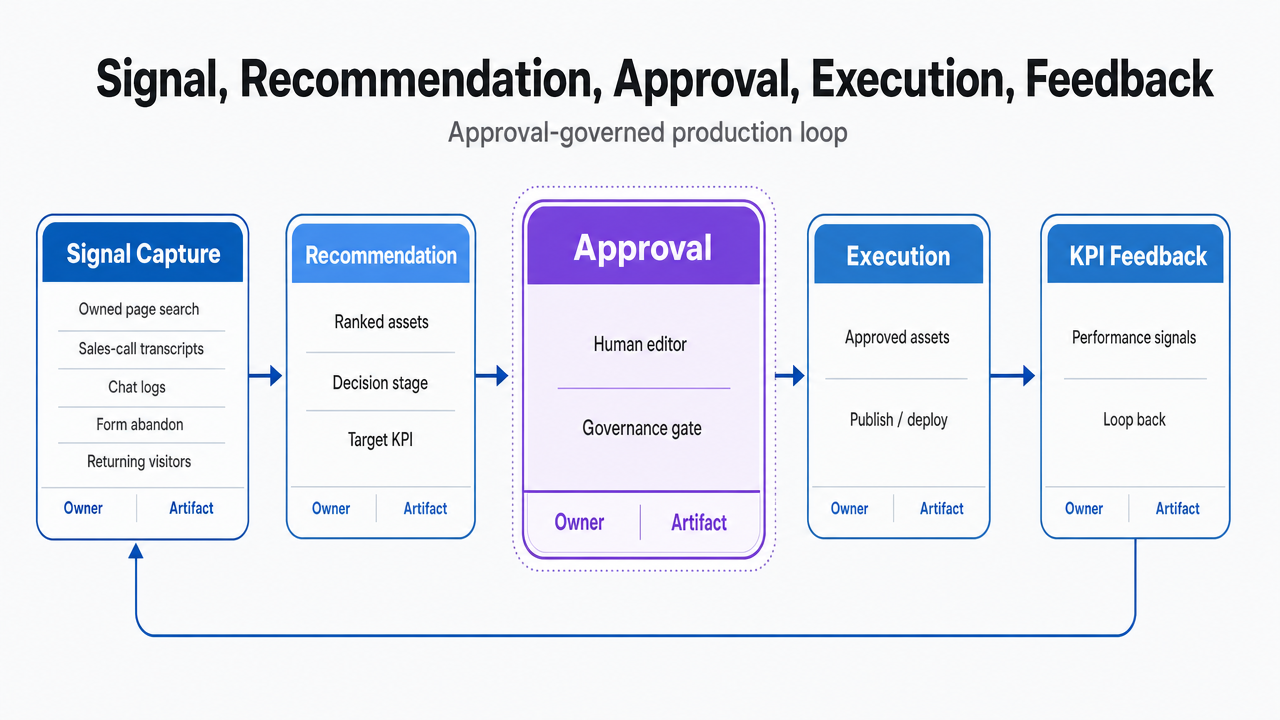 Visualize the five-stage approval-governed production loop described in the section, showing where editorial approval sits in the cycle
Governance: FTC Disclosure, Endorsements, and Privacy in One Block
Content programs that connect to revenue collect data, publish promotional material, and often use third-party voices. Three governance rules cover most of the exposure, and consolidating them into one operating standard keeps the review load small.
Disclosure comes first. The FTC's guidance on native advertising states that any indication that content is commercial should sit near the ad's focal point, where a reader will see it before engaging with the message 9. The broader online advertising guidance reinforces the same principle: ads should be identifiable as ads from the consumer's perspective, not buried in fine print 11. Endorsements carry a parallel rule. When a reviewer, influencer, or customer has a material connection to the brand, that relationship must be made clear to the audience 10. A single disclosure checklist attached to the production loop handles all three cases: paid placement, incentivized endorsement, and branded editorial.
Privacy is the second track. Personalization and attribution both depend on user data, and NIST's identity guidance recommends managing digital identity risk with privacy considered at the design stage rather than bolted on afterward 13. Where analytics or segmentation use behavioral data, NIST's de-identification report describes methods for reducing identifiability while preserving analytic utility, along with the limits of those methods 12. The operational rule is to document which fields are collected, which are de-identified, and which trigger a consent surface before the content is built, not after publication.
See How Leading Teams Tie Content Strategy Directly to Revenue Impact
Request a walkthrough of AI-driven workflows that connect content production to pipeline metrics—no added headcount, no agency overhead. Learn how enterprise brands and agencies align execution with measurable revenue outcomes.
If You Manage Multiple Locations: Consolidation Economics
This section speaks to operators running content across a portfolio: dental groups, MSOs, franchise home services, senior living groups, and multi-market law or behavioral health practices. The economics of a content program change materially once the number of locations climbs past a handful, and the standard playbook of hiring a local agency per market breaks in two places.
The first break is cost. The recurring math looks like N locations × per-location retainer + coordination overhead, where coordination overhead includes briefing time, review cycles, and reconciliation of conflicting recommendations across markets. A twenty-location operator running ten thousand dollars a month per agency is not spending two hundred thousand; the true figure adds the internal hours consumed by managing the vendors, and those hours scale linearly with locations.
The second break is revenue. Consistency across touchpoints is a measurable driver of financial performance through retention and share of wallet, not a soft brand concern 6. When each market runs its own agency, voice drifts, claims wander, and proof standards fragment. A prospect who compares two locations of the same brand and finds two different vocabularies loses confidence in both.
The consolidation alternative is a single governed content operation with location-level personalization layered on top. Central editorial owns voice, claims, and proof standards. Location-specific content, such as market pages, provider bios, and service-line variants, plugs into that standard rather than replacing it. The operator pays for one production loop and one approval workflow, then applies personalization variables (market, service line, provider, insurance mix) against a shared asset library. That structure treats consistency as a revenue lever, not just a cost lever, and it removes the coordination tax that scales with location count.
How Business Model Shapes Content Posture
Revenue model dictates what content is supposed to do. A working paper on platform revenue models shows that ad-supported businesses have stronger incentives to promote engagement-driving content, while subscription businesses tend to prioritize quality and satisfaction because churn is the tax on weak content 16. The same logic applies outside platforms. A high-ticket service firm billing recurring retainers cannot fund itself on top-of-funnel reach; its content has to earn trust deep in the vendor-aware stage and hold up after signup. A transactional service with a short buying window can absorb lighter mid-funnel coverage and lean on decisive vendor-aware assets.
The posture question resolves into three variables:
- Deal size
- Sales cycle length
- Revenue recurrence
Larger deals and longer cycles pull investment toward solution-aware and vendor-aware assets. Shorter cycles pull toward diagnostic pages that convert on first or second touch. Recurring revenue pulls toward post-sale content that protects retention. A content plan built without answering those three questions first will optimize for whichever metric its dashboard reports loudest, which is rarely the one on the CFO's scorecard.
Frequently Asked Questions
References
- 1.How consumer digital signals are reshaping the customer journey.
- 2.Avoiding digital marketing analytics myopia: revisiting the customer decision journey as a strategic marketing framework.
- 3.Determinants of content marketing effectiveness: Conceptual framework and empirical validation.
- 4.How to Create a Content Strategy That Drives Results.
- 5.The value of getting personalization right—or wrong—is multiplying.
- 6.The three Cs of customer satisfaction: Consistency, consistency, consistency.
- 7.Journey mapping the customer experience: A USA.gov case study.
- 8.Customer Journey Mapping Is at the Heart of Digital Transformation.
- 9.Native Advertising: A Guide for Businesses.
- 10.Endorsements, Influencers, and Reviews - Federal Trade Commission.
- 11.Online Advertising and Marketing | Federal Trade Commission.
- 12.De-Identification of Personal Information.
- 13.NIST Special Publication 800-63-4.
- 14.Marketing and sales | U.S. Small Business Administration.
- 15.Developing a conversion rate optimization framework for digital retailers.
- 16.Implications of Revenue Models and Technology for Content Moderation on Social Media Platforms.
- 17.Understanding Consumer Behavior as a Marketing Professional.