
Key Takeaways
- Keyword maps sorted by search volume push writers toward awareness queries and bury decision-stage terms; tagging each term by intent stage before production shifts the content library toward conversion 1.
- Blog posts built only to be read capture none of the buying-committee research happening on them; briefs should specify a topic-matched conversion asset before drafting begins 7.
- Technical audits that catalog sitewide errors waste effort on pages that should not exist; lead with revenue concentration against the 60% top-pages benchmark and retire or consolidate before optimizing 3.
- Monthly reports opening with sessions and rankings give sales leaders nothing to act on; lead with organic-sourced opportunities, top pages by pipeline touched, and assets retired against defined kill criteria 4.
The Deliverable Is the Diagnosis
Marketing leaders running mature SEO programs share a common complaint: the agency deck shows rankings climbing, the GA4 chart bends up and to the right, and the CRM still reports flat sourced pipeline. The instinct is to blame the channel, the algorithm, or the latest AI Overview rollout. The evidence points somewhere less comfortable.
Organic search still generates a 53% share of inbound leads for B2B marketers and remains one of the highest-ROI acquisition channels in published benchmarks 6, 10. Programs that fail to convert that potential into pipeline are not running into a channel ceiling. They are shipping the wrong artifacts.
The diagnosis lives at the deliverable level. The keyword map, the blog post, the technical audit, the monthly report — each one is built to satisfy a production cadence rather than a revenue outcome. They are scored by publish date and ranking velocity. They are not scored by whether sales can use them, whether they map to a buying stage, whether a CRM tag fires when a prospect engages, or whether a kill criterion retires them when they underperform.
This article treats those deliverables as forensic evidence. Four common failures get dissected, a Monday-morning diagnostic gets defined, and the measurement layer gets rewired in terms a VP can implement without rebuilding the stack. The premise throughout: SEO is not the problem. The work product is.
The Channel Works. The Outputs Do Not.
The simplest test for whether SEO is broken at the channel level or at the deliverable level is to compare what the channel produces in aggregate against what individual programs report internally. The gap is the diagnosis.
At the category level, organic search drives 44.6% of all revenue for B2B companies, the largest single share among acquisition channels in recent aggregated analyses 14. Inbound lead share tells the same story: organic search generates 53% of inbound leads for B2B marketers 6. Two independent compilations, two different metrics, one consistent signal. Buyers continue to start with search, qualify through search, and convert through search.
That is not what most VPs see in their own CRM. The agency dashboard shows session growth and ranking gains. The sales operations export shows organic-sourced opportunities flat for three quarters. Both reports can be accurate at the same time, because they are measuring different things. The agency is measuring whether pages got found. The CRM is measuring whether the pages got used.
The deliverables sitting between those two reports are where the disconnect lives. A keyword map can rank well and route traffic to pages that contain no path into the pipeline. A blog post can earn a featured snippet and host no conversion mechanism beyond a sidebar newsletter form. A pillar page can pull 8,000 monthly sessions and never tag a lifecycle stage transition in the CRM. The work product is doing what it was scoped to do. It was scoped for visibility.
Treating the channel as the problem leads to budget cuts that compound the gap. Treating the deliverable as the problem leads to a fix that does not require rebuilding the stack. The next section names the four failures that show up most often inside the average SEO deliverable.
Four Failures Inside the Average SEO Deliverable
The Keyword Map Is Built Around Volume, Not Intent Stage
Most keyword maps presented to in-house teams are sorted by search volume, difficulty score, and ranking opportunity. They are not sorted by where the searcher sits in a buying process. That single omission predicts most of the pipeline gap that follows.
The keyword map is the source document for the entire content plan. When it lists 240 target terms ordered by monthly searches, the writers downstream produce assets in that same order. The result is a content library weighted toward awareness-stage queries, where intent is diffuse and the path to a qualified conversation is long. Solution-comparison terms, vendor-evaluation terms, and category-definition terms — the queries a buyer runs in the weeks before signing a contract — are buried in the back third of the list because their volume is smaller.
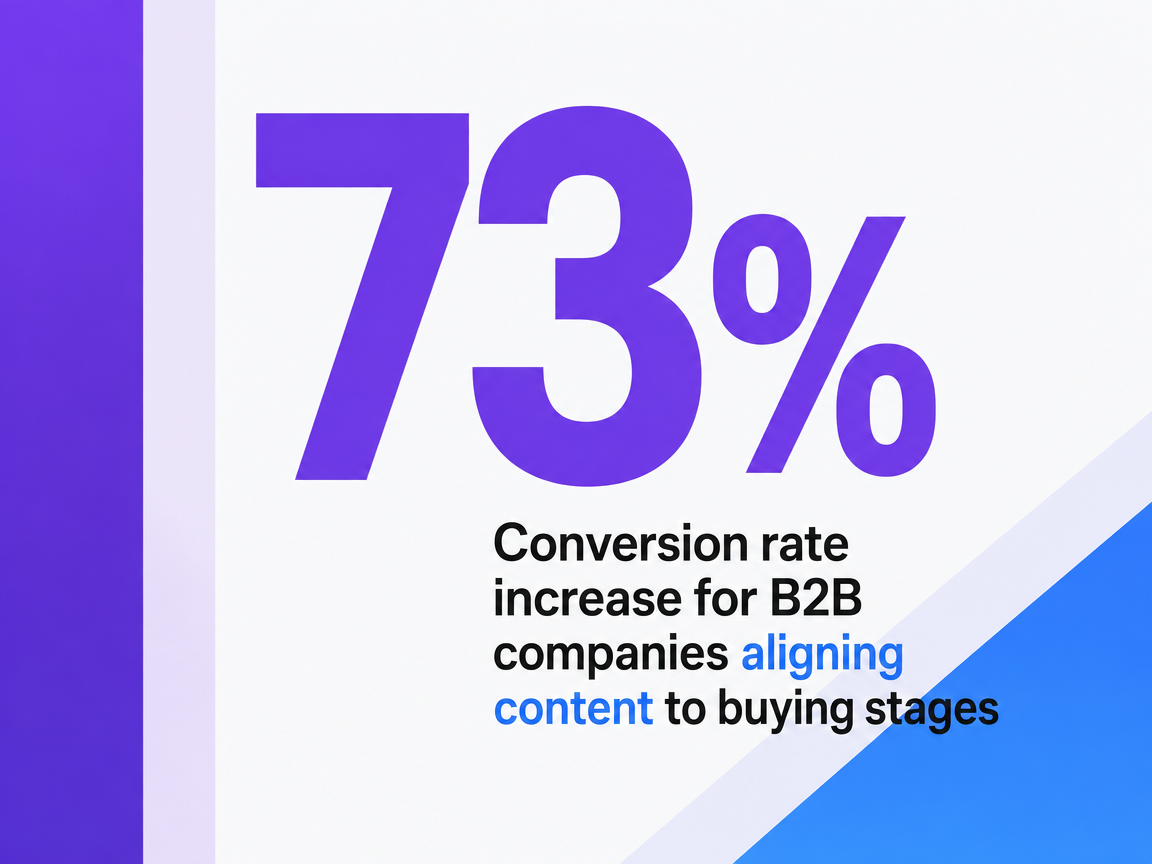
The conversion math does not reward that ordering. Aberdeen research cited in B2B content analysis found that companies aligning content to specific buying stages see 73% higher conversion rates than programs that do not 1. The scope matters: the study measured B2B firms across multiple verticals and tracked conversion rate on existing traffic, not new traffic acquired. The lift comes from the same visitors converting at a higher rate when the asset they land on matches the stage they are in.
A keyword map fixed for pipeline carries an intent-stage column on the first sheet: awareness, consideration, evaluation, decision. Each term is tagged before a writer touches it. Terms without a defensible stage are flagged for sales-input review rather than queued for production. The map then orders work by where the buyer is, not by how many people are searching.
 Likelihood of ROI improvement with multi-touch attribution
Likelihood of ROI improvement with multi-touch attribution
The Blog Post Has No Conversion Mechanism Wired Into It
Open any blog post in the average B2B content library and audit it as a sales artifact. Most fail the test in the first scroll. There is a header image, a subhead, eight or nine sections of expository copy, an author byline, and a sidebar form offering a newsletter subscription. The page is built to be read, not to be used.
Pipeline-focused practitioners argue the inverse. Each article needs built-in conversion components — embedded demo offers, contextual lead magnets tied to the article's topic, comparison tables that map to a sales call, and proof assets that a buyer can forward inside their organization 7. The conversion mechanism is not bolted on after publish. It is part of the brief.
The most consistent failure mode is the missing mid-scroll asset. A 2,400-word guide on selecting a vendor in a category will rank, draw traffic, and earn engaged time on page. If the only conversion path is a generic contact form at the footer, the page captures none of the buying-committee research happening on it. A topic-matched lead magnet — a vendor scorecard, a requirements template, an implementation checklist — positioned between the third and fourth section converts the same traffic at materially different rates because it gives a researching buyer something to bring back to a procurement conversation.
Two operational changes fix most of the deliverable: every brief specifies the conversion asset before the draft begins, and every published page logs which asset it carries and which CRM event fires when that asset is requested.
The Technical Audit Optimizes Pages That Should Not Exist
The standard technical audit deck arrives as a 60-page PDF cataloging crawl errors, schema gaps, Core Web Vitals scores, and internal-link recommendations applied across the entire site. The auditor's incentive is comprehensiveness. The site's incentive is revenue concentration. Those two incentives conflict, and the audit usually wins.
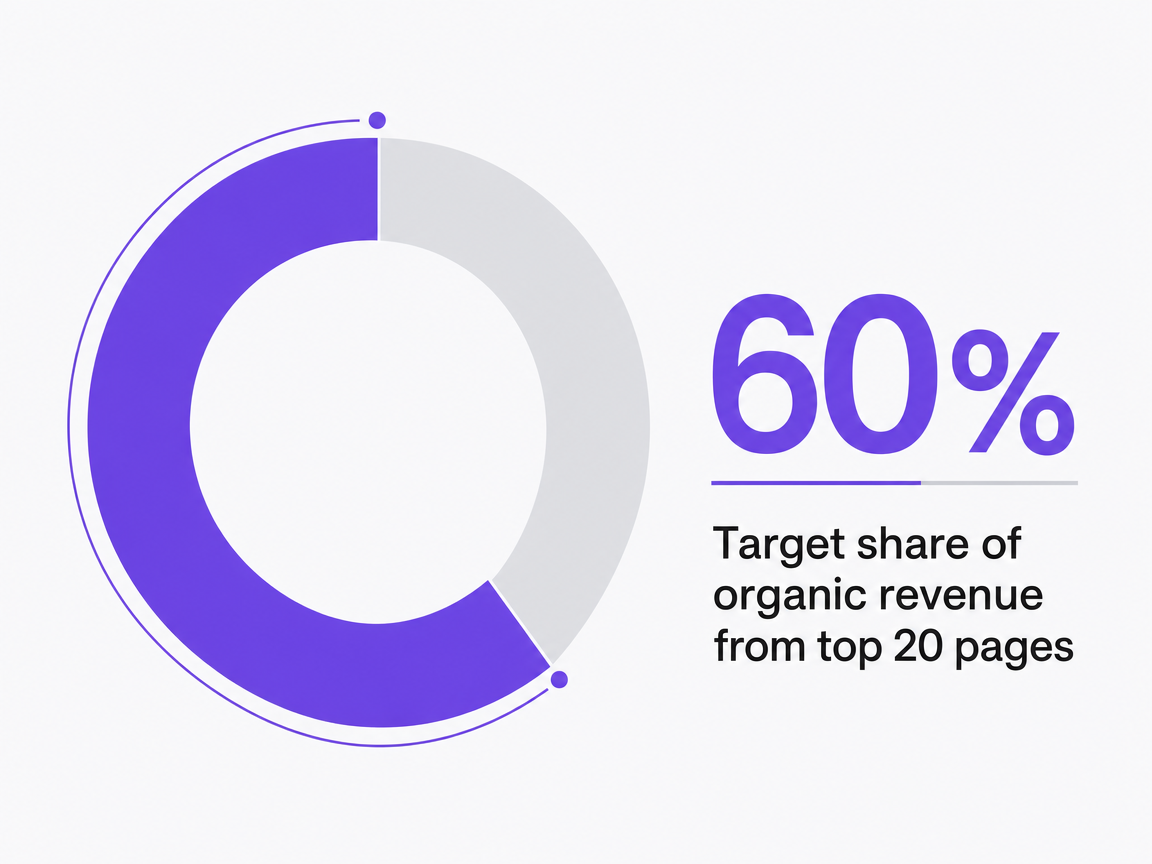
Operational benchmarks for revenue-focused B2B SEO point in a different direction. A site's top 20 pages should account for at least 60% of organic revenue; below that threshold, content dilution is likely competing with itself for the same queries 3. A related rule: 90% or more of the site's crawl budget should be concentrated on pages intended to rank, with the remaining 10% absorbing legacy URLs, utility pages, and unavoidable overhead 3. Both benchmarks reframe the audit from a hygiene exercise into a portfolio-management exercise.
When a technical audit is run against those targets, the recommendation list inverts. Pages get retired, redirected, or consolidated before any of them get optimized. Thin category posts that share a query cluster with a stronger pillar get merged. Old announcement posts that absorb crawl budget without producing sessions get noindexed or pruned. The schema and Core Web Vitals work concentrates on the 20 to 40 URLs that carry the revenue, not on the 800 URLs that carry the archive.
The audit deliverable also changes shape. Instead of a sitewide error list, it leads with a revenue-concentration chart showing what share of organic pipeline the top pages currently produce against the 60% benchmark. The gap between current and target is the project plan. Page-level fixes follow that prioritization, not the other way around.
The Monthly Report Cannot Be Read by Sales
The fourth failure shows up at the end of the production cycle, in the monthly report. The deck opens with sessions, ranks, impressions, and click-through rates. It closes with a list of articles published and a forecast of next month's keyword targets. A sales leader handed the same deck cannot extract a single fact that changes how their team works the following week.
That gap has a name in current B2B SEO commentary: traffic and rankings do not answer the question the business is asking 4. The business is asking which assets produced qualified conversations, which deals had an organic touch in their first 30 days, and what the trend in organic-sourced opportunity volume looks like against the prior quarter. None of those questions appear in the average report.
A report that sales will read changes the top three slides. Slide one shows organic-sourced and organic-influenced opportunities created in the period, with a stage-by-stage breakdown. Slide two shows the five pages that touched the most opportunities, with the dollar value of the pipeline they touched. Slide three shows the assets retired, consolidated, or flagged for rework based on the prior month's data, with the kill criteria that triggered each decision.
Rankings and sessions move to an appendix. They remain diagnostic inputs for the SEO team and operational evidence that the program is functioning. They stop being the headline. The report becomes a document the revenue side of the organization can act on, which is the only definition of a useful one.
 Conversion rate increase for B2B companies aligning content to buying stages
Conversion rate increase for B2B companies aligning content to buying stages
Test data-driven SEO execution in real time
Experience pipeline-focused SEO workflows and see measurable impact before you commit.
The Deliverable Autopsy: A Monday-Morning Diagnostic
The fastest way to confirm whether a program is shipping the wrong artifacts is to grade the artifacts. Pull the last 20 SEO deliverables out of the project management tool — blog posts, pillar pages, landing pages, technical audit recommendations, monthly reports — and score each one against four pass/fail criteria. The exercise takes a single working session and produces a defensible inventory of where the program leaks pipeline.
- Criterion one: intent stage documented. The deliverable carries a written label identifying which buying stage it serves — awareness, consideration, evaluation, or decision — and that label was set before production began. Assets with retroactive labels fail. Assets where the writer guessed the stage from the keyword fail. Programs aligning content to documented buying stages have been measured at 73% higher conversion rates than programs that do not 1, so an undocumented stage is a forecastable conversion loss.
- Criterion two: conversion mechanism present. The asset contains a specific, topic-matched conversion path beyond the global header CTA and footer form. A vendor scorecard, a requirements checklist, a calculator, an embedded demo offer, or a comparison table that maps to a sales conversation. A sidebar newsletter signup does not count. Neither does a contact link.
- Criterion three: CRM tag wired. When a visitor engages with the conversion mechanism, a specific event fires in the CRM or marketing automation platform that ties the lead, contact, or account back to the source asset. If marketing operations cannot name the field or property that captures the touch, the deliverable is invisible to the pipeline view.
- Criterion four: kill criterion defined. The brief or content calendar specifies the conditions under which the asset gets refreshed, consolidated, or retired — months without an organic-influenced opportunity, sessions below a threshold, or a ranking drop past a defined floor. Assets without a kill criterion accumulate as overhead and erode crawl budget on revenue pages 3.
Tally the score across the 20 deliverables. Programs running into the pipeline gap described in the prior sections typically pass on two of four or fewer. The number itself is the brief for the next quarter's operational work.
 Target share of organic revenue from top 20 pages
Target share of organic revenue from top 20 pages
Rewiring Measurement Without Overselling Attribution
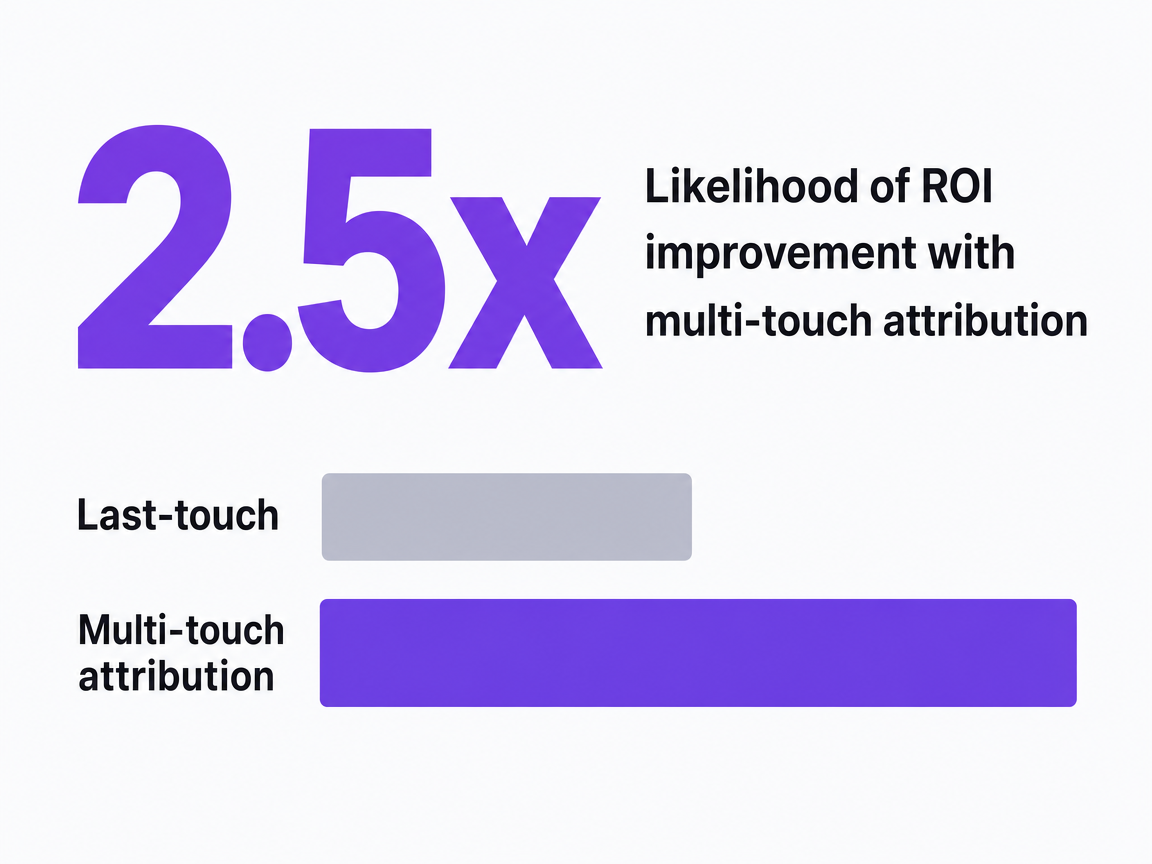
The measurement fix sits between two failure modes. On one side, programs cling to last-touch sourcing, which assigns credit to whichever form a contact happened to fill out and erases the research that preceded it. On the other side, programs over-invest in modeled attribution, treat the output as truth, and discover too late that fragmented journeys, privacy-driven signal loss, and identity breaks across devices have eroded the underlying inputs 5. Neither extreme produces a report a VP can defend to a CRO.
A working middle exists. Multi-touch attribution models, even imperfect ones, have been measured as 2.5 times more likely to improve marketing ROI than reliance on simple last-touch 1. That figure earns its place in the report when paired with the caveat: the lift comes from better decision-making on budget allocation, not from a more precise ledger of which page closed which deal. The model is a diagnostic, not a verdict.
The practical rewiring happens inside the CRM, not inside a new tool. Three fields carry most of the load.
- First, an original-source field captured at lead creation and never overwritten, so the entry point is preserved when later touches reassign source.
- Second, an opportunity-influence field flagged whenever an organic asset appears in the contact's session history within a defined window before opportunity creation.
- Third, a content-touched array on the opportunity record that lists the specific URLs engaged, so the top-five-pages slide in the monthly report writes itself.
Qualitative inputs round out the view. Asking sales each month which assets they sent into active deals, and asking prospects on discovery calls where they first encountered the company, surfaces signal that no model captures 8. That blended approach matches where revenue leadership is moving: shared accountability for pipeline rather than a search for an attribution model that finally settles the credit argument 12. The report stops claiming certainty it cannot deliver and starts producing decisions the organization can act on.
Stop Wasting Budget on SEO Deliverables That Don’t Move Pipeline
See how AI-powered, multi-channel execution links SEO work directly to qualified pipeline impact—without expanding your team or adding agency overhead. Get a demo tailored to enterprise and agency-scale needs.
If You Manage Multiple Locations or Practices
The diagnosis shifts when the program covers a portfolio of sites — a DSO with 40 practices, a law firm group with regional brands, a behavioral health network spanning state lines, a senior living operator with property-level domains. The deliverable failures from the prior sections compound at each location, and the coordination overhead between vendors masks where the leaks are.
The typical structure is fragmented. Each location runs a local SEO vendor, a content freelancer, or an inherited agency relationship. Reports arrive in different formats. Keyword maps overlap and cannibalize across sister sites. The corporate marketing team cannot tell which 20 pages across the portfolio actually drive opportunity volume, because no single view exists. The 60% revenue-concentration benchmark for top pages 3becomes unanswerable at the network level, not because the data is missing but because it is scattered.
Centralizing the deliverable standard — not the local execution — usually closes the gap faster than consolidating vendors. The variables that move are operational, not financial. The table below frames the comparison in inputs the operator supplies, anchored only on sourced benchmarks.
| Variable | Fragmented Per-Location Model | Centralized Coordinated Model |
|---|---|---|
| Per-location organic sessions | Variable; no shared baseline | Tracked against portfolio median |
| Qualified-lead conversion rate | Inconsistent; mechanism varies by site | Standardized conversion asset per intent stage 1 |
| Blended cost-per-organic-lead | Higher; duplicated vendor overhead | Lower; shared production, local routing |
| Sourced-pipeline contribution | Unaggregated; reported per site | Rolled up against 53% inbound-lead benchmark 6 |
Portfolio operators that treat each location as a content silo accumulate the same four deliverable failures forty times over. Operators that publish one keyword-map standard, one conversion-asset library, and one CRM tagging convention — then let each location apply them against local intent — get a network-level view of which pages and which markets are actually producing pipeline. The variables in the table are the inputs to that view, not estimates.
Coordinated Execution as the Capacity Answer
Most in-house teams know what a pipeline-instrumented deliverable looks like. They have read the playbooks 11. The gap between knowing and shipping is capacity. A four-person marketing team running paid, lifecycle, events, and brand cannot also rebuild the keyword map by intent stage, attach a conversion mechanism to every page, wire CRM tags across the content library, and grade every monthly report against pipeline questions instead of ranking ones.
The usual response is to add a vendor, then another, then a coordinator to manage them. The coordination tax eats the gain. What the deliverable autopsy actually demands is a single execution layer that reads pipeline signals, ranks which assets need intent tagging or conversion repair next, and ships the work against the same revenue criteria sales already uses for forecasting 12.
That is the category Vectoron sits in: AI specialist strategists for content, SEO, and call intelligence operating under an approval-first workflow, so the deliverable standard from the prior sections gets enforced on every asset without expanding headcount. The directive for marketing leaders is narrower than a vendor search. Define the four pass/fail criteria, then choose whichever execution model — internal, agency, or AI-coordinated — can apply them to twenty deliverables a quarter without losing the thread.
Frequently Asked Questions
References
- 1.B2B content marketing challenges hurting SEO and revenue ....
- 2.How to drive B2B/SaaS pipeline with SEO in 2023.
- 3.27 B2B SEO Rules to Drive Revenue in 2026.
- 4.B2B SEO Reporting Is Broken. Here's What to Measure Instead..
- 5.Challenges of Marketing Attribution in 2026.
- 6.60 B2B SEO Statistics to Shape Your Strategy.
- 7.B2B SEO Strategy: How 100+ Clients Drive Pipeline.
- 8.A podcast convo with Amanda Natividad | Peter Caputa.
- 9.The Essential Guide to Multi-Touch Attribution in B2B.
- 10.65+ B2B SEO Statistics & Benchmarks for 2026.
- 11.SEO That Builds Pipeline, Not Pageviews: A Strategic Playbook for ....
- 12.CMOs Shift Focus from Attribution to Pipeline.
- 13.B2B SaaS Benchmarks: Optimise Your Organic Search Strategy ....
- 14.7 Organic Traffic Share Statistics For eCommerce Stores.