
Key Takeaways
- Scottsdale's 2022 tourism campaign generated $116 in visitor spending per $1 invested by defining the outcome variable, counterfactual, and dollar conversion rule before media ran 7.
- A regional health system's regression-based campaign isolates each channel's effect on appointment volume, turning radio and email spend into defensible unit-economics inputs rather than untraceable media buys 10.
- Performance branding merges brand and direct-response into one P&L with documented attribution rules, preventing arbitrage and double-counting when finance questions shifts between brand and conversion budgets 3.
- AI-optimized programmatic campaigns lift CTR, conversion, and economic return when the bidding model is fed a contribution-margin target rather than a CPA proxy 2.
- Generative AI makes microcommunity personalization viable across dozens of creative variants, but campaigns must measure margin contribution alongside conversion to avoid discount creep and backlash 4.
- Behavioral health awareness campaigns measure lift against call-tracked intake volume with seasonality adjustments, while ethical guardrails on persuasion and autonomy remain non-negotiable in compliance review 8.
- Multi-location dental groups gain ROI clarity by running one model with location-level fixed effects and tier-specific objectives, replacing thirty independent dashboards built on last-click attribution 5.
- Legal practices defend campaign budgets by attributing signed matters, not leads, with first-touch, last-touch, and content consumption tracked across the active-evaluation phase 9.
- Senior living campaigns measured on tour-to-move-in conversion by entry touchpoint capture families earlier in evaluation and reduce dependence on bottom-of-funnel paid search 9.
- Home services retention campaigns prove ROI cleanly when a no-contact holdout segment establishes the counterfactual against reactivation revenue from the existing customer file 9.
- B2B paid social campaigns require randomized holdout tests because platform-reported conversions routinely include users who would have converted through organic or direct traffic anyway 5.
- Compressing the brief-to-publish cycle adds in-market days at constant budget, compounding across locations and quarterly cycles into meaningful efficiency gains without new headcount 3.
Why most campaigns fail the ROI test before they launch
Creative quality is not what separates winning campaigns from losing ones. Measurement discipline is. The Econometrica study of 288 large U.S. brands, interpreted for marketers by Kellogg Insight, found that weekly ROI was negative for more than 80 percent of TV-advertised products, and that sales effects were essentially zero for roughly two-thirds of the firms studied 1. These were not fringe advertisers running poorly produced spots. They were category leaders with agency partners and meaningful budgets.
The pattern repeats across channels because most campaigns are built backward. Teams approve creative, set a flight, and only afterward ask how performance will be measured. By then, the holdout group is gone, the pre-period baseline is unclear, and the CFO sees a media invoice without a counterfactual. Reported ROI then drifts toward whatever last-click attribution returns, which routinely overstates incremental lift.
The twelve campaigns examined here share three structural traits the failing 80 percent typically lack:
- a measurable hypothesis written before media is purchased,
- an attribution model rigorous enough to defend in a finance review,
- and an execution cadence that closes the loop between data and the next creative decision.
Everything that follows is built on those three commitments.
The measurement architecture behind every campaign that survives a CFO review
A campaign that survives finance scrutiny is engineered as a measurement system first and a creative system second. The architecture rests on four parts, each defined before media spend begins:
- the outcome variable tied to revenue or contribution margin,
- the counterfactual that isolates incremental lift,
- the attribution method documented in writing,
- and the value levers that translate marketing activity into financial language a CFO already uses.
Deloitte's Digital Transformation Value Database breaks this translation problem into roughly 50 value levers organized across 7 categories, giving marketing investments the same decomposition that finance teams apply to operations or technology spend 6. The structure matters more than the specific levers. When a campaign's projected lift is mapped to named categories such as revenue capture, cost avoidance, and asset productivity, the conversation moves from media impressions to balance-sheet effects.
Regression analysis and A/B incrementality testing are the two methods that hold up under that scrutiny. McKinsey's healthcare marketing work documents how regression quantifies the effect of each touchpoint, from a radio spot to a personalized email, on outcomes such as appointment volume, while incrementality testing isolates conversions that would not have occurred without the campaign 10. Foundational ROI measurement work makes the same point in plainer terms: last-click attribution routinely overstates lift, and disciplined multi-touch models are what link campaign activity to financial outcomes 5. Campaigns built on this architecture rarely surprise the CFO, because the answer to every likely question is already in the pre-launch plan.
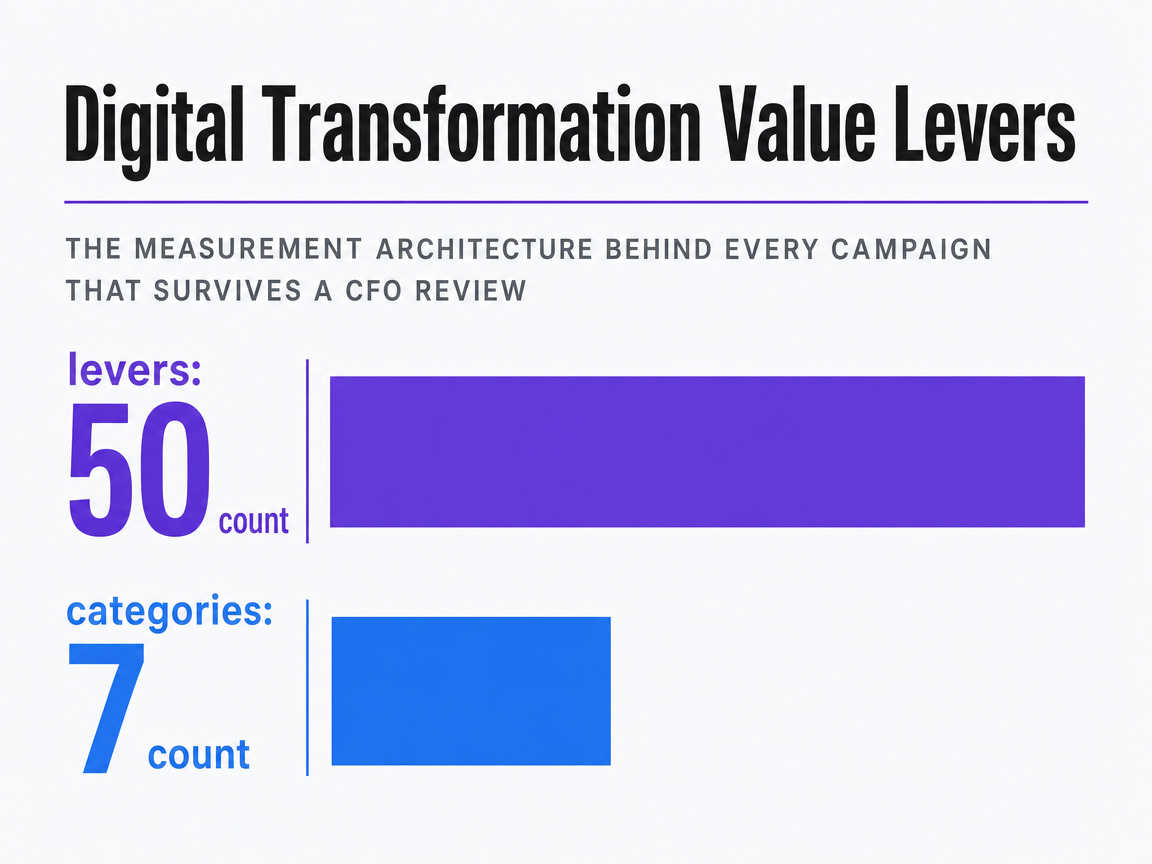 Digital Transformation Value Levers
Deloitte's Digital Transformation Value Database contains approximately 50 value levers spread across 7 categories to help healthcare organizations predict and track ROI.
Test Real Campaigns and Track Measurable ROI Instantly
Launch authentic campaigns and analyze pipeline impact using full-feature access before making any commitment.
Twelve campaigns and the mechanics that made them profitable
Scottsdale Tourism 2022: incrementality modeling on a destination budget
The Scottsdale tourism office ran the cleanest publicly documented ROI proof of the past three years. Working with Longwoods International, the campaign team used survey-based exposure modeling and economic impact analysis to isolate incremental trips, visitor spending, and tax revenue attributable to media exposure rather than baseline interest in the destination.
The headline figure: every $1 invested in the 2022 Scottsdale advertising campaign generated $116 in direct visitor spending and $4 in city tax revenue 7. That ratio is unusually high because destination marketing carries low marginal cost per incremental visit once a traveler is in-market, but the method is what travels. The campaign defined the outcome variable (incremental visits and spend), the counterfactual (matched non-exposed travelers), and the financial translation (taxes returned to the funding body) before media was placed.
The transferable pattern for in-house teams: name the population, name the comparison group, and name the dollar conversion rule in writing before the first impression is bought. Self-reported survey data has limits, and Longwoods discloses them, but a documented method beats a post-hoc dashboard every time a CFO asks how the number was built.
A regional health system's appointment-volume campaign: regression as the receipt
A regional health system running a multi-channel acquisition campaign across radio, paid search, and personalized email faces a problem the Scottsdale model does not solve: clinical demand is shaped by referrals, payer mix, and seasonality that have nothing to do with media. Regression analysis is the tool that pulls signal from that noise.
McKinsey's healthcare marketing work documents how regression quantifies the specific effect of each interaction with healthcare consumers on patient appointment volume, while A/B incrementality testing isolates the conversions that would not have occurred without the campaign 10. Treated as a system, the two methods answer different questions: regression tells the team which channels are pulling weight inside the existing mix, and incrementality tells the team whether the mix itself is producing lift.
The receipt the CFO actually wants is the regression coefficient attached to a dollar figure. When a radio flight maps to a measurable increase in booked appointments, the campaign stops being a media buy and starts being a unit-economics input.
Performance branding at scale: when brand and direct response share one P&L
Performance branding collapses the historical wall between brand campaigns measured on awareness and direct-response campaigns measured on conversion. McKinsey describes the shift bluntly: a growing share of the marketing budget is now managed according to the principles of targeted-performance marketing, with personalized messages, direct impact measurement at the level of individual users, near-time optimization, and partial automation 3.
The operational consequence is that brand-led campaigns are now expected to produce traceable lift inside the same reporting period as their performance counterparts. Creative is tagged at the user level. Optimization happens weekly rather than at end-of-flight. Budgets move between brand and conversion line items based on attribution feedback, not annual planning cycles.
For an in-house VP, the takeaway is structural: separate brand and performance P&Ls invite arbitrage and double-counting. One shared P&L, with attribution rules documented in advance, is what makes the model defensible when finance asks why brand spend rose 18 percent while direct-response CPA held flat.
AI-optimized programmatic push: CTR, conversion, and contribution margin lift
Algorithmic delivery has moved from buzzword to measurable line item. A 2024 peer-reviewed study of AI-based advertising push systems found that intelligent algorithms dynamically selecting audiences, creatives, and timing improved click-through, conversion, and economic return relative to traditional delivery strategies 2. The study frames ROI data as the indicator of advertising effectiveness, not engagement metrics treated in isolation.
The campaign pattern is straightforward to replicate. A retailer or service brand feeds the bidding model a contribution-margin target rather than a CPA target, lets the algorithm rotate creative variants against microsegments, and reviews holdout cells weekly. The lift shows up at the margin level because the system stops optimizing toward cheap clicks that do not convert into profitable customers.
The constraint worth naming: algorithmic optimization concentrates spend on whatever the model can measure. If contribution margin is not in the feed, the algorithm will not optimize for it, no matter how sophisticated the bidding logic.
Microcommunity personalization with generative AI creative
Generative AI changed the unit economics of creative production, which in turn changed what counts as a viable audience segment. McKinsey's 2025 work on personalized marketing argues that companies using improved analytics and generative AI can tailor messages to microcommunities, producing stronger engagement and higher conversion that flow through to marketing ROI 4.
The campaign archetype: a national insurer or multi-location service brand produces forty or fifty creative variants for distinct geographic, demographic, or behavioral microsegments rather than three master executions adapted with surface-level swaps. Each variant is tagged, served, and measured against a segment-specific conversion target.
The risk McKinsey flags is real and worth pricing into the plan: aggressive personalization can erode margin if discounting creeps into every variant, and consumer backlash is possible when targeting feels intrusive 4. The campaigns that hold up over multiple quarters treat microsegmentation as a relevance lever, not a discount lever, and measure margin contribution alongside conversion rate.
A behavioral health awareness campaign measured against intake volume
Behavioral health campaigns sit in a measurement category of their own. The outcome variable is not a click or a purchase; it is a person calling an intake line during a moment of crisis or readiness. Peer-reviewed work on advertising in health and medicine emphasizes that mass media campaigns can influence patient behavior, awareness, and service utilization, and that healthcare marketers need a structured guide to measuring ROI given the complexity of attributing clinical outcomes to media exposure 8.
The campaign pattern that survives ethics review pairs awareness creative with call-tracked intake numbers and tagged landing pages keyed to specific media flights. Lift is measured against pre-period baseline intake volume, with sensitivity adjustments for known seasonal patterns in behavioral health demand.
The constraint is non-negotiable. The same paper notes ethical concerns about over-commercialization, misinformation risk, and the tension between persuasive advertising and patient autonomy 8. Campaigns optimized purely for intake volume without those guardrails do not survive a compliance review, regardless of the ROI ratio they produce.
A multi-location dental group's geo-tiered acquisition campaign
This pattern applies to portfolio operators rather than single-brand VPs, so the framing shifts. A dental services organization running campaigns across twenty or thirty locations cannot treat the network as a single advertiser, and treating each location as an independent advertiser duplicates overhead without improving outcomes.
The geo-tiered acquisition pattern groups locations by market maturity, competitive density, and chair-utilization rate, then assigns each tier a different objective:
- Mature, high-utilization offices run retention and reactivation creative.
- Growth-stage offices run new-patient acquisition with aggressive offer testing.
- New openings run awareness creative with longer attribution windows because first-visit lag is structurally higher.
The measurement architecture is one model with location-level fixed effects rather than thirty separate dashboards. Foundational ROI measurement work warns against the over-reliance on last-click attribution that destroys this kind of analysis, recommending multi-touch models that link campaign activity to financial outcomes at the unit level 5. The CFO question this answers is which locations are funding which, and whether the cross-subsidy is intentional.
A legal practice's intake-driven search and content campaign
A multi-attorney legal practice running a search and content campaign measures ROI against signed matters, not leads. The gap between the two is where most legal campaigns lose their ROI defense.
The campaign pattern: paid search captures high-intent queries with conversion-tracked phone calls, while content investment targets the active-evaluation phase where prospective clients compare firms before reaching out. McKinsey's consumer decision journey framework identifies active evaluation as one of four phases where marketers win or lose, and the firms that allocate content investment to that phase outperform those that concentrate spend at the closure point 9.
The receipt is a matter-level revenue attribution model: each signed matter ties back to first-touch channel, last-touch channel, and content consumption in between. The CFO sees revenue per signed matter, not cost per lead, and the campaign budget defends itself at the case-value level.
A senior living community's CDJ-orchestrated tour-booking campaign
Senior living purchases involve adult children, prospective residents, and often a clinician, with consideration windows that stretch across months. A campaign measured on first-week conversions will underprice the work that actually moves families to book tours.
McKinsey's consumer decision journey reframes the funnel as four circular phases:
- initial consideration,
- active evaluation,
- closure,
- and postpurchase experience,
with touchpoints in each phase shaping the next decision 9. A community that orchestrates investment across all four phases, rather than concentrating spend at closure, captures families earlier in evaluation and reduces dependence on bottom-of-funnel paid search.
The campaign architecture: top-of-journey content addressing care decisions and family dynamics, mid-journey nurture sequences for inquiries that did not convert immediately, closure-phase tour incentives, and postpurchase referral programs that turn current resident families into the lowest-CAC channel in the mix. ROI is measured on tour-to-move-in conversion rate by entry touchpoint, not on lead volume.
A home services brand's retention loop: postpurchase as the highest-ROI phase
Home services brands consistently underinvest in the postpurchase phase, which is where the highest-margin revenue lives. The consumer decision journey framework treats postpurchase experience as a primary phase, not a follow-up, because it feeds directly into the next initial consideration loop through reviews, referrals, and repeat-service triggers 9.
The campaign pattern: an HVAC or plumbing operator runs scheduled-maintenance reactivation against the existing customer file, with personalized creative tied to install date, equipment age, and historical service intervals. The acquisition cost is effectively zero because the customer is already in the database, and the conversion rate runs multiples higher than cold acquisition.
The ROI defense is straightforward: incremental revenue from the reactivation cohort divided by the fully loaded cost of running the campaign, with a holdout segment that received no contact serving as the counterfactual. That single design choice separates retention campaigns that prove ROI from those that take credit for revenue that would have happened anyway.
A B2B growth team's incrementality holdout test on paid social
Paid social attribution is where reported ROI and actual ROI diverge most aggressively. A B2B growth team running LinkedIn or Meta campaigns sees platform-reported conversions that include users who would have converted through organic search or direct traffic without any paid exposure.
The incrementality holdout test addresses this directly. A randomized portion of the target audience is excluded from paid impressions for a defined period, and conversion rates are compared between the exposed and held-out groups. The difference is the incremental lift; everything else is correlation the platform happily reports as causation.
Foundational ROI measurement work makes the same point in plainer terms: last-click and platform-reported attribution routinely overstate lift, and disciplined experimental designs are what link campaign activity to financial outcomes a CFO can defend 5. The cost of running a proper holdout test is foregone conversions in the control cell. The cost of not running one is a budget built on inflated numbers.
A DSO's compressed brief-to-publish campaign cycle
The final pattern is operational rather than creative. A dental services organization running quarterly campaigns across thirty locations historically loses two to three weeks per campaign to briefing, creative review, and approval cycles before a single impression is served. That lost time is pure ROI drag because the campaign window shrinks while fixed costs run.
The compressed-cycle pattern moves brief, creative production, and channel publishing into a single governed workflow. McKinsey's performance branding work documents the shift toward near-real-time optimization and partial automation as standard practice for campaigns that need to defend ROI at granular intervals 3. The operational unlock is not eliminating human judgment; it is removing the handoff lag between strategy and publishing while keeping approval in place.
For a portfolio operator, every week shaved off the brief-to-publish cycle is a week of additional in-market time at the same budget. Across thirty locations and four campaign cycles a year, that math compounds into a meaningful efficiency gain without adding a single headcount.
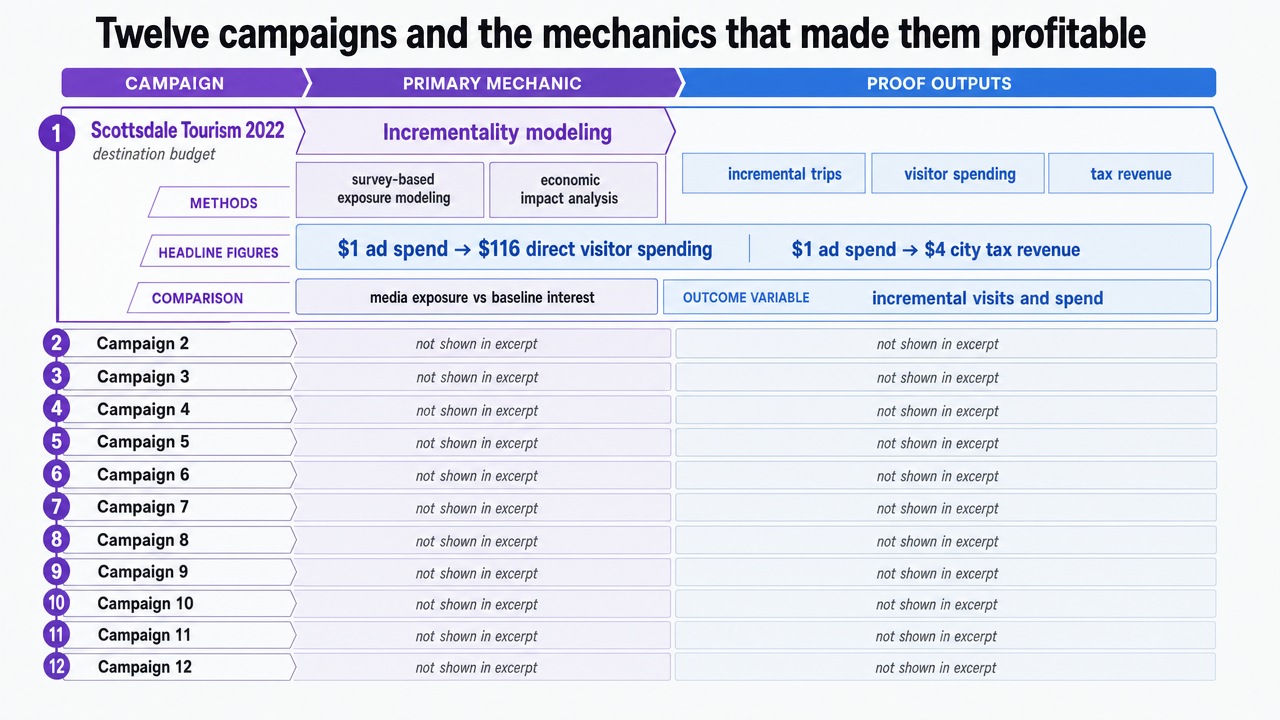 Provide a single overview infographic mapping the 12 campaign examples to their primary measurement mechanic, giving readers a navigable reference frame for the section's twelve sub-examples
If you manage multiple locations: the inputs that decide whether a portfolio campaign clears its ROI bar
The audience shifts here. Single-brand VPs can skim; portfolio operators running campaigns across a dozen or more locations face a different math problem. The ROI bar is not cleared by one campaign performing well. It is cleared by the network producing positive incremental contribution after the fixed costs of running parallel campaigns at scale.
Four variables decide the outcome before creative is written:
- location count,
- campaigns per location per quarter,
- brief-to-publish cycle time,
- and the measured ROI ratio per campaign cycle.
McKinsey's performance branding work documents that near-real-time optimization and partial automation are now standard for campaigns defending ROI at granular intervals, which directly affects how many cycles a portfolio can run inside a quarter 3.
| Input | What it controls | Reference anchor |
|---|---|---|
| Locations in scope | Fixed measurement overhead distributed across the network | Multi-touch attribution at the unit level 5 |
| Campaigns per location per quarter | Cycle frequency and learning rate | Near-real-time optimization cadence 3 |
| Brief-to-publish cycle time | In-market days at constant budget | Partial automation of execution 3 |
| Measured ROI ratio per cycle | Whether incremental revenue clears fixed costs | Documented ratio anchors such as Scottsdale's destination model 7 |
The portfolio question is not which campaign performs best. It is whether the four inputs above, multiplied across the network, produce enough incremental contribution to justify the measurement infrastructure itself. When cycle time stretches and ROI ratios compress, the network loses money on coordination overhead before a single creative variant ships.
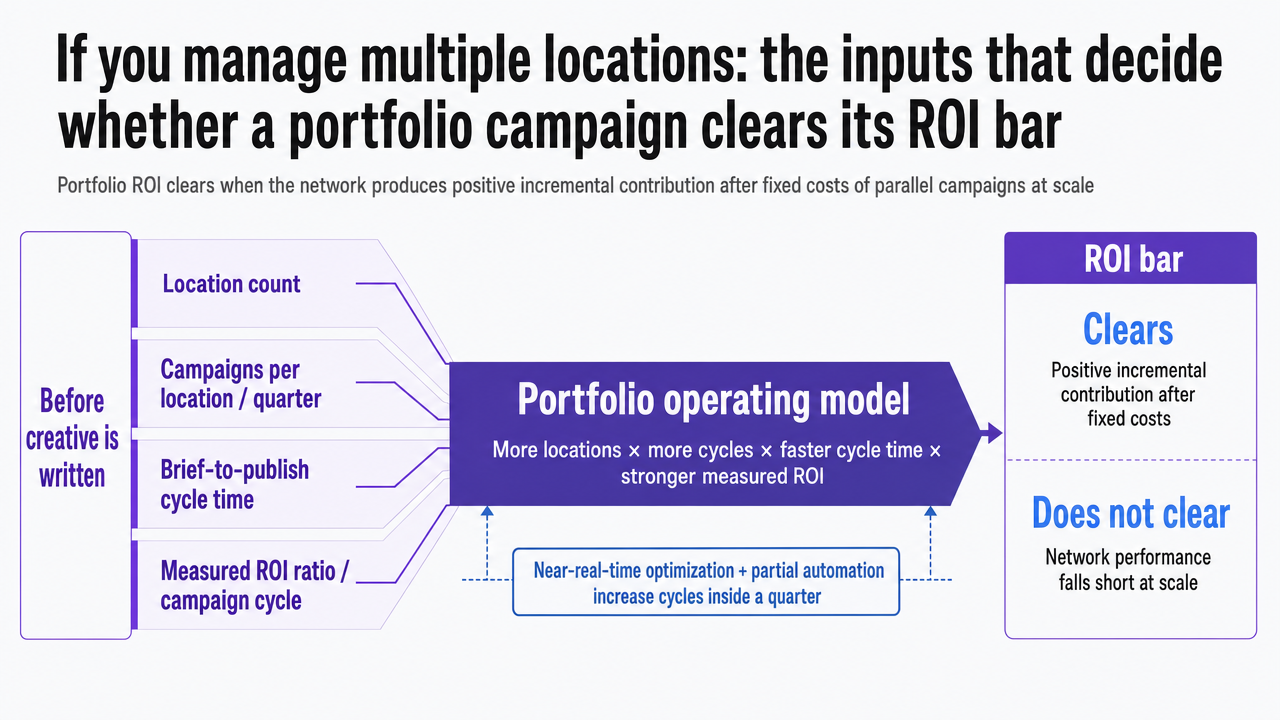 Visualize the four-input portfolio ROI framework already presented as a table in the section, reinforcing the operating model for multi-location operators
See How Leading Brands Measure and Scale Campaign ROI—Without Adding Headcount
Request a walkthrough of unified campaign reporting and multi-channel pipeline analytics designed for high-volume teams seeking predictable, data-backed marketing outcomes at enterprise scale.
Execution models that compress strategy-to-publish without adding headcount
Three execution models now compete for the in-house VP's attention:
- The traditional agency retainer, with its briefing cycles and creative review queues, still anchors most of the market.
- The hybrid in-house plus point-tool stack adds Asana, a DAM, a CDP, and three to five channel platforms stitched together by a marketing operations lead.
- The third model consolidates strategy, production, and publishing into a single approval workflow, with AI handling the production lift and humans keeping sign-off authority.
The performance branding work from McKinsey describes the direction of travel: near-real-time optimization, partial automation, and direct impact measurement at the level of individual users are becoming standard for campaigns expected to defend ROI inside the reporting period 3. Peer-reviewed evidence on AI-based advertising push systems shows the same pattern at the delivery layer, with algorithmic selection of audiences, creatives, and timing improving click-through, conversion, and economic return against traditional strategies 2.
Platforms in this third category, Vectoron among them, route every recommendation through human approval before execution, which preserves the judgment layer while removing the handoff lag. For a portfolio operator running multiple campaign cycles a quarter, the compounding effect of shorter cycles at constant budget is where the ROI math actually moves.
What the CFO will ask before approving the next campaign
Five questions decide most budget approvals, and they rarely change:
- What is the outcome variable, and is it tied to revenue or contribution margin rather than a proxy metric?
- What is the counterfactual, and how was the holdout or matched comparison group constructed before media ran?
- Which attribution method is documented, and why was it chosen over alternatives 5?
- Where does the projected lift land inside the existing value-lever framework finance already uses for other investments 6?
- And what is the decision rule if the campaign underperforms at the midpoint review?
Teams that bring written answers to all five questions before the meeting tend to leave with approval. Teams that bring creative samples and a media plan tend to leave with a follow-up calendar invite.
Frequently Asked Questions
References
- 1.TV Advertising Is Usually Not Worth It.
- 2.Computing advertising intelligent computing and push based on big data.
- 3.Performance branding and how it is reinventing marketing ROI.
- 4.The next frontier of personalized marketing.
- 5.Measuring Success and ROI.
- 6.Measuring the ROI of Digital Transformation in Health Care.
- 7.Scottsdale 2022 Advertising ROI Research.
- 8.Advertising in health and medicine: using mass media to communicate with patients.
- 9.The consumer decision journey.
- 10.Marketing in healthcare: Improving the consumer experience.
- 11.The impact of marketing strategies in healthcare systems.