
Key Takeaways
- Social programs lose budget arguments when goals are framed around reach; rewriting briefs around pipeline dollars, target accounts, and revenue-linked secondary KPIs forces every downstream decision to justify itself.
- Last-touch attribution systematically undercredits social in B2B journeys, so a multi-touch model that ties social engagement to CRM opportunity records is needed to defend the channel in a CFO review 5.
- Concentrating budget on LinkedIn and targeting specific roles within named accounts—economic buyer, technical evaluator, champion—outperforms broad-audience spread across every platform 2, 9.
- Move reporting from Tier 3 engagement signals to Tier 2 influenced pipeline before chasing Tier 1 sourced revenue, and consolidate measurement first when scaling across locations or campaigns 11, 13.
Why most social programs cannot defend their pipeline number
Social media often occupies a peculiar position in B2B marketing. Despite approved budgets, allocated headcount, and full calendars, when the CFO inquires about social's contribution to pipeline, the response typically involves impressions, follower growth, and vague references to "influence." This answer is no longer sufficient. OpenView's C-Suite Go-To-Market Benchmark reveals that the primary marketing metrics in use are total revenue (18%) and marketing-qualified leads (16%), with marketing-influenced pipeline closely following—none of which engagement dashboards can independently provide 3.
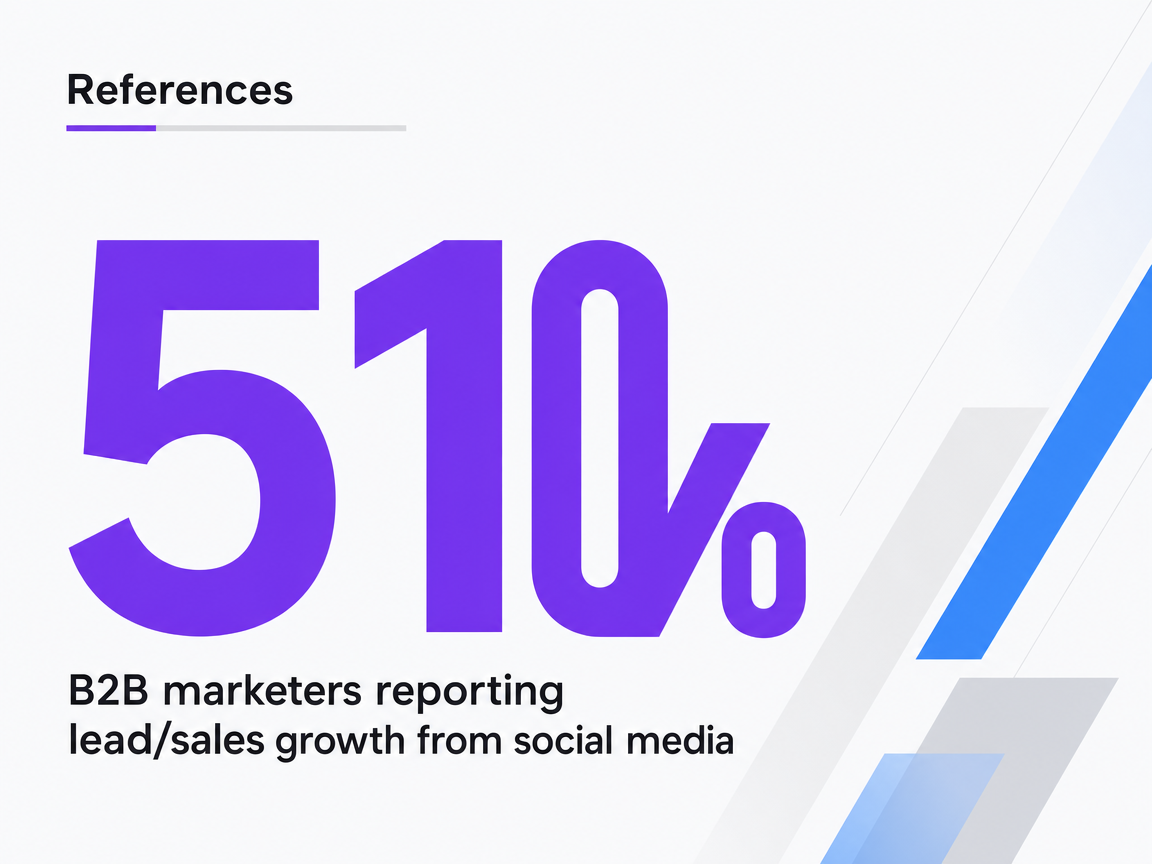
The credibility gap is evident. Only 51% of B2B marketers report that social media has driven lead generation and sales growth for their organization, according to a survey compiled by Rick Whittington 10. This implies that nearly half of B2B teams managing social media cannot link the channel directly to revenue.
The issue rarely lies with creative output; demand generation managers running social programs often produce more assets than sales teams can follow up on. The constraints are primarily in three areas:
- campaign goals centered on reach rather than revenue,
- attribution models that assign last-touch credit to the final form fill, and
- execution targeting broad audiences instead of specific buying committees within target accounts.
This article will address each of these points sequentially.
Redefining the campaign goal: revenue, not reach
A social campaign goal like "grow LinkedIn followers by 25%" is a content-team objective. In contrast, "contribute $1.2M in influenced pipeline to the Q3 enterprise segment" is a demand generation goal. This distinction is crucial for social programs to secure budget approval rather than being reclassified as brand spend.
Senior marketing leaders are already shifting their measurement focus. OpenView's C-Suite Go-To-Market Benchmark survey found that top metrics for marketing leaders include total revenue (18%), marketing-qualified leads (16%), and marketing-influenced pipeline, with engagement metrics not making the cut 3. This indicates that demand generation managers will be evaluated on these revenue-centric metrics, regardless of their default dashboard views.
LinkedIn's 2024 B2B Marketing Benchmark further supports this trend, highlighting revenue and pipeline as the key success metrics for modern B2B teams, moving away from awareness proxies 1.
To translate this into a campaign brief, the goal must be rewritten. A revenue-defined social campaign specifies three elements before any creative work begins:
- the target accounts or segment,
- the pipeline dollar value the campaign is responsible for over a defined period, and
- secondary KPIs—such as MQL volume, MQL-to-SQL conversion, and pipeline velocity—that explain how the revenue target will be achieved.
Reach, impressions, and engagement rate remain in reports but serve as diagnostic inputs, not primary outcomes.
A simple test applies: if a campaign's stated goal can be met without generating a single new opportunity in the CRM, it is not a pipeline goal. By reframing briefs this way, demand generation managers compel every subsequent decision—platform mix, audience definition, offer design, follow-up workflow—to justify itself against a revenue target rather than a reach metric. This reframing is essential for the attribution and account-targeting strategies discussed later to be effective.
The attribution architecture that survives a CFO review
Why last-touch and form-fill systematically undercount social
The typical B2B reporting stack attributes credit to the channel that generated the final form fill before an opportunity was created. For social media, this rarely reflects its true contribution. A buyer might see a LinkedIn ad, watch a partner's demo, follow product engineers, engage with a customer testimonial, then search for the brand and convert via a paid search ad weeks later. Last-touch attribution credits paid search, while social's earlier touches remain unrecorded in the CFO's dashboard.
Sprout Social's attribution guide explicitly states that social media attribution aims to identify and credit touchpoints influencing the buyer's journey from awareness to conversion, which a single-touch model inherently cannot do 4. When the journey spans multiple devices, platforms, and weeks—common in B2B buying committees—this underreporting is exacerbated.
Operationally, this leads to budget being diverted away from channels performing crucial upstream work. Demand generation managers defending social spend often lose budget arguments not due to creative quality, but because the measurement system is designed to credit conversion events, not influence patterns. Rectifying the attribution model is a prerequisite for successful budget discussions.
Building a multi-touch model that ties social touches to CRM opportunities
Multi-touch attribution allocates fractional credit to each touchpoint contributing to a conversion, using this distribution to guide future spend 5. In a B2B buying journey, this significantly alters credit allocation. Consider a seven-touch path to a closed opportunity: a LinkedIn ad impression, organic LinkedIn engagement, gated content download, retargeting display ad, sales-led webinar registration, a second LinkedIn ad click, and a branded search conversion. Under last-touch, branded search gets 100% credit, and social gets none. With a linear multi-touch model, each touch receives about 14%, meaning social touches collectively account for roughly 43%. A position-based model (40% first touch, 40% last touch, 20% distributed) could credit social's initial LinkedIn impression with 40% alone 5.
Implementing this model requires three key connections:
- Social platform data (paid impressions, clicks, organic engagement) must integrate into a single dataset with web analytics and CRM activity. Sprout Social identifies this data integration layer as the foundational step before model selection 4.
- Contact records must carry social engagement history into opportunity records, making influence visible at the deal level.
- The attribution model itself—linear, position-based, time-decay, or algorithmic—must be chosen deliberately, considering typical buying cycle length and the relative importance of early versus late touches.
Twilio emphasizes that the model's purpose is not perfect credit assignment, but improved future spend allocation 5. Once social's contribution is visible across the deal lifecycle, financial discussions shift from "prove social generated this lead" to "here's how social contributes to closed deals."
What 'good enough' attribution looks like in practice
Achieving perfect attribution is not the goal, and pursuing it often hinders program progress. Sprout Social's guide explicitly states that perfect attribution is unrealistic and advises balancing precision with practicality 4. Twilio echoes this, noting that data gaps and model assumptions will always introduce uncertainty 5.
For demand generation managers overseeing social, a workable standard involves:
- capturing contact-level social engagement and making it visible on the CRM opportunity record;
- applying a single multi-touch model consistently across all channels; and
- separating sourced pipeline from influenced pipeline in reporting to provide finance with both figures without conflation.
This is sufficient to defend the channel in a revenue review and to reallocate spend towards campaigns and audiences that genuinely drive deals. While methodology refinement is ongoing, reporting credibility must be established before the next quarterly review to ensure social wins the budget conversations it deserves.
Test Data-Driven Social Campaigns in Real Time
Launch live social campaigns and track their pipeline impact before making a commitment.
Channel mix logic: where B2B social actually produces pipeline
Channel selection is a common area where social programs waste resources. The inclination to maintain a presence on every platform—LinkedIn, X, Instagram, YouTube, Threads, and emerging platforms—stems from the belief that audiences are fragmented and broad coverage is essential. For B2B demand generation, this approach is often inefficient.
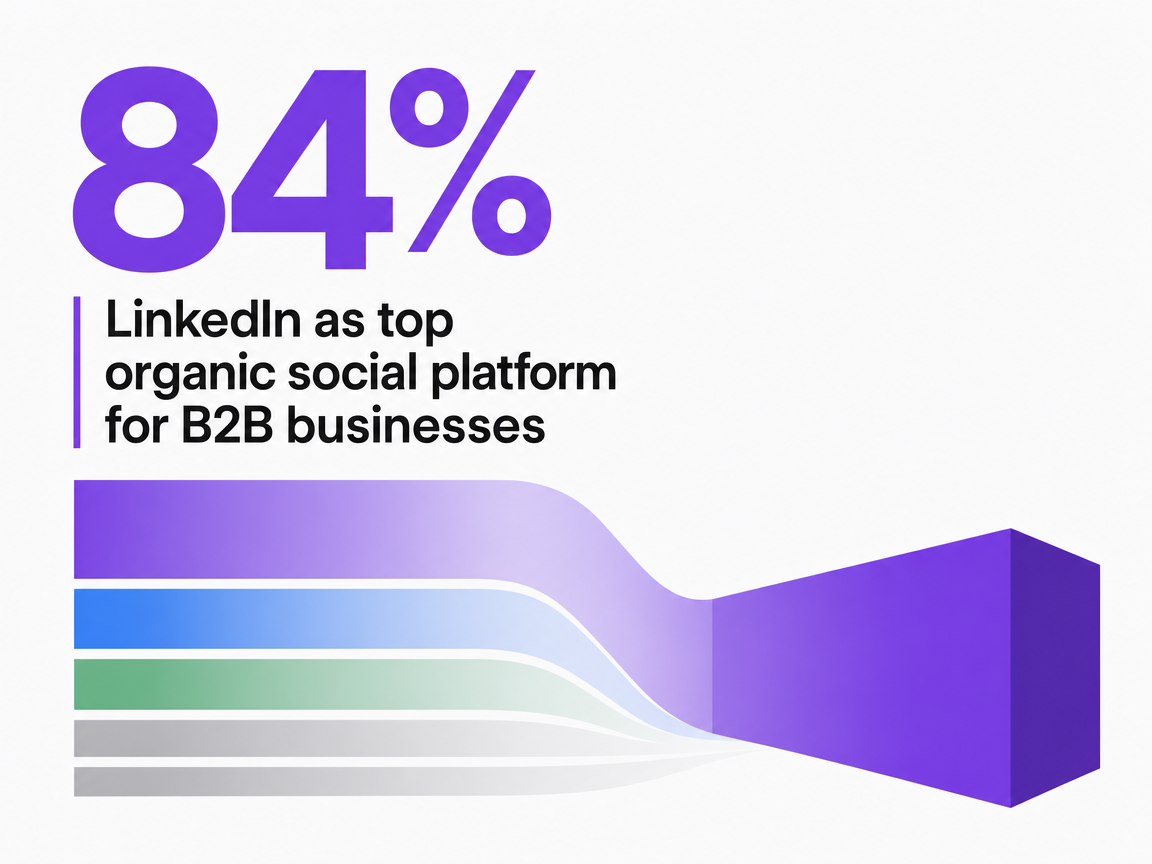
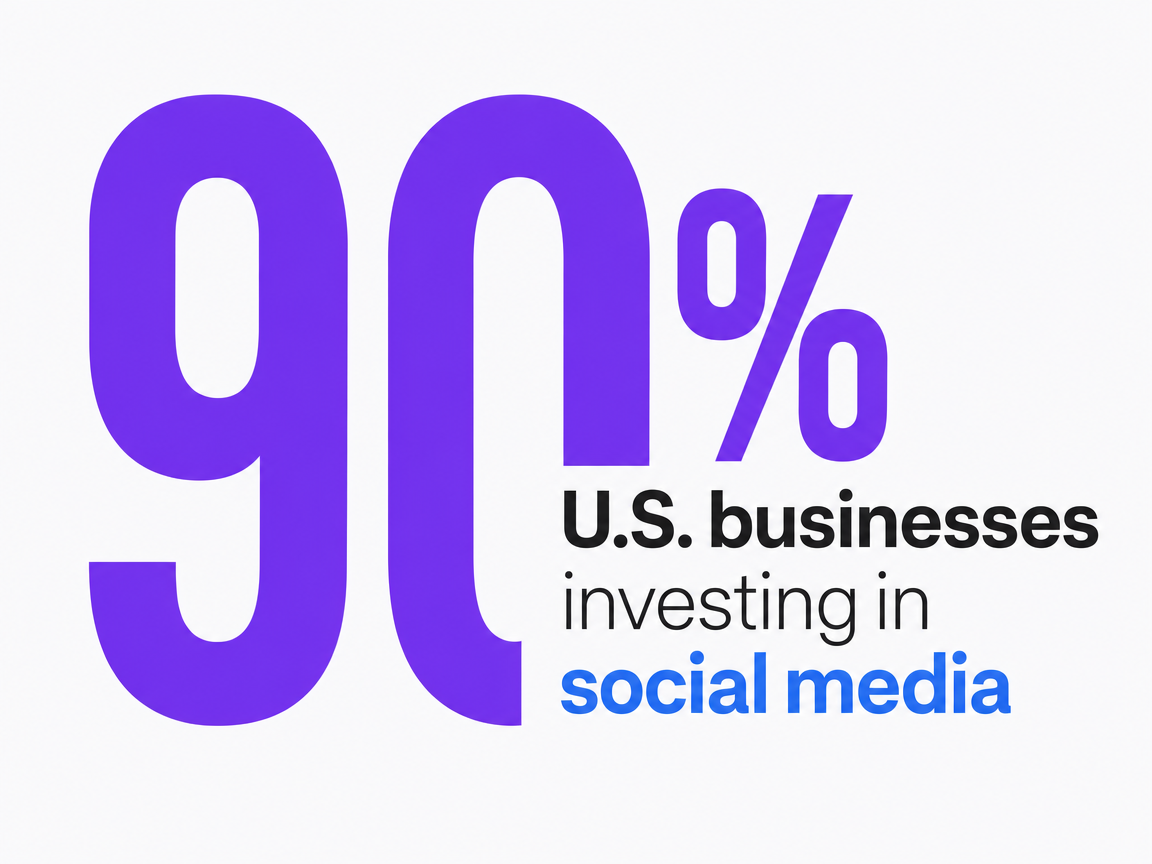
Forbes Advisor's analysis of recent content marketing data indicates that LinkedIn is the leading organic social media platform for B2B marketing among 84% of businesses 2. While the study covers U.S. businesses broadly, the high concentration on LinkedIn is specific to B2B. This has two implications: first, the B2B buying committee is significantly concentrated on one platform, which should dictate budget allocation, not just calendar planning. Second, with over 90% of U.S. businesses investing in social media for brand promotion, differentiation comes from how social converts to pipeline, not merely from having a social presence.
For a pipeline-accountable social program, practical channel mix logic prioritizes LinkedIn for reaching buying committees, targeted advertising based on firmographic and job-title filters, and distributing thought leadership from executives and subject-matter experts. Secondary platforms are allocated budget only if CRM data confirms they align with specific buyer behaviors—for example, YouTube for technical evaluation content used by sales teams during deal cycles, or industry-specific communities where target accounts are active. Platforms that cannot be linked to opportunity records are demoted to organic-only or removed entirely.
The key is asymmetric investment. A team attempting to manage five platforms with equal effort often results in five mediocre channels. Conversely, a team that heavily invests in LinkedIn and strategically supports two other platforms with clear pipeline justification will have one channel that consistently proves its value in revenue reviews and two others that demonstrate documented contributions.
 LinkedIn as top organic social platform for B2B businesses
LinkedIn as top organic social platform for B2B businesses
Account-level execution: covering the buying committee, not the audience
Broad-audience social targeting typically yields broad-audience results: impressions from non-buyers, MQLs from individual contributors without purchasing authority, and engagement from competitors. Pipeline-accountable social reverses this model, focusing on the buying committee within a named target account rather than a demographic segment.
INFUSE's perspective on account-based programs is relevant here: ABM leverages social media to build brand awareness and credibility with buying group members through targeted advertising and thought leadership aimed at key account stakeholders. This is part of an omnichannel strategy that also includes email, content, events, and sales outreach 9. The critical element is the buying group. A typical B2B purchase involves an economic buyer, a technical evaluator, a champion, an end user, and procurement. Social campaigns designed for broad reach treat these roles as a single audience, whereas pipeline-focused campaigns address them as distinct coverage challenges.
Effective coverage necessitates three operational shifts:
- Audience definition begins with the target account list and extends to the specific roles within those accounts, rather than starting with a job-title filter applied to the platform's entire user base. LinkedIn's matched audiences and company targeting are practical tools, but the discipline lies in not expanding the audience beyond named accounts.
- Message variation should align with roles, not just industry. The economic buyer needs ROI framing and peer-company case studies. The technical evaluator requires architectural details and integration evidence. The champion benefits from internal-selling assets they can forward.
- Frequency is measured per role within the account, not as total impressions across the platform. A buying committee that has collectively seen the brand fourteen times, distributed across five roles, is in a different position than one where only the champion has seen it fourteen times.
The reporting implications are significant. Account-level execution makes social's contribution visible at the deal level—the CRM opportunity record shows which roles within the account engaged, when, and with what content. This visibility transforms the attribution work discussed previously from a methodological exercise into a tangible sales conversation.
Retire the vanity KPIs, elevate the pipeline ones
Many social dashboards contain obsolete metrics—impressions, follower growth, engagement rate, share of voice, average watch time—that persist from an awareness-focused era. While not inherently wrong to track, they should not be primary indicators.
The Insight Collective's KPI guidance clarifies that MQLs alone are only one component of a broader KPI set, and treating any single funnel-stage metric as the headline obscures whether the program is actually generating revenue 12. This argument extends further: if MQL volume is insufficient, engagement rate as a primary social KPI is even more removed from actionable insights for sales leaders.
The metrics to prioritize are those that link a social touch to a CRM record:
- Marketing-influenced pipeline—the dollar value of opportunities where social engagement appears on the contact or account record—should be at the top of the report.
- Sourced pipeline, where social was the initial identified touch, should be placed alongside it.
- MQL-to-SQL conversion rate by social campaign reveals which audiences and messages produce qualified buyers.
- Pipeline velocity for opportunities with social touches, compared to those without, indicates whether social is accelerating or decelerating the deal cycle 11.
Engagement metrics should be relegated to a diagnostic role. A campaign with strong influenced pipeline but weak engagement is effective. A campaign with high engagement but no pipeline contribution is merely a content exercise. The dashboard should clearly distinguish these, with revenue metrics prominently displayed and engagement metrics available for deeper analysis when a campaign underperforms and diagnosis is needed.
To concretize this shift, rebuild the weekly social report so that the first three numbers a demand generation manager sees are influenced pipeline contribution, MQL-to-SQL conversion by source campaign, and pipeline velocity delta. If current systems cannot produce these numbers, the attribution work discussed previously is a prerequisite, not merely a reporting redesign.
See How Enterprise Teams Convert Social Engagement into Qualified Pipeline
Request a walkthrough of unified, data-driven workflows that align social metrics with revenue attribution—built for agencies and brands managing multi-channel lead generation at scale.
The three-tier reporting maturity model for social
Most social programs do not require a new dashboard; they need to understand their current reporting capabilities and the steps to advance to the next level.
The B2B Playbook's demand generation reporting framework outlines a three-tier progression, moving from indirect impact signals at Tier 3 to clear revenue contribution at Tier 1 11. Applied to social, these tiers define what a demand generation manager can credibly defend in a quarterly review.
Tier 3 — Signals of Impact. : Reporting at this level displays engagement, audience growth, reach, and website traffic referred from social. It answers "is the channel active?" but not "is the channel producing revenue?" Most social programs default to this tier, where they often lose budget discussions because their metrics do not align with the C-suite's focus on total revenue, MQLs, and influenced pipeline 3.
Tier 2 — Influenced Pipeline. : This level of reporting connects social engagement to CRM opportunity records. The dashboard shows the dollar value of pipeline where social touches appear on the contact or account, MQL-to-SQL conversion by source campaign, and pipeline velocity for deals with social engagement versus those without. Achieving Tier 2 requires the data integration and multi-touch model described earlier—social platform data flowing into the same dataset as web analytics and CRM activity, with engagement history carried onto opportunity records 4, 5. At this tier, social earns its budget line based on documented contribution rather than narrative.
Tier 1 — Sourced Revenue. : Reporting at this level isolates closed-won revenue where social was the first identified touch and tracks customer acquisition cost and pipeline velocity at the channel level 11. Tier 1 is uncommon for social due to the lengthy, multi-touch nature of B2B buying journeys. Clean first-touch attribution demands rigorous tracking from the earliest impression. Teams that reach Tier 1 typically do so for a defined segment—such as a specific product line or account tier—rather than the entire program.
The diagnostic question is not "which tier should social aim for?" but "which tier can the current reporting stack support, and what investment is needed to advance one level?" A team at Tier 3 attempting to jump directly to Tier 1 often produces fragile numbers that fail under scrutiny. A team that progresses from Tier 3 to Tier 2 over a quarter, then from Tier 2 to Tier 1 for a priority segment over the next two, builds compounding reporting credibility.
If you manage multiple locations: consolidating social execution across a portfolio
A note on audience: this section is written for demand generation managers and marketing operators running social across multiple locations—legal practices, dental groups, behavioral health networks, home services franchises, senior living portfolios, healthcare systems. Single-location readers can skip ahead.
Portfolio operators face a distinct challenge. The question isn't whether social can generate pipeline, but whether thirty locations each running their own social program yields thirty times the pipeline, or thirty times the overhead with diminishing returns per location.
In most portfolios, the latter is true. Per-location execution disperses creative work, audience targeting, and reporting among local managers who often lack the time or attribution infrastructure to operate beyond Tier 3. The portfolio sees engagement metrics from every market but influenced pipeline from almost none. Centralizing execution—with local input on offers, geography, and account lists, but unified measurement, creative production, and CRM integration—moves the portfolio from Tier 3 across all locations to Tier 2. Martal's pipeline guide suggests up to 43% better results from consolidated, specialist-led lead generation compared to distributed in-house execution 13, providing a benchmark for the value of specialist capacity when reporting maturity is constant.
| Variable | Distributed per-location model | Centralized signal-driven model |
|---|---|---|
| Reporting tier (per ref_11) | Tier 3 across locations | Tier 2 across locations, Tier 1 for priority segment |
| Cost per qualified lead | Operator's current CPL | Operator's current CPL, adjusted for up to 43% lift 13 |
| MQL→SQL rate | Operator's current rate | Improves as account-level targeting replaces broad audiences |
| Pipeline visibility | Per-location dashboards, no portfolio rollup | Unified CRM rollup across locations |
For portfolio operators, the operational takeaway is to consolidate measurement before consolidating creative. A portfolio that unifies CRM integration and attribution across locations—even while maintaining local creative production—gains the visibility needed to redirect spend toward markets that generate pipeline, not just those that produce posts.
Scaling output without adding headcount
The question of capacity underlies every decision discussed in this article. A demand generation manager who agrees with the attribution argument, the account-level execution model, and the reporting maturity ladder still faces the challenge of producing creative, running campaigns, integrating data, and reporting numbers—often with a team already at capacity.
Outsourcing has been the traditional solution, with Martal's pipeline guide indicating up to 43% better results from specialist-led lead generation compared to distributed in-house execution 13. This figure highlights the impact of shifting execution from generalists juggling multiple channels to specialists focused on one. The performance improvement is real; the delivery model is the variable.
An operating model that achieves similar gains without an agency contract has three components:
- Specialist execution capacity for each channel—social, content, paid, attribution—operates against live CRM signals rather than a static calendar.
- Every recommendation passes through an approval workflow, allowing the demand generation manager to retain creative and budget control.
- Approved work executes automatically, with results flowing back into the same dataset read by the attribution model.
This loop makes Tier 2 reporting sustainable across a portfolio of campaigns, rather than a one-quarter project. Platforms like Vectoron are designed around this loop, underscoring that scaling social output is now a workflow problem, not a headcount problem.
 U.S. businesses investing in social media
U.S. businesses investing in social media
 B2B marketers reporting lead/sales growth from social media
B2B marketers reporting lead/sales growth from social media
Frequently Asked Questions
References
- 1.2024 B2B Marketing Benchmark | Download Annual Report.
- 2.Top Content Marketing Statistics – Forbes Advisor.
- 3.B2B Marketing in 2024: 8 Trends That Are Changing the Game and How to Adapt.
- 4.What is Attribution Modeling for Social Media Marketing?.
- 5.Multi-touch attribution: what it is & how to do it right.
- 6.B2B Digital Marketing Benchmarks & Statistics 2024-2025.
- 7.B2B Marketing Benchmarks to Help You Set Goals for 2024.
- 8.B2B Demand Generation Strategies.
- 9.What is ABM Program – B2B Marketing Glossary.
- 10.5 Statistics About B2B Demand Generation with Social Media.
- 11.How To Measure Demand Generation | Demand Gen Reporting Guide.
- 12.12 Key Demand Generation Metrics Every B2B Marketer Should Track.
- 13.B2B Marketing Best Practices: 2026 Guide to More Pipeline.