
Key Takeaways
- Social media now functions as a buyer research channel, with Forrester ranking it second only to generative AI tools and 68% of B2B buyers preferring to research independently before engaging vendors 11.
- Pipeline-producing programs operate as a demand layer rather than a brand silo, with platform selection extending beyond LinkedIn to reach buyers where Pew shows YouTube at 84%, Facebook at 71%, and Instagram at 50% 1.
- Vanity metrics like impressions and follower growth should be replaced with post-click signals: return visits, pricing-page entries, branded search lift, and pipeline-stage progression among exposed accounts 10.
- Multi-location operators reduce cost and disclosure risk by consolidating execution into a single approval loop, where briefing hours and compliance standards stay flat as location count grows 3.
Why Social Became a Buyer Research Channel
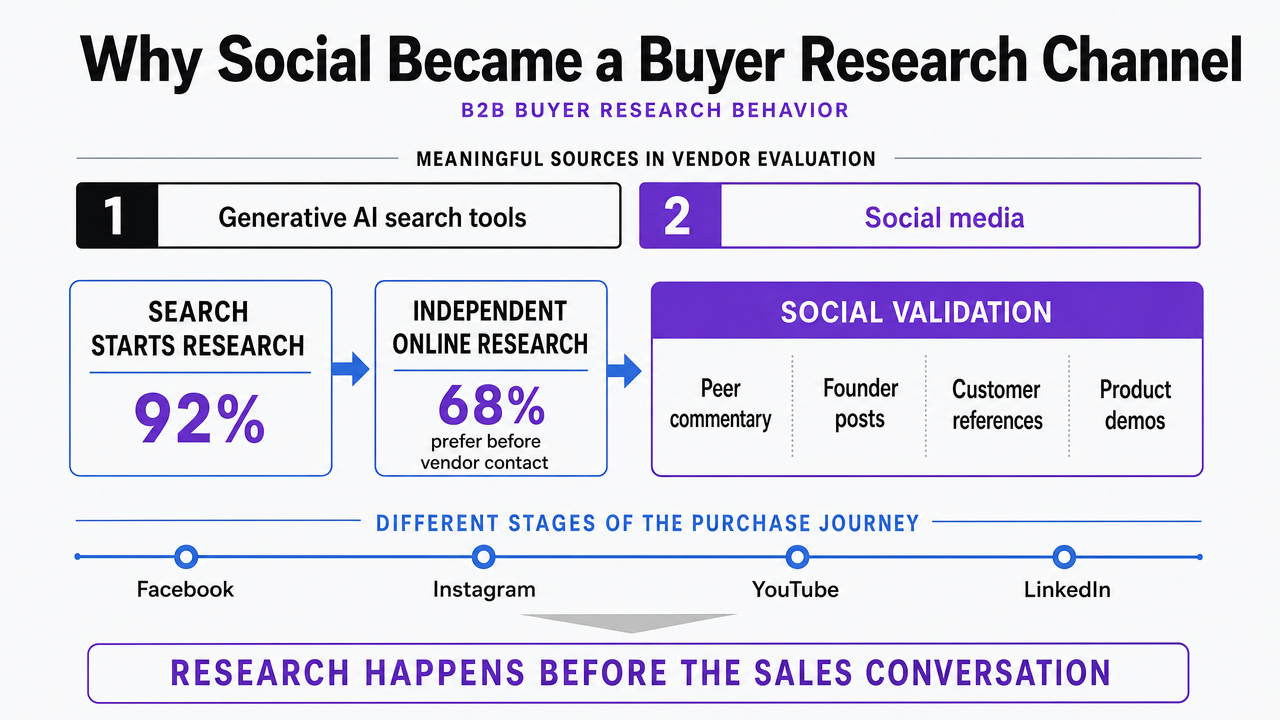
The framing of social media as an awareness channel has outlived its usefulness. Forrester research on B2B buyer information sources now places social media as the second most meaningful source buyers turn to when evaluating vendors, sitting just behind generative AI search tools, with Facebook, Instagram, YouTube, and LinkedIn contributing at different stages of the purchase journey 9. This finding reframes the purpose of social campaigns: they are integral to how buyers research before a sales conversation ever happens.
Forrester's analysis of B2B buyer behavior found that 92% of purchases start with search and 68% of buyers prefer to research online independently before engaging a vendor 11. During this research, social media plays a crucial role in validation through peer commentary, founder posts, customer references, product demos, and analyst discussions. Campaigns that ignore this stage are invisible during the critical part of the journey that determines the shortlist.
Audience scale further supports this shift. Pew Research Center's 2025 survey of U.S. adults reports YouTube use at 84%, Facebook at 71%, and Instagram at 50% 1. Approximately 53% of U.S. adults also report getting news from social platforms at least sometimes, indicating social media's embedded role in information consumption 2. For service-vertical buyers—such as those in legal, healthcare, behavioral health, dental, home services, and senior living—the individuals making or influencing purchases are accessible across multiple networks.
The operational consequence is that pipeline-producing social campaigns must be designed to support self-directed research, not to interrupt it. All subsequent considerations in this piece—platform selection, measurement, coordination, disclosure, and consolidation—stem from this fundamental repositioning.
 Visualize the platform reach data cited in this section to support the argument that buyers are accessible across multiple high-reach networks beyond LinkedIn
The Operating Model Behind Pipeline-Producing Campaigns
Treating Social as a Demand Layer, Not a Brand Silo
The primary structural error in most social programs is their reporting to brand departments and adopting brand-centric measurement habits. This often leads to deliverables focused on reach, impressions, follower growth, and sentiment, while pipeline generation becomes another team's responsibility. This separation makes social appear as a cost center, even when it significantly influences buying behavior upstream of the CRM.
Repositioning begins by asking what social campaign spend should produce and on what timeline. When marketing leaders define success by awareness lift or share of voice, teams optimize for the wrong outputs. McKinsey's analysis of B2B Pulse data reveals that companies achieving over 10% annual market share growth integrate advanced sales technology, hybrid sales, hyperpersonalization, and digital channels—including social and mobile—into a single system, rather than managing them as separate programs 5. Social justifies its budget when it functions as a demand layer within this integrated system, channeling qualified buyer attention into conversion-focused channels.
Demand-layer execution differs significantly from brand execution. Content is crafted around buyer questions asked before sales engagement, not around campaign themes. Posting cadence aligns with the research arc of a real purchase, not a content calendar. Creative is evaluated based on its ability to drive downstream buyer actions—such as return visits, comparison searches, or demo requests—rather than engagement thresholds. Forrester's demand-creation framework similarly advises marketers to look beyond clicks, video views, and white paper downloads to the subsequent actions of named personas 10.
Deloitte's CMO Survey highlights the ongoing pressure on marketing leaders to demonstrate the value of digital investments amidst moderating budgets 6. This pressure necessitates a demand-layer framework. A social program unable to articulate its contribution to pipeline in operational terms will consistently lose budget arguments to channels that can.
Platform Selection Beyond the LinkedIn-Only Default
Many B2B social strategies default to LinkedIn, assuming it's where professional audiences reside. However, this assumption often doesn't hold for service verticals where buyers are also consumers, patients, parents, or homeowners outside of work.
Pew Research Center's 2025 survey indicates that YouTube is used by 84% of U.S. adults, Facebook by 71%, and Instagram by 50% 1. LinkedIn's general adult reach is considerably lower. For marketing VPs at multi-location dental groups, behavioral health networks, regional law firms, or home services operators, the individuals who refer, recommend, and validate are often consuming procedure explainers on YouTube and engaging with peer comments on Facebook long before encountering a sponsored LinkedIn post.
Forrester's mapping of the B2B buyer journey supports a broader platform approach. Facebook, Instagram, YouTube, and LinkedIn each contribute at different stages—discovery, validation, comparison, and reference-checking 9. Limiting strategy to a single platform means conceding the stages it doesn't cover. With about 53% of U.S. adults getting news from social platforms, information exposure during the research phase occurs across these high-reach networks 2.
In a pipeline-accountable model, platform selection uses three filters:
- Where is the buyer reachable at the required scale? Pew's reach data provides this ceiling 1.
- What stage of the research arc does each platform serve? YouTube is strong for demonstrations; Facebook for community signal and reviews; Instagram for visual credibility in verticals like dental; and LinkedIn for professional credibility among buying committees.
- What can the team realistically produce well? A program publishing thin content across four networks will be less effective than one delivering useful content on two.
The LinkedIn-only default is often a capacity decision disguised as a strategic one. Recognizing this reframes the discussion: the question shifts from whether other platforms matter to what production model is needed to effectively serve the relevant ones.
Coordinating Social With Search, Content, and Paid
Social campaigns generate pipeline when they align their research arc with the rest of the marketing funnel. They fail when they operate on separate calendars, with distinct KPIs, and through different vendors.
The coordination problem is evident in fragmented buyer journeys: a buyer sees a founder's LinkedIn post, searches the company on Google, lands on a product page unrelated to the post, and then receives a retargeting ad with a different value proposition. Each channel performed its isolated task, but the buyer disengaged due to a disjointed experience. McKinsey's B2B growth research emphasizes this: companies achieving over 10% annual market share growth integrate social, search, content, and paid into a single, cohesive motion, rather than managing them as parallel programs under different owners 5.
Integration is operational before it is creative. Three coordination points are key:
- Topic alignment: topic alignment, ensuring social, organic search content, and paid creative all draw from the same buyer-question inventory each quarter, reinforcing messaging across channels.
- Sequencing: timing social posts to drive traffic to new organic content, with paid retargeting for non-converters.
- Measurement: establishing a shared definition of pipeline-relevant actions, applied consistently across channels to eliminate attribution disputes.
The primary obstacle is rarely strategy, but rather the briefing and approval overhead between teams or vendors. Separate social, content, and paid agencies, each with their own briefs and calendars, inherently produce fragmented buyer experiences. Consolidating execution under a single approval loop—with unified priorities, a ranked content plan, and a single performance view—makes coordination efficient and effective. Sections 5 and 6 further explore the operational economics of this consolidation.
Test Data-Driven Social Campaigns in Real Time
Experience measurable pipeline impact by launching and tracking live social campaigns during your trial.
Measuring What Actually Predicts Pipeline
The Vanity Metrics Marketing Leaders Should Stop Reporting
Most social dashboards still prioritize impressions, clicks, video views, and content downloads. These metrics describe attention, which is a precondition, not an outcome, and do not predict pipeline. Marketing leaders presenting these numbers to a CFO risk losing the argument for social media's financial contribution.
Forrester's demand-creation framework directly addresses this issue, advising marketers to move beyond clicks, video views, and white paper downloads. Instead, they should examine the subsequent actions of named buyer personas, segmented by who that person was 10. For example, a post with 50,000 views from a target buying committee member who returned to the site twice and viewed a pricing page is fundamentally different from a post with 50,000 views from individuals outside the addressable market. Aggregate numbers obscure these critical distinctions.
Marketing leaders should retire specific vanity metrics from monthly executive reports:
- Impressions and reach without persona segmentation
- Follower count growth
- Average engagement rate across all content
- Total video views without watch-through or return-visit context
- Content downloads counted as MQLs without behavioral qualification
While these metrics might show positive movement, pipeline contribution can remain flat or decline because they measure campaign surface area rather than impact on relevant buyers.
The replacement metrics belong in the same view:
- Return visits from social-attributed sessions
- Entries to pricing and comparison pages originating from social
- Demo or consultation requests with a social touchpoint
- Pipeline-stage progression for accounts with documented social exposure 10
This shift is not merely cosmetic; it distinguishes between reporting channel activity and demonstrating revenue-connected buyer behavior.
Post-Click Buyer Behavior as the Real Signal
The crucial question is not whether someone clicked, but what they did next.
Forrester's framework emphasizes tracking post-click behavior as the primary signal, with specific actions varying by persona 10. A clinical director researching behavioral health software behaves differently from a regional operator comparing dental practice acquisition partners. Both might click the same LinkedIn post, but only one set of subsequent actions—such as a pricing inquiry, case study downloads, multiple return visits, or a branded search for referrals—aligns with the pipeline the campaign aims to feed.
Three behavioral signals hold significant predictive weight in service-vertical programs:
- Return visits within a research window of two to four weeks, indicating active evaluation
- Branded search lift from a defined audience after a social campaign, serving as a proxy for independent online research 11
- Pipeline-stage progression for accounts with an early social touch, measured against a control group without such exposure
None of these signals require a perfect attribution model. They necessitate agreement between the campaign and revenue teams on a small set of meaningful post-click behaviors, instrumenting them in analytics and CRM, and reviewing them consistently alongside paid search and content. This agreement is often overlooked by social programs. Without it, the channel is graded on activity rather than effect, leaving teams without a defensible position during budget discussions. A robust measurement framework is essential for the operating model's resilience during challenging quarters.
Disclosure and Endorsement Liability in Advocacy Programs
Advocacy programs—including employee posts, customer testimonials, creator partnerships, and referral incentives—often expose pipeline-focused social campaigns to unforeseen legal risks. The Federal Trade Commission's endorsement framework holds both the advertiser and the endorser potentially liable for false or unsubstantiated claims and for failing to disclose material connections 4. A material connection encompasses employment, payment, free products, commissions, or any other relationship a reasonable audience would consider relevant when evaluating an endorsement.
The FTC's operational rule for social endorsements is clear: disclosures must be conspicuous, unambiguous, and placed directly with the endorsement itself, not hidden in a profile bio, thread reply, or hashtag string 3. This standard invalidates common workarounds, such as a #ad tag at the end of a long caption, a generic "partner" label in a bio, or a disclosure only in a video description while the spoken endorsement is unmarked.
Three program elements pose the highest risk for marketing leaders managing advocacy at scale:
- Employee posts about company products without disclosing the employment relationship
- Customer testimonials that describe results without substantiation or omit details of discounts, free services, or referral fees
- Creator partnerships with inconsistent disclosure across campaigns due to individual self-policing
Each of these can be rectified with a written disclosure standard, pre-publication review, and a single owner accountable for the program, removing creative judgment calls from individual posters.
See How Leading Teams Build Predictable Pipeline with Coordinated Social Campaigns
Request a walkthrough of unified AI-powered campaign execution—learn how enterprise brands and agencies streamline approvals, automate publishing, and measure impact across all social channels without increasing headcount.
If You Manage Multiple Locations: The Consolidation Worksheet
This section targets marketing VPs at multi-location service operators—such as a dental group with 20 practices, a behavioral health network across three states, a regional law firm with eight offices, or a home services franchise with 40 locations. At this scale, the economics of social execution differ significantly, making the consolidation question highly relevant.
The default model for multi-location social is often fragmented: either each location manages its own posting (leading to uneven quality and no shared measurement), a central team produces generic content (lacking local relevance and weak conversion), or various agencies and freelancers cover different regions (resulting in briefing overhead that scales with location count). Deloitte's CMO Survey highlights the budget pressure marketing leaders face to prove the value of digital investments 6, making fragmented spend a prime target for scrutiny.
The following worksheet uses variables to illustrate how each model scales with location count.
| Variable | Fragmented Vendor Model | Consolidated Approval-Loop Model |
|---|---|---|
| Monthly vendor or contractor cost per location | V × L | Fixed platform cost, independent of L |
| Briefing hours per week (internal team) | B × L | B (shared brief, ranked across locations) |
| Approval lag per asset (days) | 3–10 (multi-party review) | 1–2 (single approval queue) |
| Content output per month per location | Capped by vendor capacity | Capped by approval throughput, not production |
| Measurement view | Per-vendor dashboards, manual rollup | One pipeline view across L locations |
| Disclosure and compliance review | Per-vendor, inconsistent | One standard applied across L |
Here:
L : represents location count
V : is the vendor retainer per location
B : is briefing hours per location per week
The fragmented model's costs and time variables scale linearly with L. In contrast, the consolidated model keeps most variables flat or nearly flat as L increases.
This is not theoretical. A 12-location operator paying $2,500 per location for social-only retainers and spending three internal briefing hours per location weekly incurs $30,000 in monthly external costs and 36 hours of weekly internal coordination before any post drives buyer action. The same operator using consolidated execution under one approval loop pays a fixed platform cost, runs a single shared briefing arc, and gains a unified attribution view instead of 12 unreconciled PDF reports.
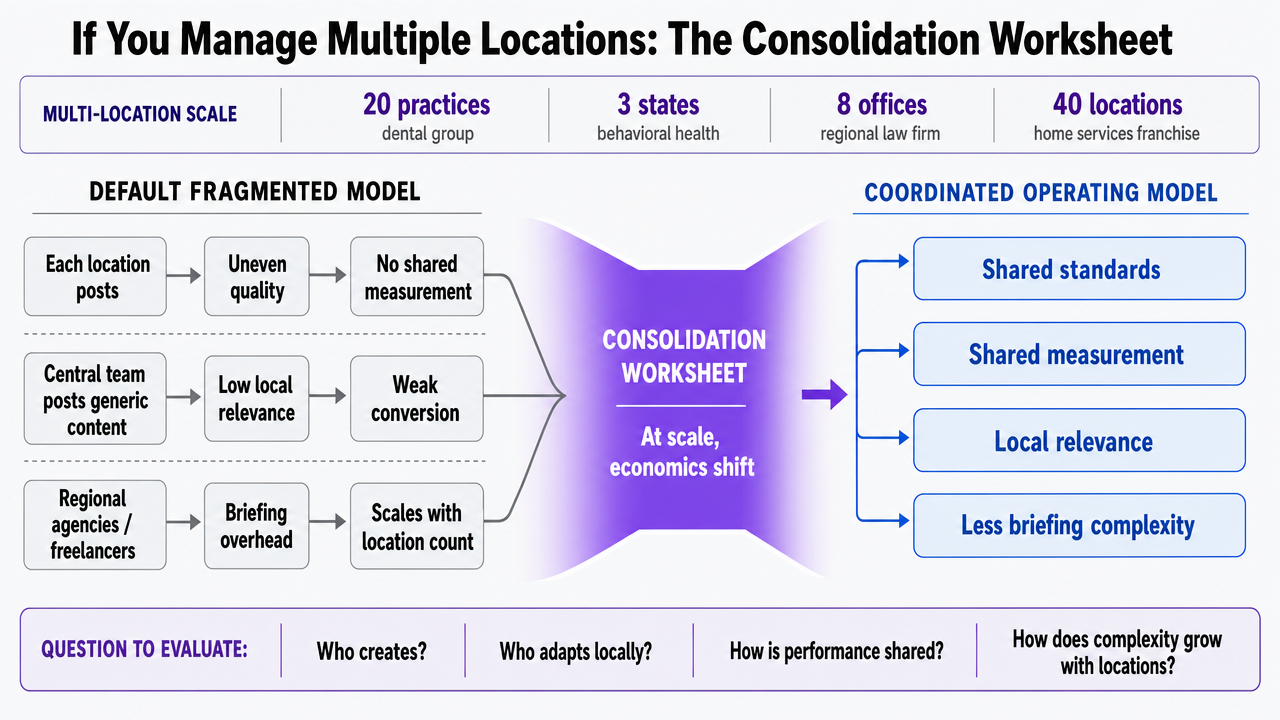 Visualize the fragmented vs. consolidated operating model comparison from the section's worksheet table, making the scaling economics legible at a glance
What Changes When Execution Lives in One Approval Loop
The immediate change is increased velocity. The more profound change is the nature of team discussions.
When social, content, search, and paid execution are managed under a single approval queue with one ranked plan, daily conversations shift from briefs, status updates, and vendor ownership to which buyer questions to address next, which post-click signals showed movement last week, and which accounts demonstrated pipeline-stage progression from exposed campaigns 10. This is the essential conversation for a pipeline-accountable program, but many teams never reach it due to overwhelming coordination overhead.
Three operational shifts result:
- Approval lag dramatically shortens from days to hours because review occurs in a single queue, not across multiple vendor email threads.
- Measurement consolidates into a unified pipeline view, ending recurring disputes over dashboard accuracy.
- Disclosure standards are applied uniformly across employee posts, customer testimonials, and creator partnerships, as a single owner enforces them instead of relying on individual vendor self-policing 3.
The headcount equation also changes. McKinsey's B2B growth analysis found that companies expanding market share by over 10% annually operate digital channels as an integrated motion, not parallel programs 5. Achieving this level of integration traditionally required a much larger internal team or a costly primary agency relationship. An approval-loop model, where AI assists with ranking, drafting, and execution after human sign-off, enables mid-sized marketing teams to achieve this integrated motion without the headcount increases demanded by older models. Vectoron is designed around this efficient loop.
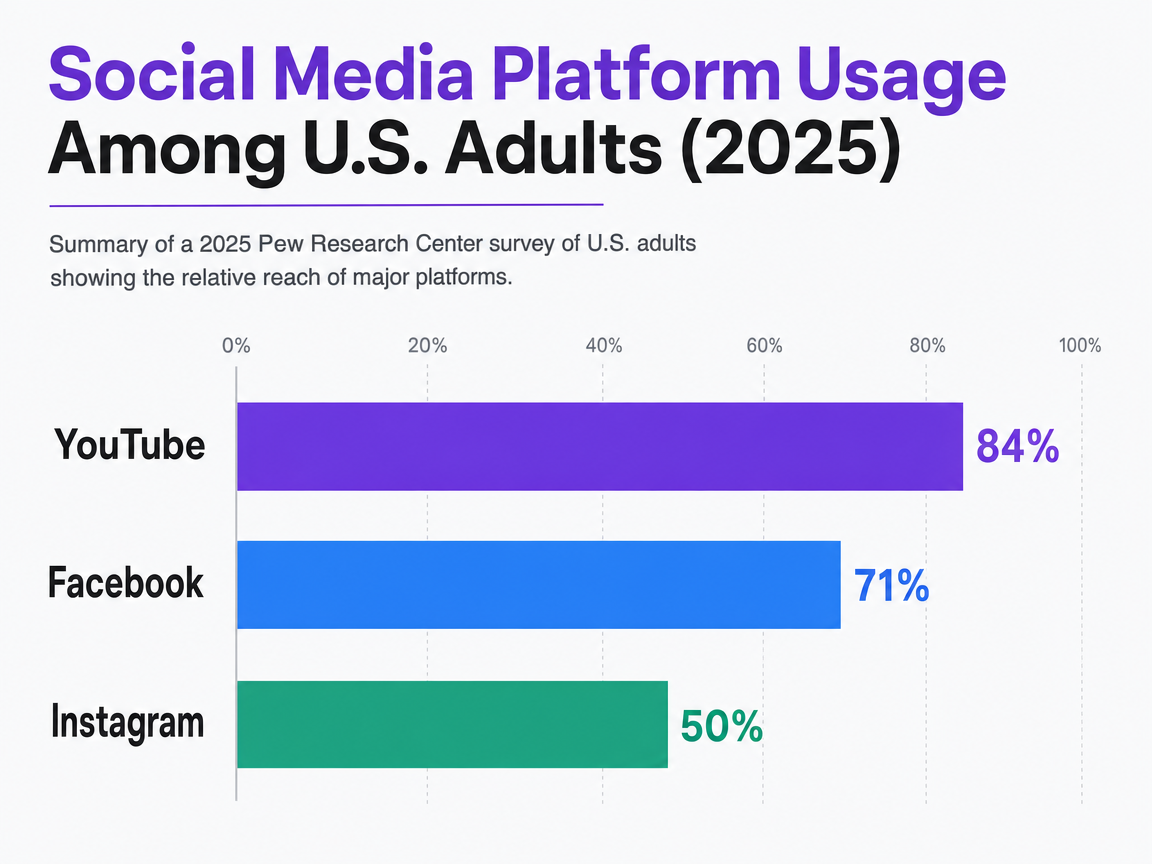 Social Media Platform Usage Among U.S. Adults (2025)
Breakdown of the most widely used social media platforms by U.S. adults, according to a 2025 Pew Research Center survey. Shows the relative reach of major platforms.
Frequently Asked Questions
References
- 1.Americans' Social Media Use 2025 | Pew Research Center.
- 2.Social Media and News Fact Sheet | Pew Research Center.
- 3.Disclosures 101 for Social Media Influencers.
- 4.FTC Publishes Final Guides Governing Endorsements, Testimonials.
- 5.The multiplier effect: How B2B winners grow.
- 6.2026 CMO Survey | Deloitte US.
- 7.2024 Media and Entertainment Industry Outlook.
- 8.2024 Media and Entertainment Industry Outlook.
- 9.Social Media Takes Center Stage In B2B Buying — Even In The AI Era.
- 10.Five Tips for Using Social Media in B2B Demand Creation.
- 11.A Social Take On Social Selling.