
Key Takeaways
- Modern Google Ads performance depends on signal engineering—feeding clean conversion data into Smart Bidding—rather than campaign craft, since the auction now automates most manual levers.
- Replace quarterly sprints with four nested loops: daily breakage checks, weekly waste reduction, monthly structural decisions, and quarterly resets of account structure and measurement architecture 3.
- Conversion signal quality is the lead lever; build a stack of enhanced conversions, offline imports, value-based inputs, and exclusion lists so the bidding model learns from real outcomes 2.
- Once account count exceeds what one analyst can review weekly without dropping a loop, consolidating the diagnostic layer preserves cadence while keeping approval and strategy with the human operator.
From Campaign Craft to Signal Engineering
The defining work of a Google Ads operator has shifted. Building campaigns, writing ad copy, and structuring keyword groups used to fill the week. Those tasks now occupy a smaller share of the calendar than the work that determines whether the account performs at all: feeding clean conversion data into the bidding system, identifying which queries and audiences are draining budget, and running enough structured tests to keep the auction model learning.
This is signal engineering, not campaign craft. The auction has already automated most of the levers a manual operator used to pull. Bid adjustments, query matching, asset rotation, and placement decisions run on machine learning models that respond to whatever conversion and value data the account sends them. The account performs at the level of its inputs, not at the level of its builder's experience.
Two operational consequences follow. First, the gap between top-quartile and median accounts is no longer explained by who writes better ads. It is explained by who maintains higher-fidelity conversion signals and who runs a faster optimization cadence. Public-sector and clinical paid media guidance has reinforced this for years: launch is the start of the work, and advertisers must monitor and prepare to optimize on a continuous schedule 3. Second, headcount-constrained teams cannot match that cadence with weekly analyst reviews alone. The rest of this article describes the operating model that does.
The Continuous Management Cadence That Replaces Quarterly Sprints
Daily, Weekly, Monthly, and Quarterly Signal Loops
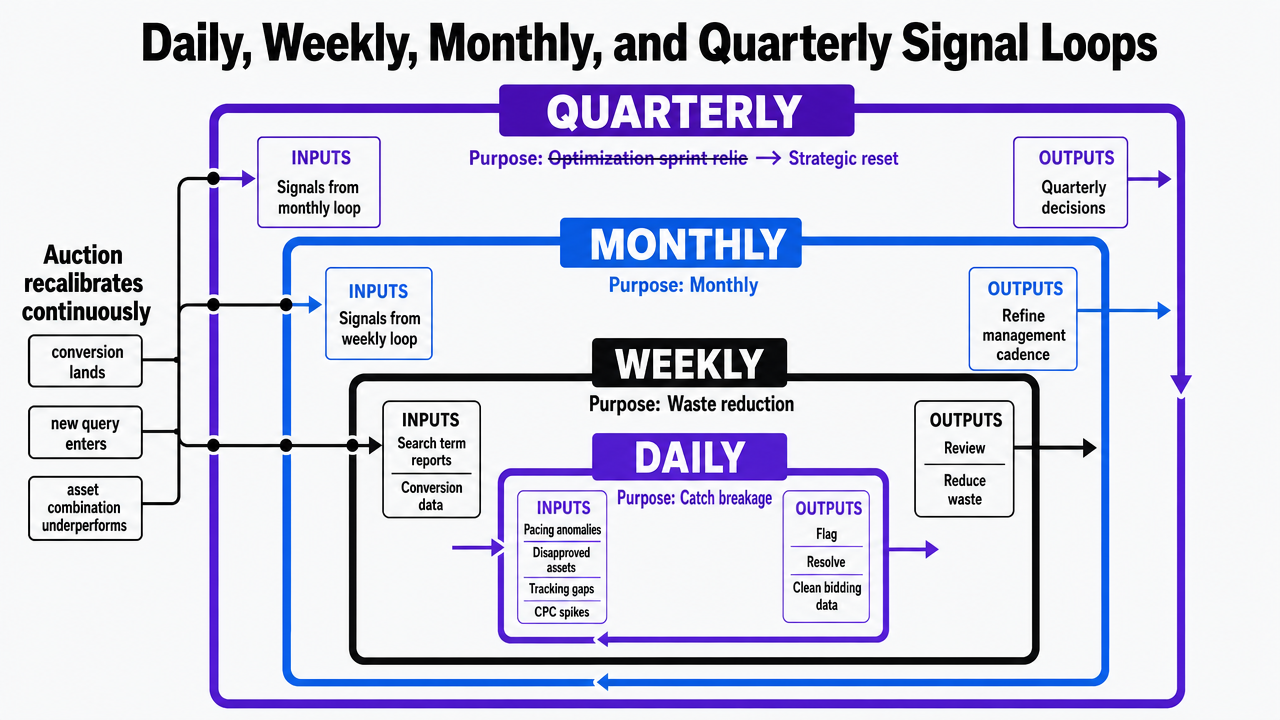
The quarterly optimization sprint is a relic of an account model where humans set bids and the auction held still between reviews. Neither condition holds now. The auction recalibrates every time a conversion lands, a new query enters the system, or an asset combination underperforms. A management cadence that matches that reality runs on four nested loops, each with a defined input set and a defined output.
The daily loop is narrow on purpose. It exists to catch breakage, not to optimize. Pacing anomalies, disapproved assets, conversion tracking gaps, and sudden CPC spikes get flagged and resolved before they distort a week of bidding data. Demand gen teams that skip this loop spend Friday reconstructing what went wrong on Tuesday.
The weekly loop is where waste reduction happens. Search term reports get reviewed against conversion data. Negative keyword lists get updated. Geo and device performance deltas get translated into bid modifiers or audience exclusions. Asset-level diagnostics surface which headlines and descriptions are dragging responsive search ad performance. Public-sector paid media guidance has formalized this rhythm for years, framing campaign launch as the start of the work and instructing advertisers to monitor and prepare to optimize on a recurring schedule, tracking clicks and engagements to inform creative and targeting adjustments 3.
The monthly loop is for structural decisions. Budget reallocation across campaigns, bid strategy changes, audience signal refreshes, and landing page experiments tied to underperforming ad groups. This is also when conversion value inputs get audited against downstream revenue or qualified lead data.
The quarterly loop is reserved for what should change about the operating model itself: account structure, attribution windows, measurement architecture, and which tests graduate from experiment to default. Teams that compress all four loops into one quarterly review are doing the work of the fourth loop and skipping the first three.
 Visualize the four nested management cadence loops described in the section, showing the inputs and outputs of each loop
Who Owns Each Loop When Headcount Is Fixed
The cadence above assumes labor that most demand gen teams do not have. A single PPC manager covering multiple accounts cannot run four nested loops by hand without surrendering either the daily breakage check or the weekly waste-reduction pass. Something gets dropped, and it is almost always the loop with the highest opportunity cost: weekly waste identification.
The practical ownership model splits the loops by decision type. Automated monitoring owns the daily loop, because pacing anomalies and disapprovals are pattern-detection problems, not judgment problems. An AI-assisted analysis layer owns the diagnostic surface of the weekly loop, generating ranked waste candidates and test hypotheses from search term, geo, device, audience, and asset data. The human operator owns the approval call on what gets paused, excluded, or bid-modified, plus full ownership of the monthly and quarterly loops where structural and strategic judgment matters.
Splitting ownership this way changes the headcount math. One analyst can run a meaningful weekly cadence across several accounts when the diagnostic work is pre-built and the human contribution is decision review rather than data assembly.
Conversion Signal Quality Is the Lead Lever
Why Smart Bidding Performance Tracks the Inputs, Not the Algorithm
Smart Bidding is often treated as a black box that either works or does not. The framing is wrong. The bidding model is a constant; the conversion data feeding it is the variable. Accounts on identical bid strategies, in identical verticals, with identical budgets, produce wildly different results based on what the account counts as a conversion and how reliably that signal arrives.
Three failure modes recur:
- The first is conversion inflation: counting form fills, newsletter signups, and PDF downloads alongside qualified leads, then asking Target CPA to optimize toward a number that averages high-value and low-value events. The model dutifully buys more of both.
- The second is signal latency: offline qualification happens days after the click, and the conversion never makes it back into the account, so the model never learns which keywords and audiences produced revenue versus noise.
- The third is value flattening: every conversion gets counted as worth the same dollar, even when downstream pipeline data shows a 10x range in deal size.
Each failure is a data problem, not a bidding problem. The AMA's digital strategies guidance frames the discipline directly: SEM requires dedicated landing pages and tracked conversion paths, not just keyword and copy work, because conversion architecture is what makes the rest of the account legible to the auction 2. Operators who fix the inputs typically see bidding performance improve without changing a single bid setting.
The Signal Stack: Offline Imports, Enhanced Conversions, and Value-Based Inputs
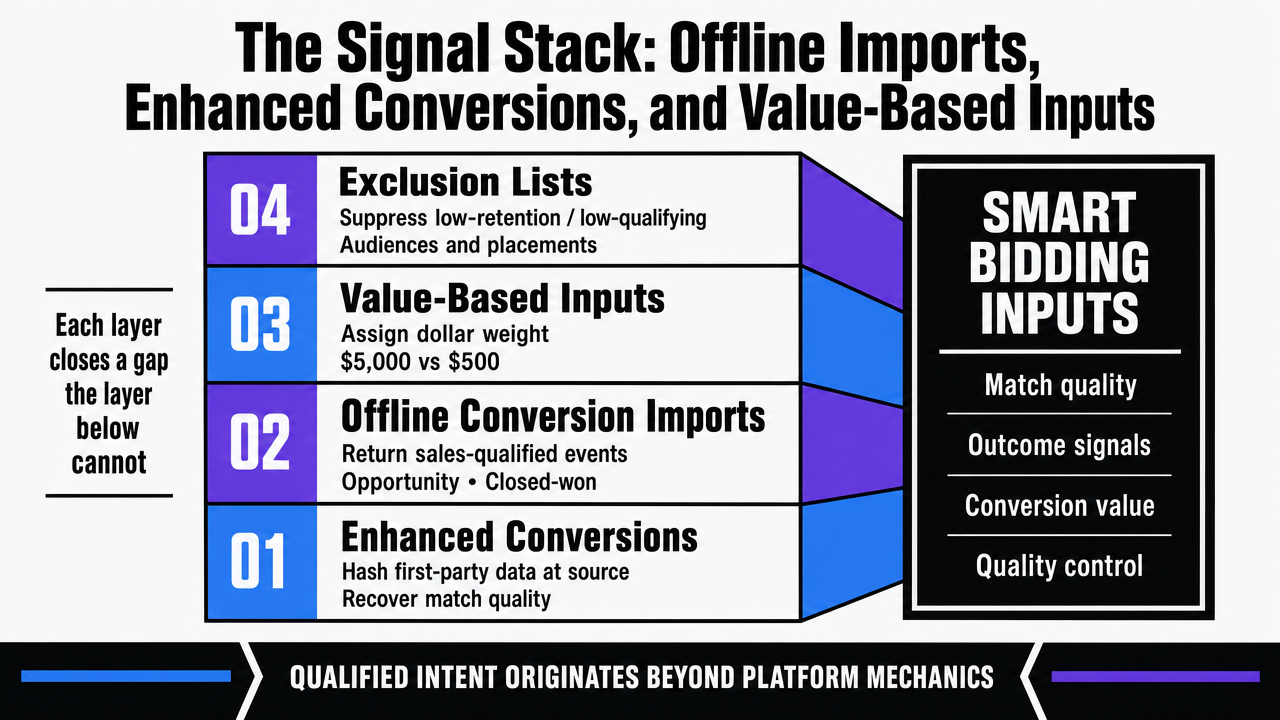
A modern signal stack has four layers, each one closing a gap the layer below cannot:
- Enhanced conversions form the base, recovering match quality lost to browser restrictions by hashing first-party data at the source.
- Offline conversion imports sit above that, returning sales-qualified, opportunity, and closed-won events to the account so the model learns from outcomes rather than form submissions.
- Value-based inputs come next, assigning a dollar weight to each conversion so the bidding strategy can distinguish a 5,000 dollar deal from a 500 dollar one.
- Exclusion lists complete the stack, suppressing audiences and placements that historically convert but do not retain or qualify.
The reason this stack matters has nothing to do with platform mechanics and everything to do with where qualified intent originates. A peer-reviewed systematic review of online health information seeking behavior found that 83 percent of consumers begin their research at a general search engine such as Google 5. Better inputs sharpen targeting on the channel where high-intent research begins.
McKinsey's analysis of orchestrated health-media journeys reinforces the consequence: relevance and personalization depend on data architecture more than on creative execution 9. The signal stack is the architecture. Accounts that build all four layers feed the auction a coherent picture of value. Accounts that build one or two leave the model guessing, then blame the algorithm.
 Visualize the four-layer signal stack described in the section, showing what each layer contributes to Smart Bidding inputs
Test Autonomous PPC Optimization in Real Time
Experience data-driven campaign improvements and publish live optimizations with full access for seven days.
Wasted Spend Identification as a Named Workflow
The Five Inputs: Search Terms, Geo, Device, Audiences, Assets
Most accounts treat waste reduction as a vague optimization goal: somewhere in the spend, money is leaking, and someone will find it during the next review. That framing produces the predictable outcome. Waste compounds because the work has no named inputs and no scheduled owner. A modern workflow defines both.
Five data surfaces produce nearly all identifiable waste in a Google Ads account:
- Search term reports surface query-level mismatch: branded queries cannibalizing organic clicks, broad match drift into unqualified intent, and competitor terms that convert at a fraction of the rate the bid implies.
- Geo performance deltas surface markets where conversion rate or value diverges sharply from account averages, often because service availability, pricing, or competitive density varies by region.
- Device performance deltas separate the queries that convert on desktop research sessions from the mobile clicks that bounce.
- Audience signals surface the segments where Smart Bidding overspends because in-market or affinity overlap is inflating predicted intent.
- Asset-level diagnostics surface the headlines, descriptions, and image assets that drag responsive search ad and Performance Max combinations below account baselines.
Each surface has a defined output. Search terms produce negative keyword additions and match-type corrections. Geo and device data produce bid modifiers, audience exclusions, or campaign-level budget shifts. Audience analysis produces exclusion lists and signal refreshes. Asset diagnostics produce rotation decisions or replacement briefs. The AMA's digital strategies guidance frames this discipline as inseparable from the upstream work of keyword research and landing page alignment: SEM performance depends on the coherence between query, ad, and destination, which is exactly what these five surfaces audit on a recurring basis 2. The workflow exists to keep that coherence from drifting between reviews.
From Diagnosis to Reallocation Within the Same Week
Identifying waste does not reduce it. Reallocation does. The gap between the two is where most weekly reviews fail: diagnostics get logged, recommendations get queued, and the budget that should have moved sits in the same underperforming ad group until the next sprint. A workflow built for reallocation closes the loop inside the same week the signals are read.
The mechanics are straightforward. Negative keyword additions and audience exclusions ship immediately because they remove cost without requiring approval on where to redeploy it. Bid modifiers and budget shifts follow within forty-eight hours, sized to the conversion volume that justifies the change rather than the size of the observed delta. Asset replacements move into the test queue described in the next section, not into the live account on the same day, because creative changes need controlled comparison.
Public-sector paid media guidance frames this as the operating expectation: campaigns must be monitored and prepared for optimization on a continuous schedule, with engagement and click data feeding adjustments rather than waiting for a quarterly read 3. Teams that compress diagnosis and reallocation into the same week recover spend while the auction still has time to learn from the change. Teams that separate the two by a month or more donate the difference to whichever competitor is running the faster loop.
Structured Testing Without Daily Human Triage
Testing breaks down for the same reason waste reduction breaks down: there is no defined queue, no defined exit criteria, and no separation between live account changes and controlled experiments. Ad copy gets swapped on a Tuesday because someone had an idea, landing pages get tweaked because a stakeholder asked, and the account loses the ability to attribute any performance change to any specific decision. The fix is a test pipeline that runs without daily human triage.
A working pipeline has three states:
- Hypotheses sit in a backlog ranked by expected impact and signal volume required to reach significance.
- Active tests run with predefined start dates, traffic allocation, and exit thresholds.
- Graduated tests either replace the control as the new default or get archived with a one-line note on why they failed.
The human contribution is hypothesis quality and graduation decisions. Everything between launch and read should run on schedule.
Two test categories carry most of the weight. Creative tests compare responsive search ad variants, image and headline combinations in Performance Max, and landing page layouts against held-out controls. Audience and structure tests compare bid strategies, audience signal sets, and campaign segmentation choices using account-level holdout or geo-split designs. McKinsey's analysis of orchestrated consumer journeys reinforces why this matters: relevance compounds when content and targeting decisions are tested against evidence rather than inherited from last quarter's brief 9. Accounts that ship one structured test per week accumulate compounding lifts. Accounts that ship ad-hoc changes accumulate noise.
Compliance and Measurement Architecture in One Place
Signal quality and regulatory exposure are the same problem viewed from two angles. The data architecture that feeds Smart Bidding is also the data architecture that determines whether an account is collecting, transmitting, or targeting on information it should not be. Treating compliance as a legal afterthought rather than a measurement design choice is how accounts end up with both weaker bidding performance and unmanaged risk.
Three obligations shape the architecture for regulated verticals. The HIPAA Privacy Rule protects all individually identifiable health information held or transmitted by covered entities and their business associates, in any form or medium, which sets a hard boundary on what can be passed back to Google as a conversion identifier, audience signal, or remarketing list 6. The FTC's interactive guidance on health apps and connected tools confirms that multiple federal frameworks can apply simultaneously depending on how data is collected and shared, including the FTC Act and breach-notification rules that reach beyond covered entities 4. McKinsey's analysis of consumer data and privacy regulation describes the broader trajectory: consumers now expect access to their data and the right to request deletion, and companies that handle data responsibly are the ones building durable measurement systems rather than fragile ones 10.
The operational translation is specific. Enhanced conversions ship hashed first-party data, not raw PHI. Offline conversion imports pass internal identifiers tied to qualified-lead status, not diagnosis or treatment detail. Audience lists exclude any segment built from protected categories. Server-side tagging concentrates the data flow into one auditable point rather than a sprawl of client-side pixels. A peer-reviewed public health analysis of search engine marketing has flagged the parallel risk that paid placements can surface commercially motivated or scientifically unsupported claims, which is why ad copy substantiation belongs in the same review cycle as data handling 8. One architecture, one review, one owner. Compliance work that lives outside the measurement system gets skipped; compliance work built into the signal stack runs every time the stack runs.
See How Autonomous PPC Management Reduces Wasted Ad Spend—Continuously
Request a walkthrough of AI-driven Google Ads management, including real account examples of automated waste detection, test scheduling, and unified reporting for multi-brand and multi-location teams.
If You Manage Multiple Locations: Operator Economics
The audience shifts here. The preceding sections describe the operating model for a single account. The math changes when one demand gen team is accountable for ten, thirty, or a hundred location-level accounts under a parent program. Multi-location operators face a different constraint: the cadence described earlier does not scale linearly with analyst headcount, and the gap between what each account needs and what a fixed team can deliver widens with every site added.
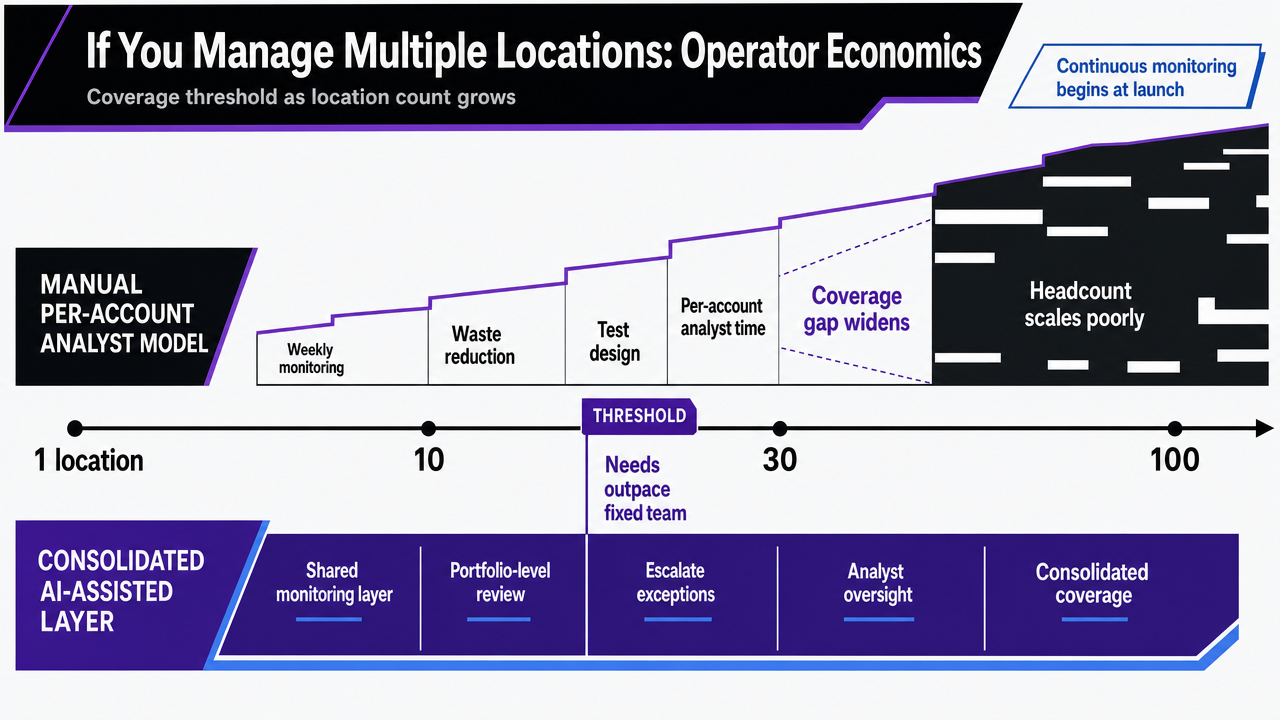
Public-sector paid media guidance frames campaign management as an iterative process of continuous monitoring and optimization that begins, not ends, at launch 3. Applied to a portfolio, that framing produces a labor problem. If a weekly waste-reduction and test-design pass takes an analyst two to four hours per account when done properly, a thirty-location operator needs sixty to one hundred twenty analyst hours per week before any monthly or quarterly work begins. The headcount math forces a choice: hire to cover the cadence, accept that most accounts get reviewed monthly at best, or consolidate the diagnostic layer.
The table below compares the two structural paths using variables, since loaded hourly rates and analyst productivity differ by team. The only fixed dollar anchor is the post-trial price of an account-level AI-assisted analysis layer.
| Input | Manual per-account analyst model | Consolidated account-level AI-assisted layer |
|---|---|---|
| Weekly analyst hours required | H hours per location × N locations | Decision-review hours only (fraction of H × N) |
| Weekly cost | H × N × loaded hourly rate | Decision-review hours × loaded hourly rate |
| Monthly platform cost | $0 (labor only) | $599 (Vectoron post-trial), account-level |
| Coverage as N grows | Degrades; loops get skipped | Constant; diagnostic surface scales with data |
| Cadence integrity | Drops to monthly or quarterly under load | Weekly waste and test loops maintained |
The crossover point is not a dollar figure; it is a coverage threshold. Once N exceeds the number of accounts a single analyst can review weekly without dropping a loop, the manual model stops producing weekly cadence regardless of how the spreadsheet adds up. Consolidating the diagnostic layer keeps the cadence intact and reserves analyst hours for the judgment work the loops were designed to surface.
 Visualize the comparison between the manual per-account analyst model and the consolidated AI-assisted layer as the location count grows, reinforcing the coverage-threshold concept
Where AI-Assisted Analysis Earns Its Slot in the Stack
AI-assisted analysis does not earn a slot by promising to replace the operator. It earns the slot by absorbing the diagnostic work that humans cannot run at weekly cadence across a portfolio: ranking search-term waste candidates, surfacing geo and device deltas worth acting on, flagging asset combinations that drag responsive search ad performance, and proposing test hypotheses with the signal volume each one needs to read.
The boundary matters. Approval on what gets paused, which audience gets excluded, and which test graduates stays with the human operator. Strategic decisions about account structure, attribution windows, and budget allocation across service lines stay with the human operator. The machine handles pattern detection at volume; the operator handles judgment calls that carry business consequence. McKinsey's analysis of data-driven health journeys describes the same division: durable performance depends on architecture and content capabilities that scale, paired with human governance of how those capabilities are deployed 9.
The slot is justified when the diagnostic layer produces ranked, decision-ready outputs faster than an analyst can assemble them, and when the cadence holds as the account count grows. Anything less is software replacing a spreadsheet, not analysis earning a place in the stack.
Frequently Asked Questions
References
- 1.Digital Marketing for Private Practice: How to Attract New Patients.
- 2.A Guide to Advanced Digital Strategies.
- 3.Tips on Implementing a Digital Paid Media Campaign.
- 4.Mobile Health App Interactive Tool.
- 5.Online Health Information Seeking Behavior: A Systematic Review.
- 6.Summary of the HIPAA Privacy Rule.
- 7.The cost-effectiveness of digital health interventions: A systematic review of economic evaluations.
- 8.The Public Health Perils of Search Engine Marketing - PMC.
- 9.Health media: How consumer content informs the future of healthcare.
- 10.The consumer-data opportunity and the privacy imperative.