
Key Takeaways
- Demand revenue attribution architecture that stitches organic touchpoints to CRM opportunity records, not a reporting UI that stops at sessions and goal completions 20.
- Require payback-window forecasting that plots cumulative cost against organic revenue and timestamps the crossover month, anchored against a roughly seven-month B2B SaaS break-even 8.
- Measure analyst leverage through accounts-per-strategist and reporting hours saved, since hours redirected to higher-value work are what justify platform cost on agency margin 18.
- Filter shortlists for AI-search readiness, including citation tracking across generative engines inside the same attribution model, given only 16% of brands track this today 5.
- Replace rankings and sessions with revenue-per-visit, share of value in the SERP, and pipeline-influenced revenue so the dashboard reports contribution rather than effort 13.
- Run a 90-minute payback-window test on a live account, checking cost inputs, CRM-based revenue inputs, crossover timestamp, and sensitivity flex before signing any contract 1.
- Model tool-stack-only versus integrated execution delivery across the portfolio, since margin leaks through reporting assembly, QA on junior work, and unbilled attribution requests 9.
The ROI proof gap most SEO software still refuses to close
Most SEO platforms still report what is easy to measure rather than what is worth measuring. Rankings, sessions, and conversion counts dominate professional dashboards even though Search Engine Journal's review of practitioner reporting habits found these are precisely the metrics that fail to map to stakeholder business outcomes 12. Forrester's B2B measurement research reaches the same conclusion from the buyer side: marketers continue to struggle to connect activity to revenue despite years of tool investment, citing fragmented data, inconsistent KPIs, and analytics that sit unused 4.
That gap is the real selection problem for an agency head of SEO. A tool that produces a polished site audit but cannot answer "what organic revenue did this account generate last quarter, and when does it pay back?" is not professional software. It is a reporting layer that pushes proof-of-value work back onto strategists who are already the constraint on margin.
The benchmark for what "proof" should look like has also moved. Forrester-style TEI analyses now quantify cost, benefit, flexibility, and risk for adjacent martech categories with explicit payback windows and three-year ROI figures 2, 3. CFOs reviewing agency invoices have seen those models. They expect comparable rigor from organic search.
This guide reframes SEO software selection around four criteria that actually predict whether a platform will close that proof gap on a client P&L: revenue attribution architecture, payback-window forecasting, analyst leverage, and AI-search readiness. Tools that cannot model these four will keep producing dashboards no one acts on, regardless of crawl depth or keyword database size.
Four buying criteria that separate revenue tools from cost centers
Revenue attribution architecture, not reporting UI
The first question to ask any SEO vendor in a demo is not what the dashboards look like. It is what data model sits underneath them. A reporting layer that reads from Google Search Console and GA4 alone can show organic sessions and goal completions. It cannot show which closed deals were influenced by which queries, which content assets accelerated which opportunities, or how organic-sourced customers compare to paid-sourced customers on lifetime value.
The Dreamdata framework for B2B content ROI sets the floor for what an attribution architecture has to do. First-party web data is captured and stored in an environment the agency or client controls, such as a data warehouse or customer data platform. Anonymous visitor IDs are stitched to known leads at the point of form fill, then joined to CRM contact and account records. Revenue is then attached using multiple revenue models, including first purchase, first-year contract value, and lifetime value, and run through more than one attribution model so practitioners can stress-test conclusions 20.
Professional SEO software does not have to own every layer of that stack. It does have to plug into it cleanly. Tools that cannot read CRM stage data, cannot push organic touchpoints into a warehouse, and cannot reconcile sessions against opportunity records will produce reports that stop at the conversion event. That is the exact gap Forrester flagged across B2B measurement programs, where fragmented data and inconsistent KPIs leave analytics underutilized despite continued tool spend 4.
For an agency head of SEO, the practical test is short. Ask the vendor to draw the path from an organic impression to a closed-won record in the client's CRM. If the diagram requires manual spreadsheet exports or hand-keyed UTM reconciliation, the tool is a reporting UI, not an attribution architecture. The downstream consequence is that strategists, not software, end up assembling the ROI story for every client review.
Payback-window forecasting as a tool requirement
A platform that reports lagging performance is useful for renewals. A platform that forecasts a payback window is useful for sales conversations and account business reviews. The distinction matters because clients and CFOs do not ask whether organic traffic grew. They ask when the retainer pays for itself.
The benchmarks for what a credible forecast looks like already exist. Industry analysis of B2B SaaS performance puts average SEO ROI at roughly 702%, with a break-even time of about seven months 8. That figure carries scope limits worth stating in the same breath: it reflects SaaS verticals with measurable digital conversion paths, not heavily offline industries or accounts in their first quarter of work. Even so, it gives an agency head a concrete anchor. Any tool's payback projection should land within a defensible distance of that seven-month break-even for comparable B2B accounts, or explain why a specific client profile diverges.
A payback-window test asks three questions of the software:
- Can it model monthly content and link investment against projected organic revenue using the client's actual conversion rate and average deal size, not a generic industry assumption?
- Can it show the cumulative cost curve crossing the cumulative revenue curve and timestamp that crossing?
- Can it run sensitivity analysis when the client wants to flex spend up or down?
Most tools cannot do this without a separate spreadsheet layer maintained by the strategist. That is the symptom of a category problem. SEO platforms were built to audit and report, not to forecast economic impact in the format CFOs already see from adjacent martech buys. Tools that produce only retrospective dashboards push the forecasting work onto humans and make payback the agency's problem to prove, not the software's job to model.
Analyst leverage and output per FTE
The third criterion is the one that determines agency gross margin: how much qualified output a strategist can ship per week without rework. Tools that produce raw data exports without prioritization eat analyst hours. Tools that surface ranked recommendations, draft change orders, and prepare client-facing narratives compress the same workload into a fraction of the time.
The Forrester TEI study of Glean's work AI platform reported a 141% three-year ROI driven largely by productivity gains and time redirected to higher-value work 18. The relevance for SEO software selection is not the specific percentage. It is the structural argument: AI platforms now justify their cost by quantifying hours returned to billable or strategic activity. SEO platforms that do not measure analyst time saved on technical audits, content briefs, internal linking decisions, and reporting are skipping the line item that most directly governs agency margin per retainer.
Output per FTE has a simple operational definition. How many active accounts can a senior strategist run without quality degradation? How many hours per account per month go to reporting and QA versus strategy? How long does a junior analyst take to produce a defensible site audit and content brief? These metrics should improve measurably within the first two quarters of adopting a new platform. If they do not, the tool is a software subscription added on top of existing labor cost rather than a substitution.
The marketing analytics research that found 49% faster growth from unified data and revenue-connected KPIs makes the same point from the growth side: integration and prioritization, not raw data volume, drive the outcome 9. For agencies, that translates to accounts-per-strategist as a leading indicator of whether the tool is earning its seat.
AI-search readiness as the new measurement frontier
Generative engines have moved from a curiosity to a discovery surface that buyers use during active research, and the measurement layer has not kept up. McKinsey's analysis of AI-driven search found that only 16% of brands systematically track their performance in AI search today, even as that channel is projected to influence hundreds of billions in revenue 5. The scope of that figure matters: McKinsey surveyed brand-level practices, not every site or vertical, and the gap reflects organizational tracking discipline rather than total measurement impossibility.
For an agency head, the 84% who do not track AI-search performance is not a statistic. It is a wedge. Clients are already asking whether their pages appear in generative answers from large language model assistants and AI overviews. The agency that can show a baseline, attribute branded and non-branded mention share, and report changes against editorial work has a defensible answer. The agency that cannot is left explaining why a category their client can see in real time is absent from the monthly report.
Software shortlists should be filtered against three AI-search capabilities:
- The platform should track citation and mention frequency across the dominant generative engines, not just rank position in classical SERPs.
- It should map which content assets are being cited and which are being passed over, so editorial priorities can shift.
- It should report changes over time at the account level, so the agency can show movement, not a one-time audit.
Tools that bolt on a single AI-overview tracker without integrating it into the same attribution model used for organic search create a parallel reporting silo. That defeats the purpose. The point of measuring AI search is to compare it against the rest of the organic channel, not to manage another standalone dashboard.
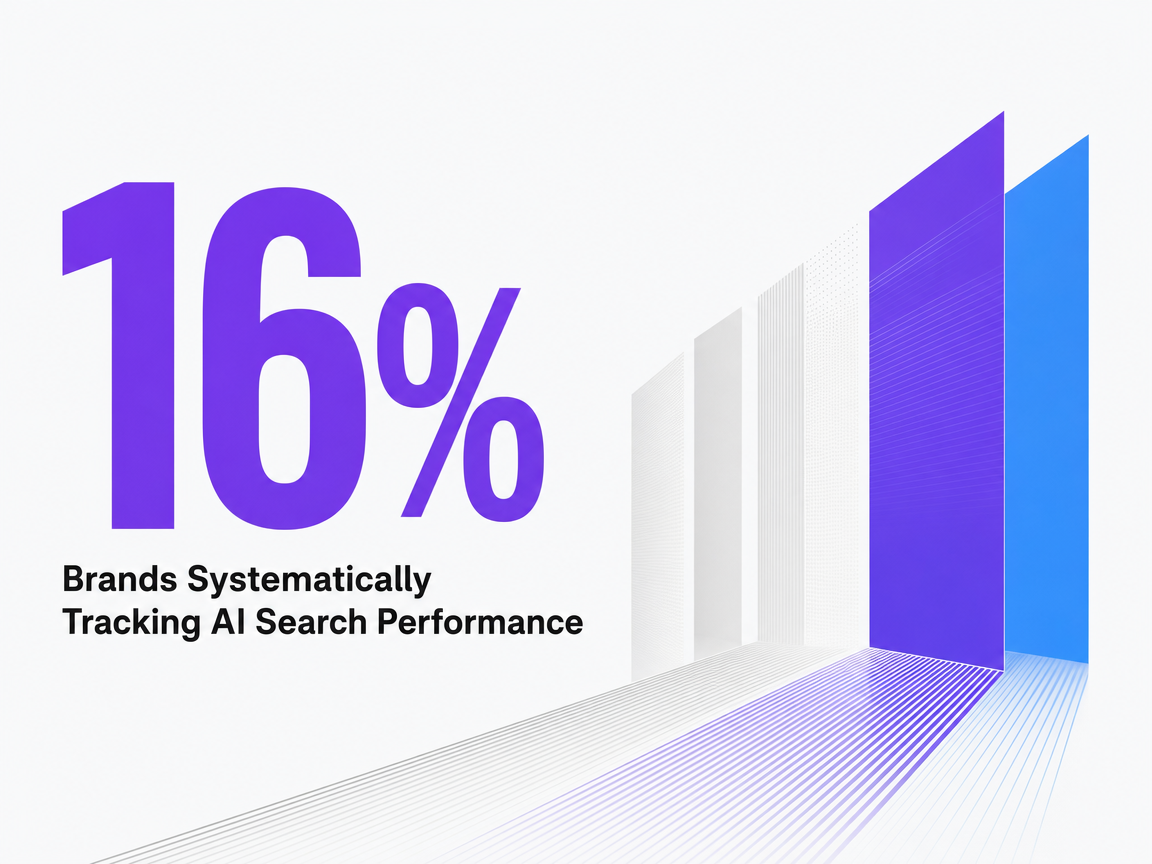 Brands Systematically Tracking AI Search Performance
Brands Systematically Tracking AI Search Performance
Test ROI-Driven SEO Software in Real Time
Evaluate live SEO performance and workflow efficiency with unrestricted access before making a commitment.
Redesigning KPIs so the software has something honest to report
The reporting layer of any SEO platform is only as honest as the KPIs feeding it. If the dashboard is built around rankings, sessions, and goal completions, it will produce a polished view of effort that says nothing about contribution. Search Engine Journal's review of practitioner habits found those three metrics dominate SEO reporting across roles, even though they often fail to map to the business outcomes stakeholders care about 12. The fix is not a prettier chart. It is a different metric set.
Three KPIs do more work than the rest:
- Revenue-per-visit ties organic traffic to economic value at the page level and exposes which templates and topics carry their weight, which Huemor identifies as a sharper indicator of SEO contribution than aggregate traffic or keyword position 15.
- Share of value in the SERP overlays visibility against commercial signals such as conversion rate, average order value, and CPC, giving strategists a defensible way to translate ranking movement into revenue impact for a client review 13.
- Pipeline-influenced and content-assisted revenue, drawn from CRM joins rather than last-click attribution, captures the long buyer journeys typical of B2B and high-stakes service verticals where the form fill is rarely the moment of decision 10.
The discipline behind this redesign matters as much as the metric list. Marketing analytics research found that organizations growing 49% faster than peers concentrate on three to five KPIs directly tied to revenue rather than tracking dozens of channel-specific indicators 9. Professional SEO software should make that compression easy: a small set of revenue-linked KPIs at the top of every account dashboard, with diagnostic metrics like crawl errors and keyword movement available underneath but never confused with proof of return.
The operational test for an agency head of SEO is whether the platform can produce, without spreadsheet work, a monthly client view that answers four questions: What revenue did organic generate? Which assets drove it? How does that compare to prior periods on a like-for-like basis? What is the projected trajectory? Software that cannot assemble that view leaves the proof work where it already lives, on the strategist's desk, and the KPI redesign never reaches the client.
Running a payback-window test on any shortlisted platform
A payback-window test is the cheapest way to disqualify a shortlisted platform before a contract is signed. The test takes one client account, real numbers, and 90 minutes with a sales engineer. The output is a defensible answer to the question every CFO asks: when does the retainer pay for itself?
Set the baseline first. FirstPageSage's benchmark report puts positive SEO ROI in a 6–12 month window, with returns peaking in year two or three of a campaign 1. That horizon reflects aggregate campaign data across verticals, so a single account may land sooner or later depending on conversion path maturity and existing domain authority. Use it as the target band the software's forecast must defend, not as a guarantee to put in a pitch deck.
Then run the platform through four checks against a live account:
- Cost curve input. Can the tool ingest the actual retainer fee, content production cost, link investment, and analyst hours for that account, or does it default to a generic SEO spend assumption?
- Revenue curve input. Can it pull the client's real conversion rate, average deal size, and sales cycle length from CRM, or does it model on industry averages that the client's controller will reject?
- Crossover timestamp. Can it plot cumulative cost against cumulative organic revenue and mark the month the curves cross, in a view a CFO can read without a strategist narrating it?
- Sensitivity flex. Can it rerun the forecast when the client cuts spend 30% or doubles content velocity, without a manual rebuild?
Any platform that fails two or more of those checks is a reporting tool with a forecast widget bolted on. The payback math will still get done. It will just get done by a strategist in a spreadsheet, on the agency's time, and that hidden labor is what quietly destroys margin per retainer across a portfolio.
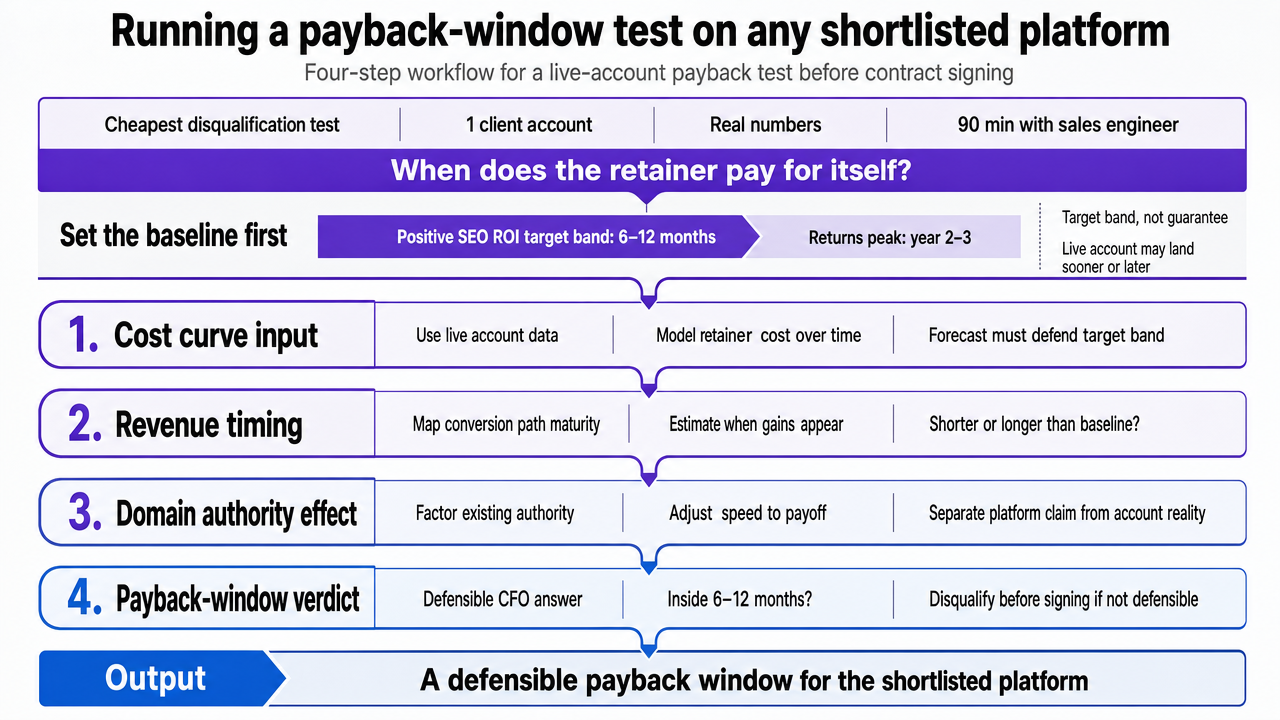 Visualize the four-step payback-window test as a sequential workflow strategists can run against any shortlisted vendor
See How Leading Agencies Quantify SEO ROI With Unified AI Workflows
Request a walkthrough of measurable, approval-first SEO delivery—designed to help agencies streamline reporting, scale execution, and attribute every action to business impact across all clients.
If you operate a multi-client portfolio: the unit economics of tool choice
Modeling tool-stack-only versus integrated execution delivery
The framing shifts here. The earlier criteria apply to any agency evaluating a single platform. This section is for heads of SEO running a book of 10 to 150 client accounts, where software choice is no longer a tooling decision but a leverage decision that shows up in gross margin per retainer and analyst utilization.
The cleanest way to think about it is as two delivery models compared against the same portfolio:
- A tool-stack-only model uses a collection of point solutions (crawler, rank tracker, content scorer, link database, GA4, CRM) stitched together by strategists who assemble the ROI narrative manually for each client review.
- An integrated execution model consolidates the attribution, prioritization, and reporting layers, then frees strategist hours for strategy and judgment rather than spreadsheet assembly.
The variables that move under each model are predictable. Use the table below as a model, not as a quoted benchmark. Populate the cost and revenue lines with your actual numbers, then anchor the timing rows against sourced expectations: a 6–12 month positive-ROI window for organic campaigns 1and a roughly seven-month break-even for B2B SaaS accounts with mature conversion paths 8.
| Variable | Tool-stack-only delivery | Integrated execution delivery |
|---|---|---|
| Active accounts per senior strategist | A | A × leverage factor |
| Hours per account per month on reporting and QA | H | H − hours returned by automation |
| Time to first defensible ROI report for a new client | 2–3 months after onboarding | Within first reporting cycle |
| Months to projected positive ROI on account | 6–12 1 | 6–12, with tighter forecast confidence 1 |
| Gross margin per retainer (avg. retainer $X − strategist fully-loaded cost $Y − tool cost $Z) | ($X − $Y − $Z₁) / $X | ($X − $Y_adj − $Z₂) / $X |
The point of the model is not the absolute numbers. It is which variables the software actually changes. Marketing analytics research found organizations growing 49% faster than peers concentrate measurement on revenue-connected KPIs rather than channel-specific dashboards 9. Applied to an agency P&L, that translates directly: a platform that compresses reporting hours and shortens time-to-first-ROI-report changes accounts-per-strategist and margin per retainer simultaneously.
Where margin actually leaks across a 10-150 account book
Margin rarely leaks where partners assume it does. The visible costs are tool subscriptions and analyst salaries. The invisible costs sit in three places that compound across the portfolio.
The first is reporting assembly. When the platform cannot produce a CFO-ready monthly view without manual work, every account absorbs strategist hours that should have gone to content prioritization or technical fixes. Multiply two extra hours per account by 60 accounts and the agency has effectively staffed a part-time analyst whose only output is formatting.
The second is QA on AI-assisted or junior-produced work. Without a single source of truth tying drafts to ranked priorities and to revenue-linked KPIs, senior strategists re-review work against a moving target. The Forrester TEI analysis of an AI work platform attributed its 141% three-year ROI primarily to hours redirected to higher-value tasks 18. The same logic applies in reverse: agencies without that compression silently pay for the redirected hours that never get redirected.
The third is scope creep on attribution requests. When a client's controller asks how organic contributed to a specific closed deal, the agency either has the architecture to answer in minutes or the strategist spends a half-day reconciling sessions, forms, and CRM stages. That hidden labor is not billed. It is absorbed into the retainer and quietly erodes the margin the portfolio was built on.
What 'SEO software' becomes next: execution-and-attribution infrastructure
The category label is lagging the work. What agencies still call "SEO software" started as crawlers and rank trackers and has grown a reporting skin, but the buying criteria above point somewhere else entirely. The next generation is execution-and-attribution infrastructure: tools that connect organic activity to closed revenue, prioritize the work a strategist would have queued by hand, and ship approved changes without a second platform to broker the handoff.
That shift mirrors what enterprise buyers already see in adjacent categories. Forrester TEI analyses of AI and analytics platforms now justify cost through hours redirected to higher-value work and payback windows under six months, with reported returns in the 141% to 542% range over three years 18, 19. The structure of those proofs, not the percentages, is what CFOs reading agency invoices have come to expect. SEO platforms that produce only audits and dashboards will be measured against that bar and found short.
For an agency head of SEO, the practical implication is straightforward. The shortlist should narrow to platforms that can model revenue contribution, compress reporting labor, and ship work under human approval. Vectoron sits in that category as one example of execution-and-attribution infrastructure built for that workflow.
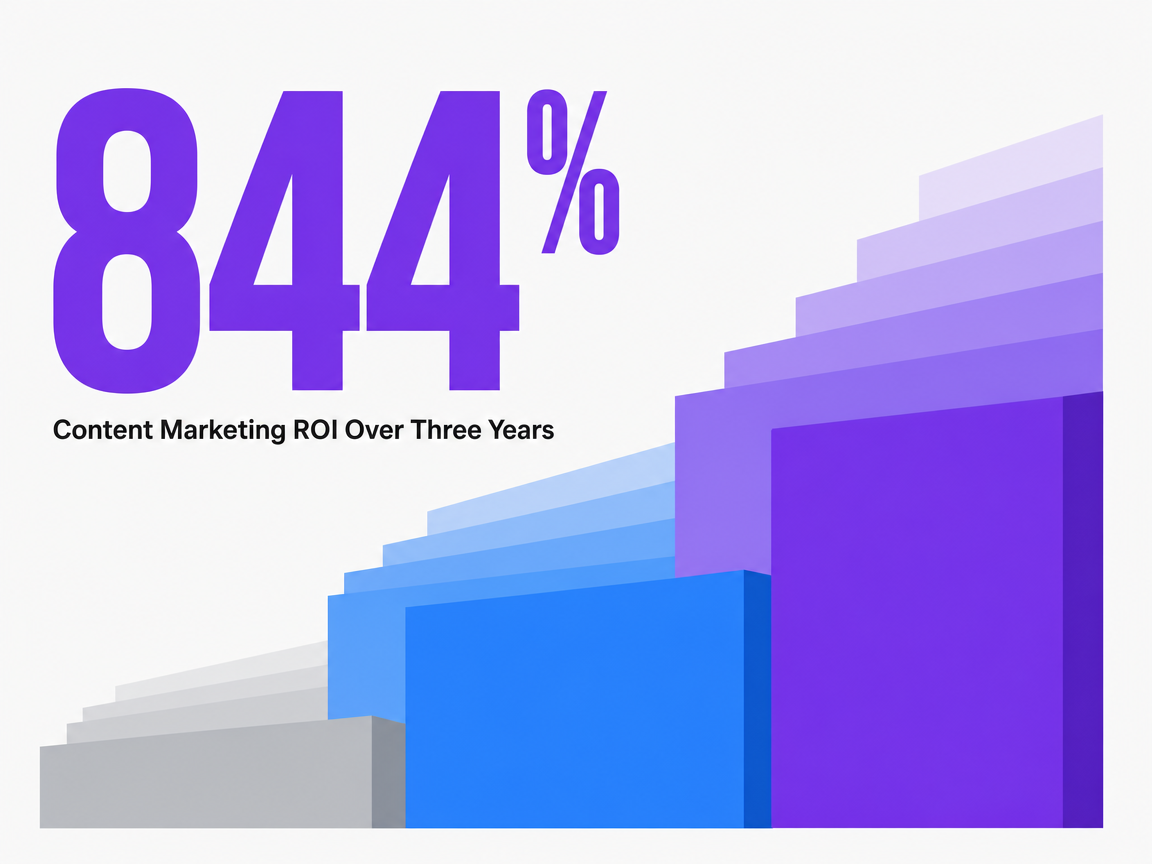 Content Marketing ROI Over Three Years
Content Marketing ROI Over Three Years
Frequently Asked Questions
References
- 1.SEO ROI Statistics 2026.
- 2.The Total Economic Impact™ Of Sitecore CMS.
- 3.The Total Economic Impact™ Of Adobe Ultimate Success.
- 4.The State of B2B Marketing Measurement In 2023: Five Key Observations.
- 5.Winning in the age of AI search.
- 6.The next frontier of personalized marketing.
- 7.B2B SEO: The Complete Guide.
- 8.60+ SaaS Marketing Statistics & Benchmarks for 2026.
- 9.5 Marketing Analytics Strategies That Drive ROI.
- 10.B2B SaaS Content Marketing for Enterprise Strategy.
- 11.B2B Marketing ROI Benchmarks: What "Good" Looks Like by Channel.
- 12.SEO ROI: How To Ensure Performance Tracking Matches Goals.
- 13.5 Actionable Ways To Improve The ROI Of Your SEO Strategy.
- 14.B2B SEO Strategy: A Damn Good Guide For 2026.
- 15.A Comprehensive B2B SEO Strategy Guide.
- 16.How To Maximize SEO ROI: Measure, Optimize & Drive Growth.
- 17.SEO ROI Statistics for 2026: Data, Benchmarks & Trends.
- 18.Forrester Study: The Total Economic Impact™ (TEI) of Glean.
- 19.Forrester TEI Study: Domino Delivers 542% ROI and Payback in 6 Months.
- 20.The (technical) recipe for measuring ROI of B2B content.
- 21.How to Measure (and Grow) Your B2B Social Media ROI.