
Key Takeaways
- Keyword-brand alignment predicts 32.5% of mention variance in AI answers, outranking brand identity and intent while domain authority fails to make the podium 1.
- Share of Answer, segmented by engine and paired with citation rate, prompt coverage, and rerun variance, replaces rank tracking as the anchor metric for client dashboards.
- Single-run reports mislead because only 30% of brands stay visible between consecutive answers, requiring at least five reruns per prompt per engine per weekly window 4.
- Roughly 85% of early-discovery mentions originate on third-party domains, so specialist hours belong on off-domain seeding inside trade coverage, comparisons, and directories, not owned content alone 4.
Why keyword-brand alignment now predicts visibility better than domain authority
The signal that used to move a client's rankings no longer moves the metric that matters. A 2026 empirical study by Keygrip collected 110,523 responses from GPT-4.1, Claude Sonnet 4.5, Gemini 2.5 Flash, and Google AI Overviews across 50 real brands and five fictitious controls, then ran a variance decomposition on what actually predicts whether a brand gets named in an answer. Keyword-brand alignment took the top slot at a marginal η² of 32.5%. Brand identity accounted for 11.2%. Intent type contributed 5.2%.1
Domain authority did not make the podium.
That reordering has direct consequences for how agency SEO leads allocate specialist hours. A backlink push that lifts Domain Rating from 62 to 68 is no longer the same investment it was three years ago, because the answer engine is not scoring the domain the way a link-graph algorithm did. It is scoring how tightly a brand's public footprint is bound to the exact language of the query — product category terms, comparison phrases, use-case verbs, geography, and buyer stage.
For a portfolio operator running 15 to 60 accounts, this shifts the optimization target from raising authority scores to engineering language overlap. The prompts a buyer types, the entities a client is associated with across the open web, and the phrasing used in third-party coverage now do more predictive work than the referring-domain count in Ahrefs.
The rest of this guide builds a measurement stack around that reality: what to track, at what cadence, against what benchmarks, and inside what governance loop.
The measurement stack that replaces rank tracking
Share of Answer as the anchor metric
Share of Answer is the percentage of relevant answers, across a defined prompt set and engine set, in which the client brand is named. It is the AI-era equivalent of share of voice, and it is the single metric that belongs at the top of every client dashboard.
The definition matters because vendors are already selling raw mention counts as a headline number. A count without a denominator is theater. Share of Answer requires three fixed variables before the metric is trustworthy: the prompt library (which questions were asked), the engine panel (which models were queried), and the rerun protocol (how many times each prompt was executed). Change any variable and the number is not comparable to last month's number.
Agency SEO leads should hold the prompt library constant for at least a quarter before rotating in new queries, and version the library the way a codebase gets versioned. When a client asks whether Share of Answer moved because of an intervention or because the prompt set changed, the answer must be in a changelog, not a memory.
The metric is engine-segmented, not averaged. GPT-4.1, Claude, Gemini, and Google AI Overviews return materially different visibility profiles across the same query set1, and a blended average hides the engine where the client is bleeding.
Citation rate, sentiment, and prompt coverage as supporting layers
Share of Answer tells the lead whether the brand was named. It does not explain why.
Citation rate sits directly underneath: the percentage of mentions that also carry a linked source attribution in the answer. This layer matters because mention-plus-citation pairs are 40% more likely to reappear across subsequent answers than mentions alone.4 A brand named without a source is a brand the engine may drop on the next rerun.
Sentiment is the third layer, and it must be scored at the mention level, not the answer level. An answer that names three competitors positively and the client neutrally is a mention, but it is not a win. Automated sentiment classifiers should be calibrated against a human-labeled sample per client vertical, because behavioral health copy and home services copy carry different baselines.
Prompt coverage is the fourth layer: the percentage of the tracked prompt library in which the brand appears at least once across the rerun window. Share of Answer can be inflated by a brand dominating a narrow slice of prompts. Prompt coverage exposes concentration risk and points specialist hours at the queries where the client is invisible.
The answer-quality layer: borrowing from RAG evaluation science
The layers above measure presence. They do not measure whether the answer that mentioned the client was accurate, complete, or grounded in real sources. That gap is where retrieval-augmented generation evaluators earn their place in the stack.
DeepEval's taxonomy gives agency leads a working vocabulary: ContextualPrecision and ContextualRecall on the retrieval side, AnswerRelevancy and Faithfulness on the generation side.5 Microsoft's Foundry evaluators add Fidelity, Groundedness, and Response Completeness against labeled ground truth.8 Toloka's framework layers end-to-end task success rate and grounding onto the same evaluation spine.7 RAGAS defines faithfulness as the degree to which generated answers are supported by retrieved documents, which is the operational definition of a hallucination check.9
For benchmarking, the LinkedIn technical guide gives targets that translate to client conversations: Precision@5 at or above 0.7, Recall@20 at or above 0.8, and NDCG@10 above 0.8 for well-tuned ranking.6 These are not the agency's numbers to hit. They are the numbers the engine is trying to hit, and they explain why a factually correct client claim on the client's own domain still failed to surface in the answer.
Agency leads do not need to run RAGAS in production. They need to know the vocabulary well enough to diagnose why an answer changed. When a client asks why the brand appeared in Tuesday's Gemini answer and vanished from Thursday's, "retrieval recall dropped on the seed source" is a defensible reply. "The algorithm changed" is not.
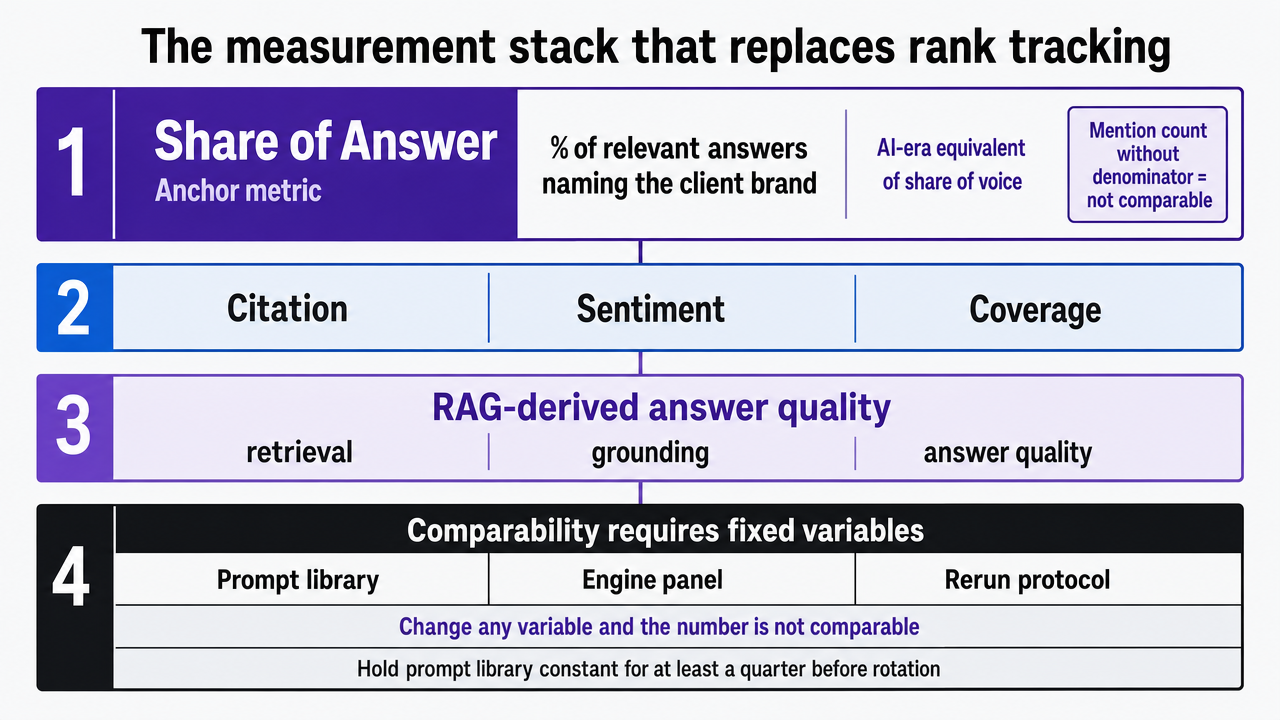 Process infographic visualizing the four-layer measurement stack described in the section: Share of Answer, citation/sentiment/coverage, and RAG-derived answer quality
Benchmarks agency leads can defend in a client deck
A client asking whether a 38% Share of Answer is good needs an expectation curve, not a shrug. The most defensible curve in the public literature is the three-tier brand-stature ladder from the 2026 arXiv preprint on brand visibility across AI search engines. Its scope matters: first-run visibility, relevant-prompt sets, not universal mention rates across every conceivable query.
Inside that scope, global household names such as Stripe and Nike appear in 73% of relevant AI answers on the first run. Established mid-market and regional brands appear in 44%. Niche and small brands appear in just 11%.2
Those three numbers do more work in a client conversation than any dashboard widget. A regional dental group tracking at 12% Share of Answer is not underperforming — it is sitting inside the niche band and slightly above it. A national home services franchise tracking at 28% is running below its tier and has room to close. A boutique law firm at 9% is on curve, and the honest conversation is about whether the goal is to stay on curve or to invest in the entity signals that move a brand up a tier.
Agency leads should annotate every client Share of Answer number with the tier band that applies to that brand's market position. A number without a band invites the wrong comparison. The client will benchmark against the loudest competitor they can name, not against a brand of similar stature, and the reporting call will drift into an argument the data cannot settle.
Two cautions travel with this ladder. First, it is a first-run figure, and single runs are noisy — a point the next section develops with rerun persistence data. Second, the underlying prompt sets were curated to be relevant to each brand's category, so agencies replicating this benchmark internally must document their prompt selection or the comparison will not hold. Publish the prompt library methodology in the client's onboarding document and reference it in every quarterly review.
With the tier band fixed, Share of Answer stops being a vanity metric and starts behaving like a defensible KPI.
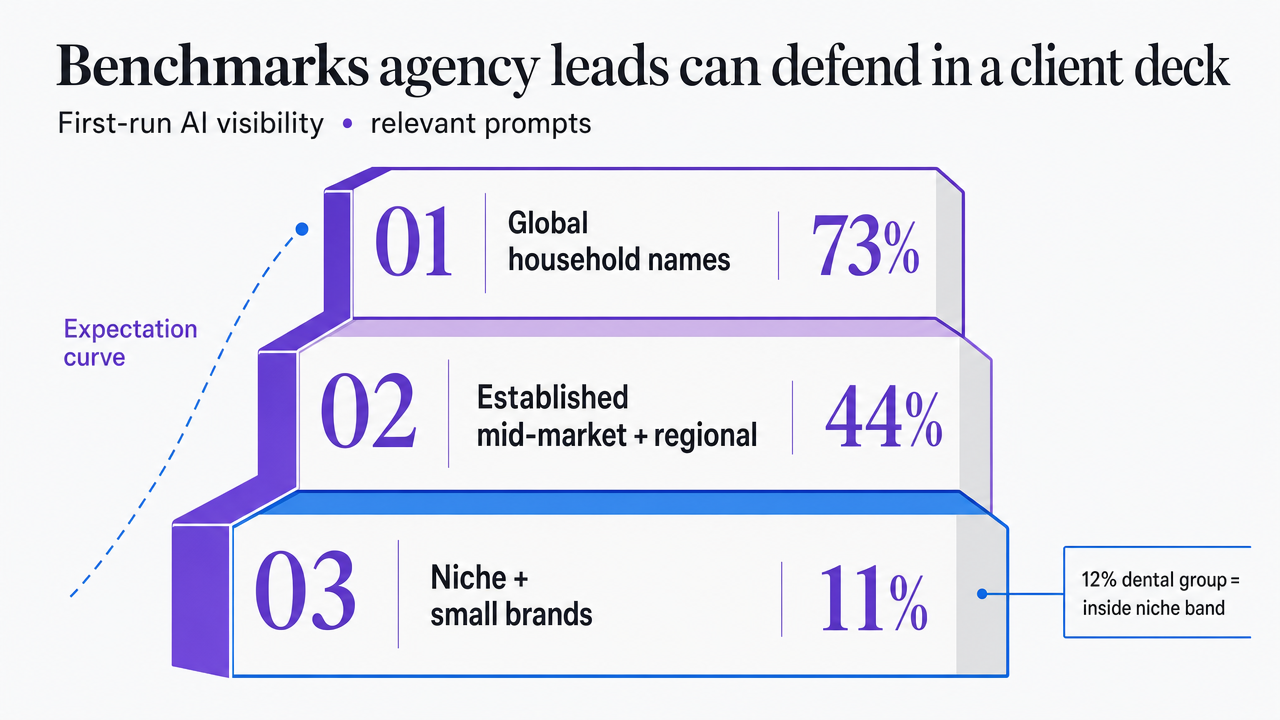 Visualize the three-tier brand-stature ladder for first-run AI visibility, which is explicitly cited with numbers in the surrounding prose
Track and validate AI-driven SEO outcomes now
Measure real-time content impact using AI-powered results tracking on your own published campaigns during your trial.
Volatility, cadence, and why single-run reports mislead clients
A single query fired at a single engine on a single day is not a measurement. It is a snapshot of one draw from a distribution, and the distribution is wider than most client dashboards admit.
The Q3 2026 visibility data quantifies the problem. Only 30% of brands stay visible from one answer to the next, and just 20% remain present across five consecutive runs of the same prompt.4 A brand that appears in Monday's answer has roughly a one-in-three chance of appearing in Tuesday's, and a one-in-five chance of holding through the week.
That decay curve breaks the point-in-time report. An agency that pulls a Share of Answer number from a single rerun and puts it in a client deck is reporting a coin flip.
The fix is cadence-based sampling. Every tracked prompt should be executed at least five times per engine per reporting window, and the metric that goes on the dashboard is the persistence-weighted average across those runs, not the max and not the first. Weekly reruns catch drift from model updates and index refreshes. Monthly aggregations smooth the noise into a curve a client can read.
Agency leads should also report a volatility band alongside the headline number. A brand at 38% Share of Answer with a rerun standard deviation of 4 points is a different asset than a brand at 38% with a standard deviation of 18 points. The first is stable and defensible. The second is one model update away from disappearing, and the intervention plan should reflect that fragility.
Where mentions actually originate, and what that means for off-domain seeding
The Q3 2026 visibility data isolates a fact that reshapes content allocation: roughly 85% of early-brand-discovery mentions in AI answers originate from external, third-party domains rather than the brand's own site.4 The engine is not quoting the client's homepage when a buyer asks a category question for the first time. It is quoting the trade publication, the industry roundup, the review site, and the analyst post.
That number redraws the map of where specialist hours should land.
An agency running a content program that publishes only to the client's owned domain is optimizing for a channel that supplies roughly 15% of first-touch mentions. The remaining share is won on properties the client does not control — earned coverage, contributed articles, podcast transcripts, category comparison pages, and structured directory listings. Off-domain seeding is not a link-building goal dressed in new language. It is a mention-origination goal, and the deliverable is a named brand inside a body of text an engine trusts enough to reproduce.
Agency leads should split content programs into two lanes. The owned lane defends bottom-funnel queries where the engine will surface the client's own documentation once the buyer knows the brand name. The seeded lane places the brand inside third-party contexts that carry the query language identified in the prompt library — the same keyword-brand alignment that predicted 32.5% of mention variance in the Keygrip decomposition.1 Track mention origin as a field on every logged answer, and the two lanes stop competing for the same budget.
Auditing whether the answer that mentioned the client was correct
A mention that carries the wrong price, the wrong service area, or the wrong specialty is not a win. It is a liability the client will surface on the next reporting call, and it does not get fixed by pushing more content at the engine.
Agency leads need a lightweight audit layer that scores every logged mention on two questions: was the surrounding claim accurate, and was it grounded in a source the engine could point to. RAGAS defines faithfulness as the degree to which a generated answer is supported by retrieved documents, which is the working definition of a hallucination check at the answer level.9 Microsoft's Foundry evaluators formalize the same idea as Groundedness and Response Completeness against labeled ground truth.8
Operationally, this does not require running a full RAG evaluation pipeline. It requires a per-client fact sheet — service lines, licensed states, pricing bands, credentials — and a scored sample of logged answers each month against that sheet. Three fields per mention are enough: accurate, partially accurate, or incorrect, with the specific claim flagged.
When an incorrect mention repeats across engines, the intervention is almost always off-domain: a stale third-party listing, an outdated review roundup, or a directory that the engine treats as authoritative. Fix the source, and the answer follows.
See How AI-Powered Tracking Surfaces Mentions That Matter—Not Just Rankings
Connect with our team to review live use cases where AI-driven results tracking delivers actionable insights across all channels, streamlining reporting for agencies managing high-volume, multi-client portfolios.
A NIST-shaped operating loop for portfolio measurement
Map: building the prompt universe per client
The Map function in the NIST AI Risk Management Framework asks a team to define the context and scope of what it is measuring before it measures anything.11 For AI results tracking, that translates into one deliverable per client: a documented prompt universe.
The universe is built in four passes:
- Category prompts — the questions a buyer types when they do not yet know the client brand.
- Comparison prompts — the queries that pit the client's category against direct substitutes.
- Use-case prompts — the verb-and-outcome phrasings pulled from sales-call transcripts and support tickets.
- Geography prompts, where the client has service-area constraints.
Each prompt is tagged with buyer stage, intent type, and expected engine coverage. The universe is versioned, signed off by the client, and locked for the reporting quarter. A prompt library that drifts week to week produces Share of Answer numbers that cannot be compared to themselves.
Measure: instrumentation across engines and reruns
Measure operationalizes the Map artifact into a repeatable data collection routine.11 Every prompt in the locked universe gets fired at every engine in the panel, at a fixed cadence, with a minimum of five reruns per prompt per engine per window.
Four engines cover the current answer market: GPT-4.1, Claude Sonnet 4.5, Gemini 2.5 Flash, and Google AI Overviews, matching the panel used in the 110,523-response Keygrip decomposition.1 Cutting the panel to two engines to save analyst minutes hides the engine where the client is bleeding.
Each logged answer captures nine fields:
- prompt ID
- engine
- timestamp
- full answer text
- mention presence
- mention position
- citation presence
- cited URL
- mention origin domain
Downstream metrics — Share of Answer, citation rate, prompt coverage, rerun standard deviation, mention origin split — all derive from that log. The instrumentation is boring on purpose. A schema that survives a personnel change is worth more than a clever one.
Manage and Govern: interventions and client reporting cadence
Manage is the intervention layer. When Share of Answer drops on a specific engine, or when rerun variance widens past the client's agreed volatility band, the log points at one of three levers:
- prompt-language misalignment on owned content,
- missing off-domain seed placements, or
- a stale third-party source repeating an inaccurate claim.
Each intervention is logged against the prompt IDs it targets, so the next measurement window can attribute movement rather than guess at it.
Govern sits above Manage and closes the loop with the client.11 It defines who signs off on the prompt universe each quarter, who approves interventions before execution, and what cadence the reporting call runs on — weekly instrumentation, monthly aggregation, quarterly review is a defensible default across a portfolio.
The Govern layer is where agency leads defend margin. A documented sign-off trail means a client who asks why Share of Answer moved gets a changelog, not a debate. That is the difference between a retained account and a churned one.
If a lead runs 15 or more accounts: the portfolio economics of measurement
This section is for agency SEO leads running 15 or more accounts, not single-brand in-house teams. The math of instrumentation changes shape at that threshold, and the change is what forces headcount decisions.
A defensible measurement window rests on four variables: prompts tracked per client, engines audited, reruns per prompt per engine, and analyst minutes per audit cycle. Hold three constant and the fourth becomes the cost driver. The four-engine panel used in the 110,523-response Keygrip decomposition sets a credible floor for engine coverage1, and the five-run minimum needed to defeat the 30% single-rerun persistence rate sets the floor for reruns.4
The table below is a variable model, not a price sheet. Plug in the loaded analyst rate the agency actually pays.
| Variable | Small portfolio (15 accts) | Mid portfolio (40 accts) ||---|---|---|| Prompts per client | 40 | 40 || Engines audited | 4 | 4 || Reruns per prompt per week | 5 | 5 || Logged answers per week | 12,000 | 32,000 || Analyst minutes per client per cycle (manual) | M | M || Total analyst minutes per week (manual) | 15 × M | 40 × M |
At 40 accounts, every additional minute of manual work per client compounds by 40 across every reporting cycle. A specialist who spends 90 minutes per client per week on logging, deduplication, sentiment scoring, and origin tagging burns 60 hours of billable capacity — more than one full-time analyst — before a single client-facing insight gets written.
Automated instrumentation collapses the M variable toward zero for logging and derivation, leaving analyst minutes concentrated on interpretation and intervention design. That is where portfolio margin is defended. The lead who codifies this stack keeps the retention conversation; the one who staffs it out of specialist hours watches gross margin erode one client at a time.
A defensible reporting schema that rejects vanity metrics
A monthly client report that leads with "1,247 brand mentions" is not a report. It is a number without a denominator, and any client with an analyst on staff will spot the gap on the second call.
The defensible schema puts five fields on the front page and nothing else:
- Share of Answer, segmented by engine, with the tier band annotated.
- Rerun standard deviation across the reporting window, so the client sees stability, not a coin flip.
- Citation rate, because mention-plus-citation pairs are 40% more likely to reappear on the next answer.4
- Prompt coverage, expressed as the percentage of the locked prompt library where the brand appeared at least once.
- Mention-origin split between owned and third-party domains, since roughly 85% of early-discovery mentions originate off-domain.4
Three fields do not belong on the front page:
- Raw mention counts without a denominator.
- Blended cross-engine averages that hide the weakest engine.
- Single-run snapshots dressed as trends.
Every number ships with its methodology footnote: prompt library version, engine panel, rerun count, reporting window. The footnote is the retention insurance. It is what turns a Share of Answer figure into a KPI the client will defend internally rather than question externally.
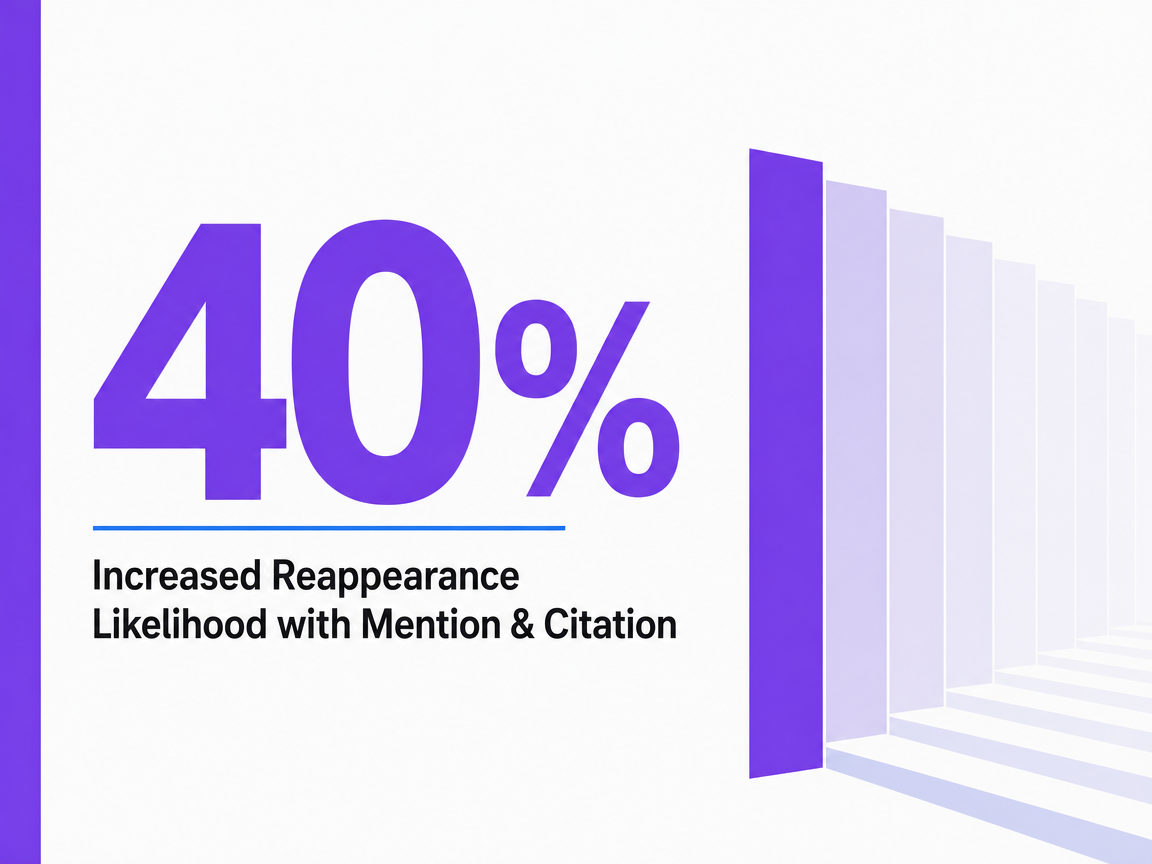 Increased Reappearance Likelihood with Mention & Citation
Increased Reappearance Likelihood with Mention & Citation
Frequently Asked Questions
References
- 1.Measuring Brand Visibility Across AI Answer Engines | Keygrip.
- 2.Measuring Brand Visibility Across AI Search Engines.
- 3.AI Recognizes 96% Of Brands But Mentions Almost None, New Study Finds.
- 4.Q3 AI Visibility: AI Citations, Brand Mentions & Content Refreshes That Work.
- 5.RAG Evaluation | DeepEval - The LLM Evaluation Framework.
- 6.How to Evaluate RAG Systems: The Complete Technical Guide.
- 7.RAG evaluation: a technical guide to measuring retrieval-augmented generation.
- 8.Retrieval-Augmented Generation (RAG) Evaluators for Generative AI.
- 9.RAGAS: Automated Evaluation of Retrieval-Augmented Generation.
- 10.Artificial Intelligence Risk Management Framework - NIST.
- 11.Artificial Intelligence Risk Management Framework (AI RMF 1.0).