
Key Takeaways
- Replace the linear funnel matrix with a 3x3 coverage grid that maps Problem-Aware, Solution-Aware, and Vendor-Aware buyer states against Educate, De-risk, and Validate content jobs.
- Prioritize personal value alongside business value, since B2B buyers were nearly 50% more likely to purchase and 8x more likely to pay a premium when personal value was present 2.
- Treat execution capacity as the binding constraint—budget, headcount, and workflow friction decide whether the coverage grid actually gets filled before competitors claim those buyer surfaces 10.
- Start with a 90-day rebuild: audit assets against the coverage grid, fill the De-risk row using sales-surfaced objections, then operationalize a monthly review and influence scorecard.
The Pre-Engagement Window VPs No Longer Own
By the time a sales rep books a discovery call, the buyer has already run the meeting in their head. Google and Millward Brown Digital documented this shift years ago: 71% of B2B researchers start with a generic, non-branded search, and the average researcher conducts 12 searches before engaging directly with a brand's site 1. That same study found 42% of B2B researchers use mobile during the purchase process, and 70% watch video on the path to purchase 1.
None of those touchpoints are owned by the vendor. They belong to search engines, YouTube, analyst sites, peer communities, and competitor content.
For an in-house marketing leader carrying a pipeline number, this is the strategic problem hiding inside every quarterly review. The pre-engagement window—the weeks or months between a buyer's first generic query and their first form fill—is where preference forms, shortlists are built, and price sensitivity is decided. Forrester's 2023 Global Buyers' Journey Survey found that budget pressure, information overload, and generational differences are stretching cycles further, with buyers requiring more interactions across more channels before committing 15. More interactions, distributed across more surfaces, mean more chances to be present or absent.
Content strategy, viewed this way, is not a publishing schedule. It is a coverage decision about which of those 12 searches, mobile sessions, and video views a company intends to show up for, and what the buyer encounters when they do.
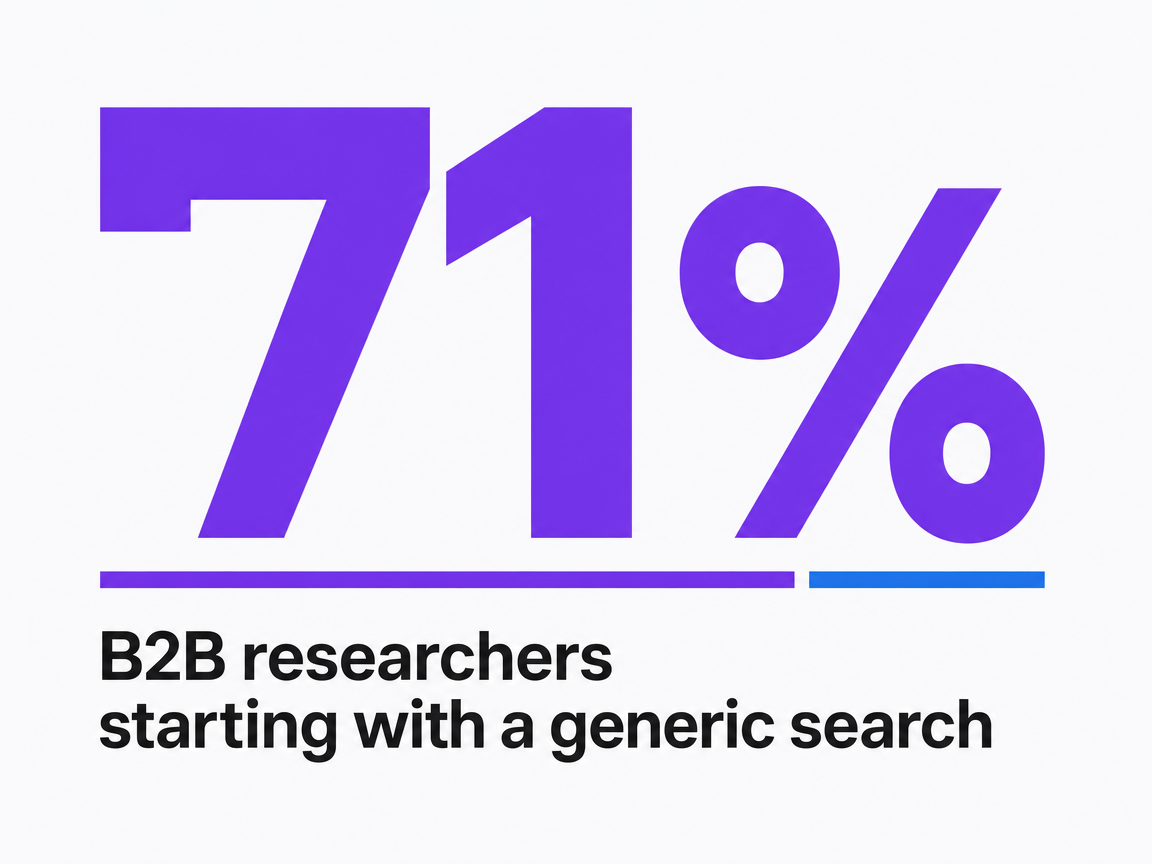 B2B researchers starting with a generic search
B2B researchers starting with a generic search
Why Funnel-Stage Content Matrices Stopped Producing Pipeline
The classic content matrix—awareness blog post, consideration whitepaper, decision case study—assumes a buyer who moves in one direction through three tidy stages. That assumption broke. Google's research on decision-making describes the modern buying process as a 'messy middle,' a cycle of exploration and evaluation where buyers loop between learning and short-listing rather than progressing in a straight line 5. A prospect can read a product comparison on Tuesday, return to a category overview on Friday, and watch an implementation video the following week without ever signaling stage progression to a marketing automation platform.
Forrester's 2023 Global Buyers' Journey Survey adds the multi-stakeholder dimension: budget pressure, information overload, and generational differences are stretching cycles, with buyers requiring more interactions across more channels before reaching consensus 15. A single buying committee may include a champion in exploration mode, a finance reviewer in evaluation mode, and a security stakeholder running parallel due diligence—all consuming different content on different surfaces in the same week.
Funnel-stage matrices treat content as a sequencing problem. The actual problem is coverage. When in-house teams audit their libraries against this reality, the gaps are rarely at the top or bottom—they sit in the loops, where the same buyer needs reassurance, comparison, and proof in alternating cycles a linear matrix was never built to serve.
A Pipeline Coverage Model in Place of the Funnel
Three Buyer States Worth Designing For
Stages imply movement. States describe a buyer's current question, regardless of where they sit in a CRM. Three states cover most of the territory worth designing content against: Problem-Aware, Solution-Aware, and Vendor-Aware.
- Problem-Aware buyers know something is broken but have not named the category of fix. Their searches are diagnostic and outcome-oriented—the generic, non-branded queries that begin most B2B research 1. They are not looking for vendors. They are looking for vocabulary.
- Solution-Aware buyers have named the category and are comparing approaches. They want frameworks, trade-offs, and implementation realities. Peer-reviewed work on content marketing effectiveness identifies relevance, context, and quality as the determinants that separate content that holds attention from content that gets closed 6. At this state, vague thought leadership fails the relevance test.
- Vendor-Aware buyers have a shortlist. Their consumption shifts to proof: customer outcomes, security posture, integration depth, total cost of ownership.
The same buyer can occupy two states in one week as new stakeholders join the committee. Designing for states rather than stages means the library is built to answer the question on the screen, not to push a contact down a pipeline they may not be in.
Three Content Jobs: Educate, De-risk, Validate
Each buyer state pairs with a content job. Educate builds the mental model. De-risk reduces the perceived cost of being wrong. Validate confirms the choice in front of skeptics. Mapping these jobs across the three states produces a 3x3 coverage grid that replaces the linear funnel matrix most teams still operate from.
In the Problem-Aware row, Educate looks like diagnostic guides and category primers; De-risk looks like benchmarks that quantify the cost of inaction; Validate looks like analyst commentary and peer signals that confirm the problem is worth solving. In the Solution-Aware row, Educate becomes comparison frameworks and architecture explainers; De-risk becomes implementation post-mortems and pricing-model breakdowns; Validate becomes practitioner reviews and detailed case narratives. In the Vendor-Aware row, Educate becomes product deep-dives; De-risk becomes security documentation, reference calls, and proof-of-concept playbooks; Validate becomes ROI models and customer outcomes tied to specific use cases.
The grid earns its keep because the same buying committee is doing all nine jobs at once. Forrester's 2023 Global Buyers' Journey Survey, which examined how B2B buyers research and purchase, found that budget pressure, information overload, and generational differences are stretching cycles, with buyers requiring more interactions across multiple channels before committing 15. A coverage grid forces the question every content meeting should start with: which cell is empty.
Finding Coverage Gaps Before Building More Assets
Most in-house libraries are not under-resourced. They are unevenly distributed. A typical audit against the 3x3 grid surfaces two patterns: heavy concentration in Solution-Aware Educate (the category-explainer blog posts every competitor also publishes) and thin coverage in De-risk cells, where buyers actually stall.
A practical audit takes one working session. Pull the last 24 months of published assets, tag each one to a single cell based on the dominant job it performs, and count. Empty or single-asset cells are the production queue. Cells with eight overlapping assets are the consolidation queue.
The discipline matters because the alternative is volume for its own sake. The Content Marketing Institute's annual survey of more than 1,000 B2B marketers documents that practitioner constraints—budget, headcount, and workflow—are the binding limits on output, not ideas 10. Adding a tenth Solution-Aware explainer when the Vendor-Aware De-risk row is empty does not move pipeline; it moves traffic to assets that were already ranking. Coverage gaps, once visible, change the editorial calendar from a topic list into a queue ordered by where buyers are losing confidence.
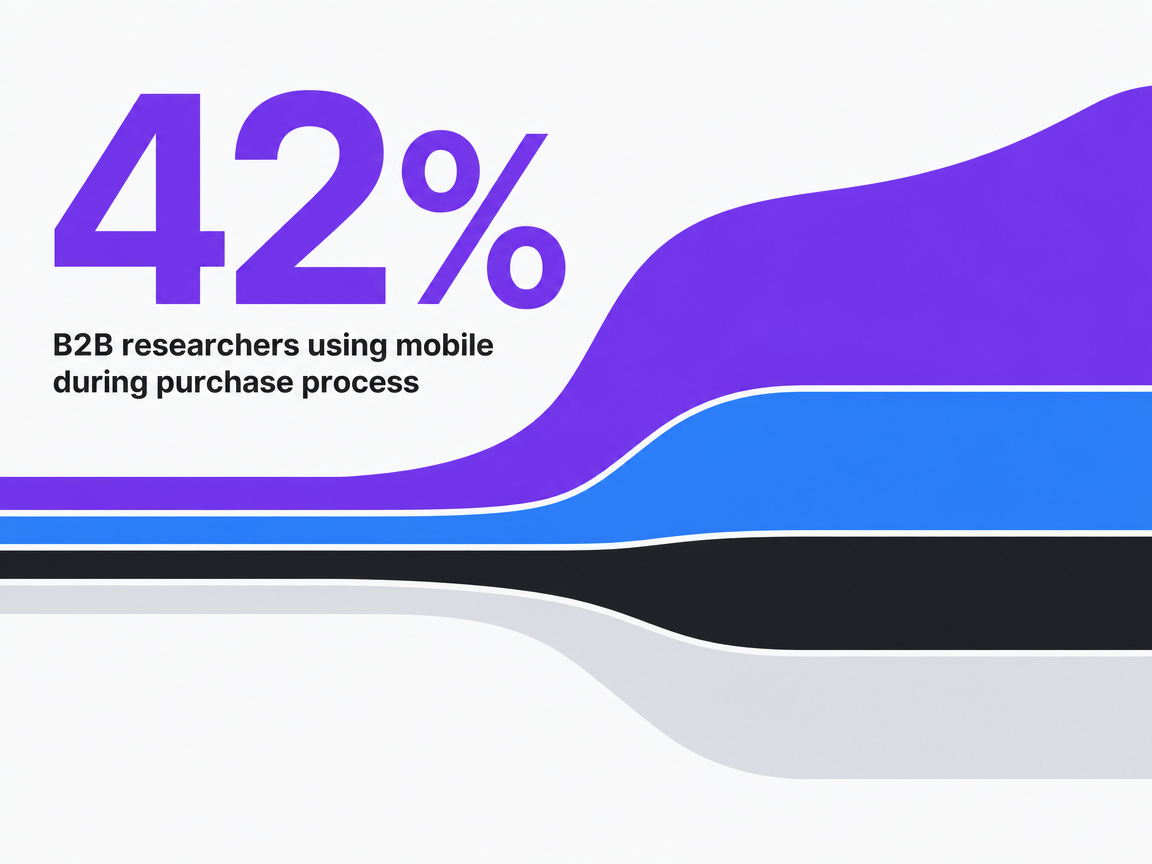 B2B researchers using mobile during purchase process
B2B researchers using mobile during purchase process
Test a real B2B pipeline content workflow now
Experience live content production and see measurable impact on your pipeline in one week.
Designing for Personal Value, Not Just Business Value
The dominant failure mode in B2B content libraries is not weak product positioning. It is the assumption that buying committees decide on rational merit alone. The evidence from a joint study by Google, CEB, and Motista, published in From Promotion to Emotion, says otherwise: B2B buyers were nearly 50% more likely to purchase when they perceived personal value from a brand, and 8x more likely to pay a premium when personal value was present, compared with business value alone 2. The study examined how brand connection affects purchase behavior among individual B2B decision-makers across multiple industries.
Personal value, in that research, is not sentiment. It is the buyer's perception that choosing this vendor will make them look competent, advance their career, or at minimum not get them fired. Business value answers whether the solution works for the company. Personal value answers whether recommending it works for the person.
For content design, this reframes the De-risk job in the coverage grid. A security documentation page is rational proof; a security documentation page paired with a reference call from a peer at a comparable company is personal proof. A pricing breakdown is business value; a pricing breakdown that names the specific objections a CFO will raise in the internal review is personal value. The asset type does not change. The buyer's exposure to career risk does.
Practitioner research on what makes content effective points the same direction. The peer-reviewed work on content marketing effectiveness identifies relevance, context, and quality as the determinants that separate content that converts from content that merely circulates 6. Relevance, applied to a champion preparing to defend a recommendation in front of skeptical stakeholders, means content that anticipates the room they are walking into—not content that congratulates them on caring about the category.
In-house teams testing this principle can audit any Vendor-Aware asset against one question: does it make the internal advocate's case easier to win, or does it only make the company's case easier to tell. Most libraries lean toward the second. The pipeline impact lives in the first.
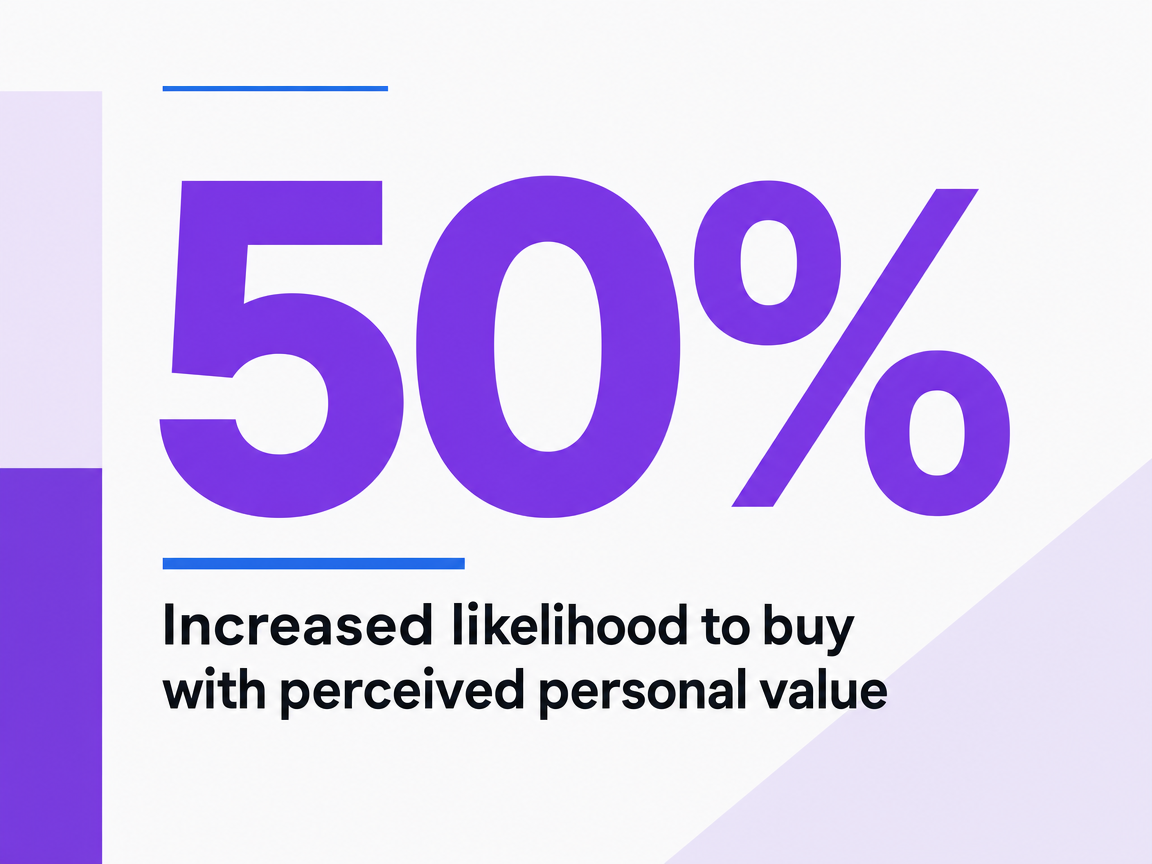 Increased likelihood to buy with perceived personal value
Increased likelihood to buy with perceived personal value
Channel Mix for a Search-Saturated, Mobile-Heavy Journey
Channel mix decisions usually get framed as a budget allocation problem. The buyer behavior data reframes it as a coverage problem. Google APAC's analysis of B2B SaaS research behavior found that 84% of buyers use online search throughout their purchase journey—not just at the start—and that 70% of mid-sized B2B buyers watch product videos on mobile while researching software 4. Search is not a top-of-funnel channel. It is the connective tissue across every state in the coverage grid.
That changes what a mix has to do. A library optimized for non-branded discovery covers the Problem-Aware row, but the same buyer who arrived through a diagnostic query will return through a branded comparison search a week later, then a mobile video session before a stakeholder meeting. If any of those surfaces are empty, the committee fills the gap with a competitor's asset or a peer's opinion.
Three production requirements follow:
- Every written asset needs a search-intent match to a real query, not a brand-defined topic.
- Key Solution-Aware and Vendor-Aware assets need a short-form video counterpart, because mobile video consumption during research is now the norm rather than the exception 4.
- The mobile rendering is the asset, not a fallback—Google's mobile research found that high-quality, personalized content delivered throughout the buying journey is a meaningful differentiator when buyers move between devices 12.
Distribution beyond owned channels matters for the same reason. Third-party reviews, analyst commentary, and peer communities surface during the same searches that pull up vendor content. Channel mix, judged by coverage rather than spend, is the count of buyer surfaces a team can credibly show up on within a quarter.
Measurement Without the Attribution Fantasy
Pipeline Influence Scoring Over Last-Touch Reporting
Last-touch reporting tells a marketing leader which asset closed the door behind the buyer. It says almost nothing about which assets put the buyer in the room. For a B2B content program judged on pipeline contribution, that gap is the entire problem.
Academic work on marketing analytics in digitized B2B environments points to why clean attribution remains out of reach. A study of firm-initiated and market-initiated digital touchpoints across B2B SaaS firms found that influence is distributed across both vendor-controlled channels and surfaces the vendor does not own—peer communities, analyst content, third-party reviews—making any single-model attribution incomplete by construction 13. The buyer's path through 12 searches and multiple devices 1 guarantees blind spots no UTM scheme will recover.
A pipeline influence score replaces the search for a single source of truth with a deliberate scoring rubric. Each open opportunity gets credit assigned across the content assets a buyer engaged with during the deal window, weighted by stage and recency. The score is directional, not definitive. Its value is comparative: which clusters of content appear in won deals at a higher rate than in lost ones, which assets show up in stalled deals, and which never appear at all. Run quarterly, the score turns the content library into a portfolio with measurable performance signals rather than a publishing archive.
What to Measure When the Journey Refuses to Be Linear
The International Trade Administration's guidance on digital marketing is blunt on the starting point: define measurable objectives and review analytics—visitors, traffic sources, conversion rates—on a regular cadence 9. That discipline is necessary but no longer sufficient. A non-linear journey demands a second layer of metrics that track coverage and influence, not just volume.
Four metrics carry most of the weight:
- Coverage rate measures the share of cells in the 3x3 grid with at least one current asset performing against its search intent.
- Engaged-account reach counts target accounts that touched two or more assets in a quarter, regardless of form fill.
- Sales-surfaced content rate tracks how often sellers pull library assets into active deals, a signal that content is doing the de-risk job the rep otherwise carries alone.
- Pipeline-touched revenue isolates opportunities where at least one buying-committee member engaged content before the opportunity was created.
None of these metrics produce a clean ROI number. Forrester's 2023 survey found buyers requiring more interactions across more channels before committing, with budget pressure and information overload extending cycles 15. Honest measurement reports what content influenced, where it was absent, and which cells need production next quarter. That is the report a VP can defend.
See How Leading Teams Operationalize B2B Content for Predictable Pipeline
Connect with experts to benchmark your content marketing workflow against data-driven best practices for pipeline acceleration—tailored for agencies and enterprise brands seeking measurable efficiency at scale.
Execution Capacity Is the Binding Constraint
Why Strategy Documents Don't Ship Content
The strategy deck is rarely the problem. The Content Marketing Institute's annual survey of more than 1,000 B2B marketers documents the same constraints year after year—budget pressure, headcount limits, and workflow friction sit at the top of practitioner challenges, ahead of any strategic gap 10. Coverage grids identify what should exist. Execution capacity decides what actually gets published.
A lean in-house team running three to eight people can produce a brief, an outline, a draft, two rounds of edits, a design pass, a publish, and a distribution sequence—for one asset. Multiply that by the nine cells of a Problem-Aware to Vendor-Aware coverage grid, then by the search-intent variants and mobile video counterparts the channel-mix data demands 4, and the queue lengthens past what calendar arithmetic supports.
The honest reading of CMI's data is that strategy is no longer the differentiator among B2B content programs 10. Throughput is. A coverage model only produces pipeline when the operating model behind it can fill the cells before buyers fill them with competitor content. That makes the operating-model choice itself a strategic decision, not a procurement footnote.
Comparing Three Operating Models
Three operating models cover the field most in-house VPs choose from: scaling an internal team, retaining a traditional agency, or running AI-assisted execution with human approval. Each makes different trade-offs against the variables that decide whether a coverage grid gets filled—headcount required, monthly throughput, and the oversight model that keeps quality and brand voice intact. No supplied research provides defensible dollar figures for these models, so the comparison below stays directional.
| Variable | In-house team scaling | Traditional agency retainer | AI-assisted execution with approval workflow |
|---|---|---|---|
| Headcount required | Adds roles per increment of output | Vendor staff plus internal brief/review owners | Existing team retains review authority |
| Throughput per month | Tied to writer and editor capacity | Tied to retainer scope and revision cycles | Scales without proportional headcount additions |
| Approval and oversight | Internal editorial control | Brief-driven, multi-round revision | Approval-first: every output reviewed before publish |
| Primary failure mode | Hiring lag, burnout | Briefing overhead, voice drift | Quality variance without disciplined review |
The CMI 2026 research notes a continued shift toward AI-assisted production as practitioners look for ways to expand output without expanding teams, while still treating human judgment as the quality gate 10. That direction matches what the coverage model demands: nine cells, multiple formats per cell, and a buying committee that consumes them in non-linear loops 5. The operating-model question for an in-house VP is not which model is best in the abstract. It is which one produces the throughput the coverage grid requires while keeping editorial control where it belongs.
Sales Alignment as a Content Production Input
Most editorial calendars are built from keyword research and internal opinion. The faster path to pipeline-relevant content runs through the sales floor. Sellers spend their week answering the exact questions buyers will not type into a search bar: the CFO objection that killed last quarter's deal, the security question that stalled a procurement review, the competitor claim that surfaced in the third meeting. None of that shows up in a search volume report.
Academic work on the future of buyer-seller interactions documents the shift driving this: digitalization has moved more of the decision-making process upstream of direct contact, which changes what sellers see and what marketing must cover 7. By the time a rep enters a conversation, the buyer has consumed content the rep did not write, often from sources the company does not control. The rep's value is now diagnostic—identifying which objections survived the pre-engagement window and which assets failed to neutralize them.
Two production inputs follow:
- A standing intake from sales: a shared log where reps tag the objection, the deal stage, and the asset they wished existed.
- A monthly review that converts the highest-frequency entries into De-risk and Validate assets in the coverage grid.
Sales-surfaced content rate, tracked as part of the measurement layer, closes the loop—assets that reps pull into active deals earn their place in the library; assets that never get cited get retired.
A 90-Day Rebuild Sequence for In-House Teams
A rebuild does not need a year. It needs a sequence that respects the binding constraints already documented: lean teams, fragmented buyer journeys 5, and execution capacity ahead of strategy 10.
- Days 1–30: Audit and score. Tag the last 24 months of assets to the 3x3 coverage grid. Map each asset to a real search query and flag the cells with zero or single-asset coverage. Pull six months of closed-won and closed-lost opportunities and run a first-pass pipeline influence score against the assets each buying committee engaged. The output is a ranked production queue and a retirement list, grounded in the International Trade Administration's baseline discipline of measurable objectives and recurring analytics review 9.
- Days 31–60: Fill the De-risk row. Most libraries stall here. Prioritize Solution-Aware and Vendor-Aware De-risk assets that answer the objections sellers log in the standing intake. Pair each long-form asset with a mobile video counterpart, since search and mobile video remain the dominant research surfaces 4.
- Days 61–90: Operationalize. Lock the monthly sales-content review, publish the influence scorecard, and commit to the operating model that can sustain the queue without adding headcount.
Frequently Asked Questions
References
- 1.B2B Marketing.
- 2.FROM PROMOTION TO EMOTION: Connecting B2B Customers to Brands.
- 3.B2B marketing: Connecting with new & existing business buyers.
- 4.B2B SaaS marketing: Expand beyond India.
- 5.Navigating purchase behavior & decision-making.
- 6.Determinants of content marketing effectiveness: Conceptual and empirical evidence.
- 7.The future of buyer–seller interactions: a conceptual framework and research agenda.
- 8.Blogging for Manufacturers: 5 Reasons You Need a Company Blog.
- 9.Understanding Digital Marketing.
- 10.B2B Content and Marketing Trends: Insights for 2026.
- 11.Content Marketing for B2B: How to Grow B2B Sales.
- 12.How mobile is reshaping the B2B landscape for growth.
- 13.Marketing Analytics in the Digitized B2B Landscape: Insights into ....
- 14.EX-99.4.
- 15.Forrester's 2023 Global Buyers' Journey Survey.