
Key Takeaways
- The MQL no longer reflects how buying happens, since a typical purchase now involves 13 internal stakeholders and 9 external influencers per decision 7.
- Qualified Buying Group Engagement replaces lead counts by scoring accounts on stakeholder diversity, role coverage, and at least one evaluation-stage action within a rolling window.
- Channel-silo scorecards hide the account-level convergence that predicts deals; coordination requires a shared target account list that every channel reports against 14.
- VPs should define 200-400 target accounts, run QBGE alongside MQLs for a quarter, map content to committee roles and value elements, and replace lead handoffs with account packets.
The MQL Has Outlived Its Usefulness
The marketing qualified lead (MQL) was designed for a buying process that no longer exists. It assumes a single individual initiates interest, gets scored, and progresses through a funnel towards a solitary decision. This model is contradicted by current evidence. Forrester's 2026 research on business buying indicates that a typical purchase decision now involves 13 internal stakeholders and 9 external influencers 7. A single MQL captures only one voice out of approximately twenty-two, making it an inadequate measure of pipeline health.
Forrester analysts advocate for marketers to move beyond leads and instead align around buying groups and opportunities 8. This shift is not merely philosophical but operational. When SaaS marketing teams report MQL volume to a board, they are often describing activity that the revenue team cannot effectively act upon, as the named contact rarely possesses sufficient authority, budget, or consensus-building power on their own.
A more profound issue is the disconnect between increasing volume metrics and stagnant pipeline conversion. Business buying remains a lengthy, committee-driven, and budget-constrained process 11. Generating more form fills against a slower committee yields the same number of deals but at a higher acquisition cost. Marketing VPs facing board pressure on customer acquisition cost (CAC) payback cannot resolve this by simply adding more leads. The unit of measurement must change before the operating model can adapt.
This analysis will outline what replaces the MQL and how coordinated channel execution makes the new metric defensible.
Why Lead Volume Stopped Predicting Pipeline
A Lead Is Now a Fragment of a Decision
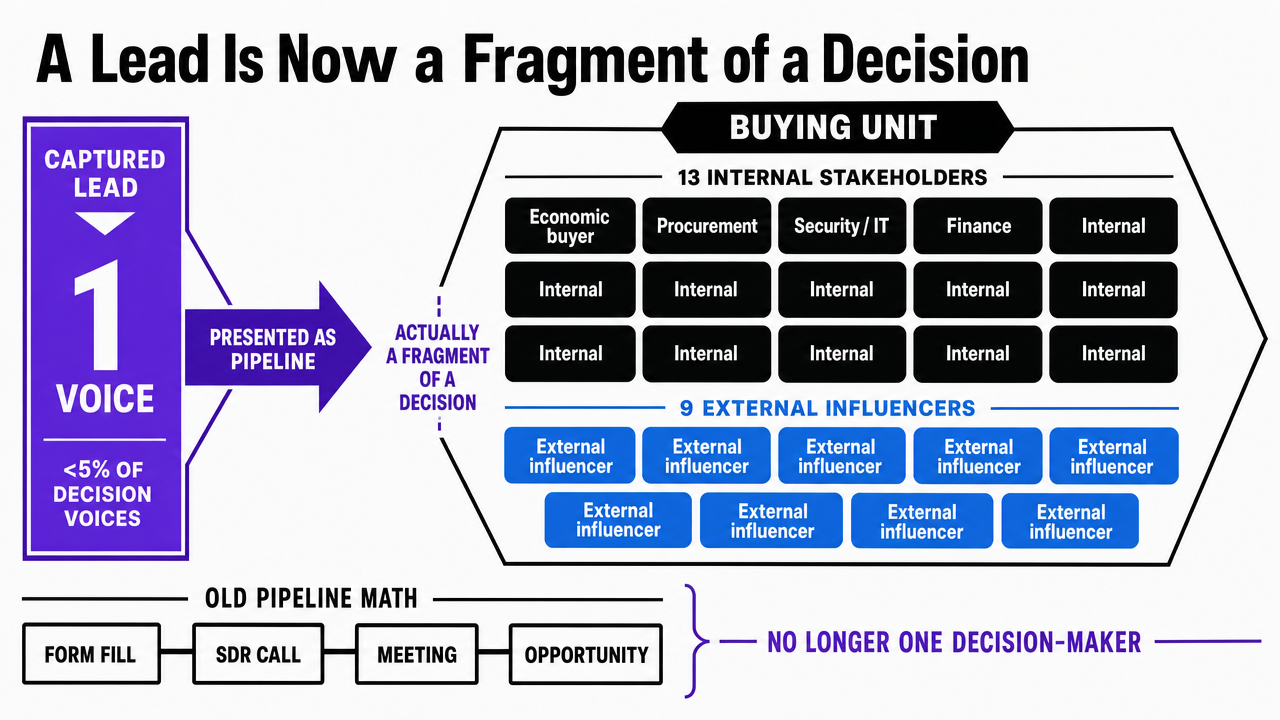
Pipeline mathematics was once straightforward: a contact filled a form, an SDR made a call, a meeting was booked, and an opportunity opened. This arithmetic worked because the contact was, in essence, the decision-maker. That assumption is no longer valid.
Forrester's 2026 business buying research reveals that a typical purchase decision now involves 13 internal stakeholders and 9 external influencers, forming a buying unit of roughly 22 people 7. A single captured lead represents less than five percent of the voices that will influence the outcome. Marketing teams reporting lead volume to a CRO are presenting fragments of decisions as if they were complete pipeline indicators.
The composition of this buying unit is as crucial as its size. Internal stakeholders include the economic buyer, a procurement lead, security or IT review, finance, the user team, and an executive sponsor. External influencers encompass analysts, peer references, consultants, and increasingly, AI-assisted research tools. Each group has distinct objections, content requirements, and timing within the buying cycle. A scoring model that prioritizes one contact for downloading a whitepaper overlooks the other 21 individuals who will ultimately approve or reject the purchase within the next 90 days.
Forrester emphasizes the operational implication: the strongest buying signal is multiple individuals from the same organization conducting research concurrently 10. This is an account-level pattern, not a lead-level one. Teams designed to score individuals in isolation cannot detect this. The pipeline number suffers because the measurement unit was built for a buying motion that has evolved, and most demand generation programs have not adjusted their metrics accordingly.
 Visualize the asymmetry between a single captured lead and the full 22-person buying unit cited directly in this section, reinforcing why MQLs misrepresent decision-making
The Hidden Cost of Channel-Silo Scorecards
Most SaaS marketing organizations report performance by channel, with separate dashboards for SEO, paid media, content, and backlinks. Each channel owner presents their metrics, but these reports rarely reconcile into a cohesive narrative.
This fragmentation has a clear cause. McKinsey's B2B Pulse 2024 reports that B2B buyers now utilize an average of 10 interaction channels in a single buying journey, a significant increase from 5 in 2016 6. While the number of touchpoints for a buying group has doubled in eight years, most marketing teams still measure performance one channel at a time. This often leads to a situation where individual channels meet their targets, yet overall pipeline declines because no one is tracking the account-level story across all 10 touchpoints.
Consider a common scenario: Paid media reports a strong cost per lead (CPL) for a security-focused ad campaign. SEO shows growing rankings for evaluation-stage queries. Content reports high engagement on a procurement-friendly comparison guide. Backlinks secures new placements on analyst-adjacent sites. Each channel appears healthy. However, within one target account, the security director clicked the ad, the VP of engineering read the comparison guide, and the procurement lead saw the analyst placement, all within two weeks. No channel scorecard reveals this convergence, and the SDR team remains unaware. Channel-silo reporting obscures the precise patterns that predict a closed deal. The reporting structure, rather than the demand generation work itself, prevents volume from converting into pipeline. Coordination becomes the critical output, necessitating a scorecard rebuilt around the account.
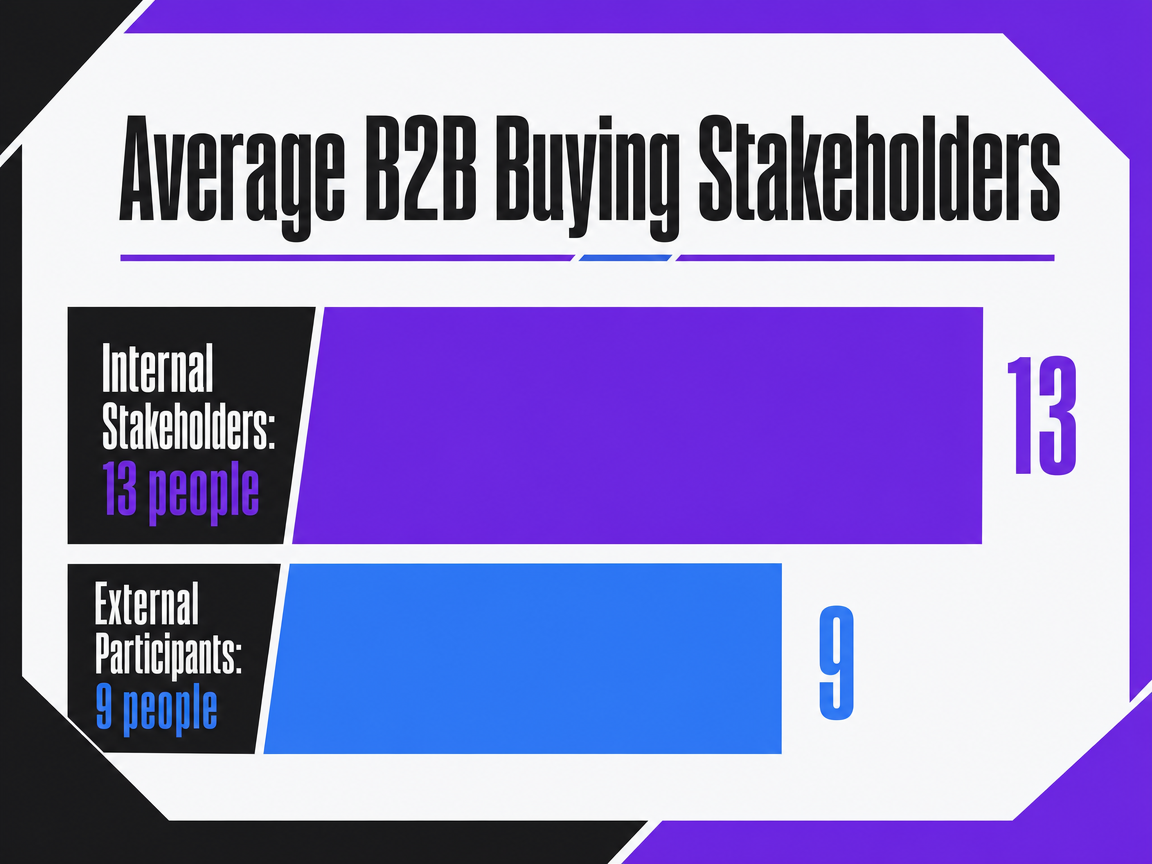 Average B2B Buying Stakeholders
A bar chart comparing the average number of internal vs. external people involved in a B2B purchase decision, according to Forrester research.
Replacing the MQL with Qualified Buying Group Engagement
What QBGE Actually Measures
Qualified Buying Group Engagement (QBGE) scores accounts, not individuals. The unit of measurement is a target account that has generated sufficient coordinated signal across multiple roles to indicate an active evaluation. A single contact downloading three assets does not significantly impact the score. However, three different contacts from one account engaging with three distinct parts of the buying journey does.
This is more than a simple relabeling. Forrester's analysts advocate for marketers to align around buying groups and opportunities instead of leads 8, based on the operational claim that the strongest signal of real intent is multiple individuals from the same organization researching concurrently 10. QBGE is the metric designed to capture this signal in a format actionable by the revenue team.
The definition of QBGE comprises three key components:
- Account threshold: a minimum number of distinct stakeholders engaged within a rolling window, typically 30 to 60 days.
- Role coverage requirement: engagement must span at least two functional groups common in a buying committee, such as the user team, economic buyer, security/IT, and procurement.
- Depth requirement: the engagement must include at least one high-intent action, such as a pricing-page visit, a comparison-guide review, or a sales-team interaction, not solely top-of-funnel touches.
QBGE reports the count of qualified accounts per week, rather than leads per week. This fundamental change reorients the entire pipeline conversation. A board reviewing QBGE sees the number of genuine opportunities forming, with the underlying committee structure visible, instead of a lead total that obscures how many of those leads share an employer.
The Signals That Compose an Account Score
The defensibility of QBGE relies entirely on the quality of the signals feeding it. Most marketing automation platforms already capture the necessary raw inputs; the task is to select the most relevant ones and weight them appropriately for fit.
McKinsey's guidance on personalization emphasizes that quality should take precedence over quantity, and having the right data is more important than having a large volume of it 13. Applied to account scoring, this means resisting the urge to incorporate every available field into the model. A concise set of signals directly linked to actual buying behavior will outperform a broad set of weakly correlated ones.
The signal set for QBGE is categorized into three types:
- Fit signals determine if an account is a suitable target: industry, employee count, tech stack, and revenue band.
- Engagement signals describe the buying group's activities: distinct stakeholders active in the last 30 days, diversity of roles among those stakeholders, depth of session on evaluation-stage pages, and direct sales interactions.
- Value-alignment signals indicate whether the account's stated priorities match the product's offerings. The B2B Elements of Value framework identifies 40 fundamental elements across five categories, from basic functional needs to inspirational drivers 5. Scoring inputs should reflect which categories the account's research patterns emphasize, not just firmographics.
The scoring model generates a single, daily-refreshed, account-level number, with the underlying signal mix transparently exposed. When an account crosses the QBGE threshold, an alert is routed to the named account team, accompanied by a committee map detailing who engaged, what they reviewed, their represented role, and the value elements their behavior suggests they prioritize. This comprehensive packet is what makes QBGE valuable to sales, not merely the score itself.
Run Real B2B Lead Generation Campaigns Instantly
Test your actual content live and measure B2B lead quality before making a commitment.
Engagement Quality as the Leading Indicator
If account-level scoring replaces the lead as the primary unit of measurement, then engagement quality is what makes that score predictive. Research from Northwestern's Spiegel Research Center, utilizing enterprise data, found that engagement is a powerful predictor of sales opportunities and wins 4. This finding is crucial because it identifies the variable that truly differentiates between a stalled account and a closed deal, and it is not lead count.
Quality engagement exhibits a distinct pattern: repeat visits from different roles, time spent on evaluation-stage assets rather than blog posts, comparison reads occurring close in time to pricing-page visits, and direct interactions with sales or product. A single 45-second session by one contact offers little predictive value. Conversely, three contacts from the same account spending 12 minutes across a product page, a security overview, and a case study within the same week is highly predictive. The signal resides in the pattern, not merely the volume of activity.
Buyer behavior underscores why depth of engagement is more important than broad reach. A study of 530 B2B buyers revealed that purchase decisions correlated with sellers who consistently demonstrated leadership behaviors, meaning they offered informed perspectives rather than generic responses 3. On the marketing side, engagement quality mirrors this finding. Accounts engage deeply with content that takes a definitive stance, while they tend to skim content that merely summarizes a category.
The operational implication is clear. A weekly pipeline review based on QBGE should report engagement depth per qualified account, with the role mix visible, rather than a top-line session count. This single change shifts the conversation from how many people showed up to which accounts are actively making decisions.
Content That Earns a Seat in the Buying Committee
A buying committee does not require more content; it needs content that presents a position the committee can debate. This distinction is vital because a 22-person buying unit 7 does not consume marketing assets in the same way a single buyer does. Each role seeks evidence addressing a specific objection, and generic category overviews fail to satisfy any of them.
The WKU study of 530 B2B buyers found that purchase decisions correlated with sellers who consistently demonstrated leadership behaviors, offering informed points of view rather than reactive responsiveness 3. The marketing equivalent is content with a clear thesis. A comparison guide that acknowledges trade-offs will be read by procurement. A security overview that transparently addresses product limitations will be forwarded to IT. A pricing-page rationale that explains the model will be cited by the economic buyer in a finance review. Content lacking a clear position is often bookmarked and then ignored.
The B2B Elements of Value framework identifies 40 elements across five categories, ranging from functional table stakes to inspirational drivers 5. Content planning should map assets to specific elements rather than to traditional funnel stages. A risk-reduction asset addresses one element, while a time-savings calculator addresses another. An asset attempting to speak to all 40 elements effectively speaks to none.
The operational test is straightforward: if a piece of content cannot be assigned to a named role within the committee and a specific value element, it should not be part of the program. The volume of published assets is an incorrect scorecard; coverage of the committee map is the appropriate one.
An Adaptive Operating Model for Coordinated Demand
The Five Pillars That Make Coordination Work
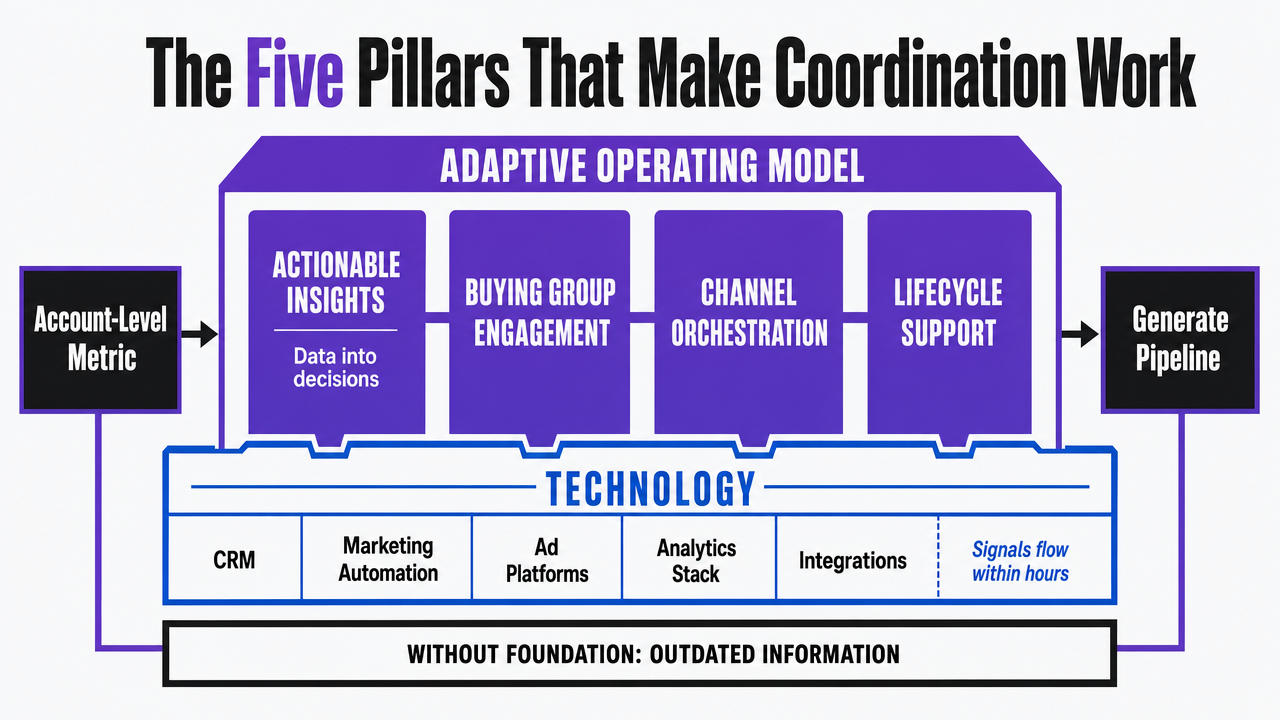
Replacing the MQL with an account-level metric is a measurement change. For this new metric to generate pipeline, it requires an operating model capable of supporting it. Forrester's adaptive programs framework outlines this model through five pillars: technology, actionable insights, buying group engagement, channel orchestration, and lifecycle support 9. Each pillar represents a capability that most SaaS marketing teams possess in fragments, but few have integrated effectively.
- Technology forms the data layer, encompassing the CRM, marketing automation platform, ad platforms, analytics stack, and the integrations that ensure signals flow between tools within hours, not via weekly exports. Without this foundation, the other four pillars operate on outdated information.
- Actionable insights translate this data into decisions. The output is not merely a dashboard, but a daily list of accounts crossing a threshold, the roles engaged, and the recommended next steps for the program. McKinsey's personalization guidance is directly applicable here: the right data is more valuable than a large quantity of data 13. A concise list of high-confidence signals is superior to a lengthy list of weakly correlated ones.
- Buying group engagement serves as the targeting unit. Campaigns are designed to reach the entire committee, not just a single persona.
- Channel orchestration is the execution layer, where search, paid, content, and backlink efforts are aligned against the same account list, with messaging coordinated by role and stage, rather than by individual channel manager preferences.
- Lifecycle support extends this model beyond the initial close, leveraging the same signal infrastructure for renewal and expansion efforts.
These pillars are not optional. A program lacking any one of them will revert to channel silos within a quarter, as the essential connective tissue will be absent.
 Visualize the five-pillar adaptive operating model described in this section, which is a named framework without numeric data but with clear structural components
Silo Scorecards vs. Account-Level Coordination
The shift in operating model becomes evident when comparing the two reporting structures. The following variables can be assessed by a VP of marketing within their current organization.
| Operating Variable | Channel-Silo Model | Account-Level Coordination |
|---|---|---|
| Vendors or agencies engaged | One per channel (SEO, paid, content, backlinks) | Single program against one account list |
| Primary KPI | Channel metrics (CPL, rankings, sessions, placements) | Qualified accounts and committee coverage |
| Reporting cadence | Weekly per channel, reconciled rarely | Daily account view, weekly program review |
| Target unit | Persona or lead | Buying group within a named account |
| Signal flow | Channel-local, exported monthly | Cross-channel, refreshed within the day |
| Sales handoff | Lead record with score | Account packet with committee map and content history |
The right column represents the structure McKinsey describes as the differentiator in modern B2B selling, emphasizing integrated sales and marketing signals 14. The left column depicts the structure prevalent in most SaaS marketing organizations today, often with distinct vendor relationships for each row. The cost of reconciliation is significant: every channel meeting that concludes with "our numbers look fine" while pipeline lags is incurring this cost.
Transitioning from the channel-silo model to account-level coordination does not necessitate immediately terminating all vendor relationships. Instead, it requires first defining the target account list and then mandating that every channel report against it.
See How Leading SaaS Teams Align SEO, PPC, and Backlinks for Quality B2B Leads
Request a walkthrough of unified B2B lead generation workflows—built for agencies and enterprise brands seeking measurable improvements in lead quality, not just volume.
Where AI Search and Personalization Stop Working
While AI-assisted research has become part of the buying journey, its role is often narrower than vendor marketing suggests. Forrester's 2026 research on business buying indicates that AI search tools frequently provide incomplete or unreliable results, leading to buyer mistrust and a return to human validation 7. For a SaaS marketing leader, this has operational implications: generative AI answers are useful at the discovery phase of the journey but become unreliable at the core evaluation stage, where the committee is making critical decisions.
The same caution applies to personalization at scale. McKinsey's guidance explicitly states that quality should take precedence over quantity, and that having the right data is more important than having a large volume of it 13. Programs that aggressively personalize based on thin signals can produce an "uncanny valley" effect: a finance lead receives messaging tailored to an engineering pattern, a security director gets a procurement-flavored email, and the account loses confidence in the vendor before a sales conversation even begins. Poor personalization is more detrimental than no personalization, as it exposes the limitations of the underlying data.
The practical rule is to restrict AI and personalization to inputs that the committee will not directly see. Use these tools to rank accounts, identify signal patterns, and draft internal briefs. Maintain human review for all assets and messages that reach the buying group, particularly during evaluation and negotiation stages. The committee can discern the difference, and the cost of missteps manifests as silence from potential buyers.
What VPs Should Change in the Next Quarter
The shift from lead volume to account-level quality does not require a complete overhaul. It involves four strategic moves within a single quarter.
- Define the target account list. Select 200 to 400 target accounts and require every channel team to report against this list, rather than their channel-specific totals. McKinsey's reframing of modern B2B selling emphasizes integrated sales and marketing signals directed at the correct stakeholders, not parallel channel reports 14. Without a shared list, subsequent efforts will be ineffective.
- Implement a working version of Qualified Buying Group Engagement. Begin with three essential signals: distinct stakeholders active per account within a rolling 30-day period, diversity of roles among those stakeholders, and at least one evaluation-stage action. Report QBGE alongside MQLs for one quarter, then remove MQLs from board presentations.
- Reorient content planning around the committee map and B2B Elements of Value 5, rather than traditional funnel stages. Any asset that cannot be assigned to a specific role and a value element should be removed from the content calendar.
- Modify the sales handoff process. Replace the lead record with a comprehensive account packet: detailing who engaged, what content they consumed, their represented role, and recommended next steps for sales engagement.
The key board metric for the subsequent quarter will be qualified accounts and committee coverage. Platforms like Vectoron are designed to facilitate this coordination without increasing headcount, but the strategic decision rests with the VP.
Frequently Asked Questions
References
- 1.Evaluating the drivers of B2B performance: An empirical ... - PMC - NIH.
- 2.The future of buyer–seller interactions: a conceptual framework and ... - PMC - NIH.
- 3.B2B Buyers Want Leadership from Sellers.
- 4.How B2B Engagement Drives Revenue.
- 5.The B2B Elements of Value.
- 6.McKinsey B2B Pulse 2024.
- 7.The State Of Business Buying, 2026 - Forrester.
- 8.B2B Marketers Should Bury the Lead - Forrester.
- 9.The Future Of B2B Marketing Programs Is Adaptive.
- 10.Your Buyer Is A Group, Not A Person. What Are You Doing About It?.
- 11.The State Of Business Buying: Companies Still Struggle To Meet Buyers' Needs - Forrester.
- 12.The new B2B growth equation.
- 13.What is personalization?.
- 14.Future of B2B sales: The big reframe.