
Key Takeaways
- Rank reports no longer defend renewals because CMOs want sourced pipeline, not search-engine activity metrics that cannot answer where organic revenue actually came from.
- A defensible measurement approach layers search visibility, behavior analytics, attribution modeling, and CRM-linked revenue in sequence, because no single tool answers the pipeline question alone.
- Search Console's 2026 update added generative AI impressions, pages, countries, devices, and dates 1, making pre-2026 visibility reports incomplete by definition.
- Behavior analytics translates rankings into outcomes by revealing which landing pages convert organic traffic and which leak it before the CMO points it out.
- Last-click reporting systematically underserves organic search, and switching to statistical attribution 5often produces the largest reported-ROI lift without changing the client's site.
- Attribution model choice should follow exploratory analysis of actual conversion paths 4, with the model, lookback window, and reasoning documented inside the client report.
- MTA and MMM work as complementary methods 8, with MTA for tactical weekly decisions on smaller accounts and both running in parallel for larger budgets.
- CRM-linked revenue is where SEO ROI becomes defensible, requiring server-side conversion imports, identifier matching to closed-won records, and stage-level pipeline visibility.
- Client reports should disclose attribution model, evidence, tools, identifiers, and lookback windows up front, borrowing IAB/MRC transparency standards 6, 7to survive procurement audits.
- Portfolio reporting cost lives in analyst hours, not licenses, and bends only when event schemas are standardized and every layer pushes into a warehouse.
- Incrementality remains outside what standard tracking stacks can prove 10, so naming the gap and proposing geo holdouts protects credibility better than overclaiming.
- Orchestration above the four layers replaces monthly manual reconciliation by reading signals, ranking priorities, and routing approved work back into execution 11.
The QBR Problem: Why Rank Reports No Longer Renew Contracts
Picture the quarterly business review every agency Head of SEO has sat through this year. The slide deck opens with a green ranking chart: 47 keywords up, 12 flat, 6 down. The client's CMO nods, then asks the only question that matters. How much of last quarter's pipeline came from organic search, and how does that compare to what they paid the agency?
The room goes quiet because the ranking chart cannot answer that question. Neither can the sessions graph, the click-through rate table, or the domain authority score. Those metrics describe activity inside the search engine. The CMO is asking about activity inside her CRM.
This gap is why renewals are getting harder to defend. The measurement environment shifted underneath the traditional SEO report. Google's Search Console now reports visibility inside generative AI features alongside blue-link results 1. Industry bodies are pushing measurement toward real-time decisioning rather than retrospective dashboards 11. And the WARC and IAB coverage of the 2026 landscape describes an ecosystem shaped by privacy constraints, fragmented platforms, and outcome-linked measurement 9.
Agencies that still lead with keyword rankings are answering a 2019 question in a 2026 QBR. The tools that renew contracts are the ones that connect search performance to sourced revenue, with methodology a client's finance team can defend.
The Four-Layer Measurement Stack Replacing the Single-Tool Report
No single tool answers the CMO's pipeline question. The agencies renewing at premium retainers have stopped looking for one and started assembling four layers that work in sequence.
The first layer is search visibility: what surfaces, both blue-link and generative, are showing the client's content and to whom. Google's June 2026 update to Search Console formally extended this layer by adding impressions, pages, countries, devices, and dates for generative AI features 1. The second layer is behavior analytics: what visitors actually do once a ranking becomes a session. The third layer is attribution modeling: how credit for a conversion is distributed across the touchpoints organic search shared with paid, email, and direct. Adobe's documentation is explicit that attribution is not limited to paid media and can be applied to any dimension, channel, or event 3. The fourth layer is CRM-linked revenue: stitching the attributed conversion to a closed deal, a booked appointment, or a qualified opportunity inside the client's system of record.
Blended methods sit across these layers. IAB research documents the shift toward media mix modeling and multi-touch attribution as complementary rather than competing approaches 8. Each layer answers a different question, and skipping one leaves the QBR back at the ranking chart.
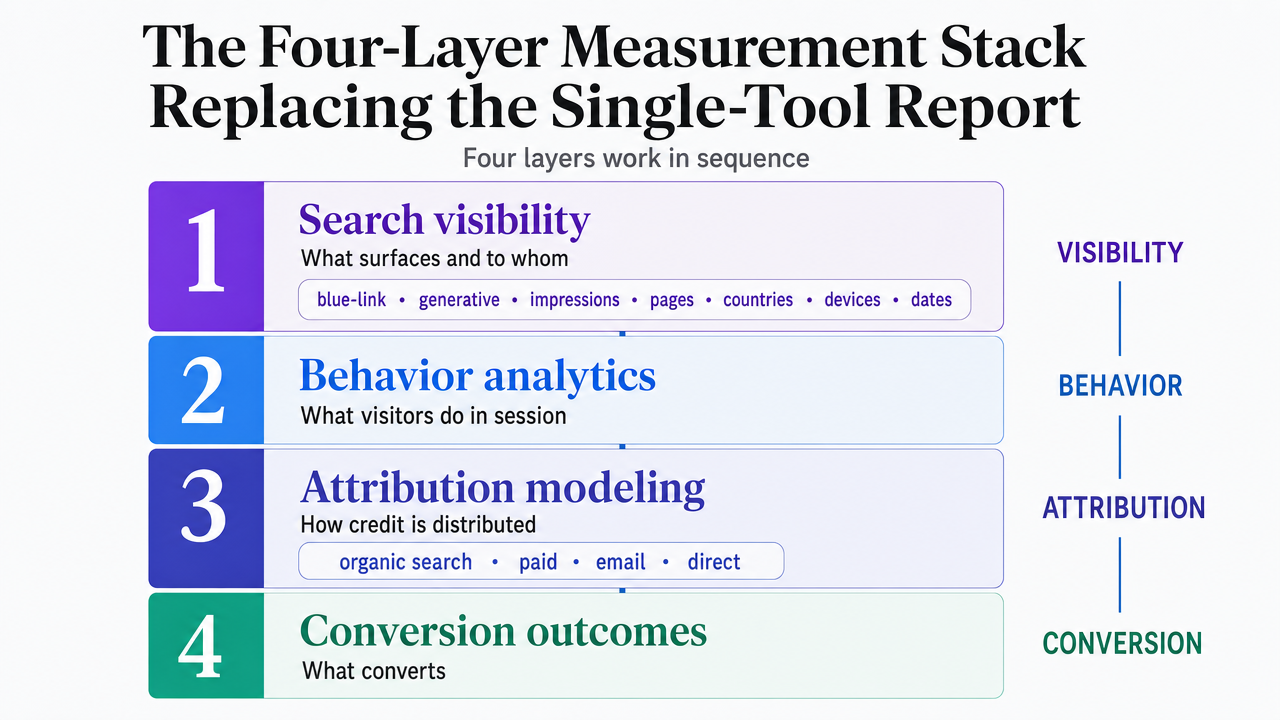 Visualize the four sequential measurement layers described in this section as a stacked framework, giving readers a mental model for the rest of the article
Layer One: Search Visibility Tools After the Generative AI Shift
Google Search Console and the New Definition of 'Visible'
Search Console used to answer one question: which queries surfaced ten blue links to the client's domain, and how often did users click. That definition of visibility held for roughly two decades. It no longer holds.
Google's June 2026 update added generative AI performance reports to Search Console, exposing impressions, pages, countries, devices, and dates for visibility inside AI-driven search features 1. Each of those five dimensions changes what an agency Head of SEO can put in a client report. Impressions inside AI features are not the same currency as impressions in a traditional SERP, because the click behavior downstream is different. Pages tell the agency which URLs are being cited or summarized, not just ranked. Country and device breakdowns matter for clients running geographically concentrated service businesses, where visibility in the wrong market is a cost, not an asset. Date-level data lets the agency correlate visibility movement with publishing events and algorithm updates.
The practical consequence is that a client visibility report built before mid-2026 is now incomplete by definition. Two audiences are watching the same brand: the traditional search audience and the generative AI audience. Reporting one and ignoring the other leaves a portion of the client's search presence undocumented.
Agencies rebuilding their visibility layer should treat the new dimensions as required columns, not optional add-ons. A defensible client dashboard now shows blue-link impressions and AI-feature impressions side by side, segmented by the page that earned them.
Third-Party Visibility Platforms and the API Access Question
Search Console is the primary source of truth, but it was not built to serve a 20-client portfolio through a single pane. That is where third-party visibility platforms earn their retainer line item. Ahrefs, Semrush, Sistrix, and similar tools add competitive share-of-voice, keyword-cluster tracking, and historical baselines that predate a client's engagement.
The question an agency Head of SEO should ask about any of them is narrower than the feature marketing suggests: what does the API allow, and at what quota. A visibility platform that cannot push data into a warehouse or a client-branded dashboard forces analysts to rebuild the same report by hand every month. Across 20 accounts, that manual rebuild is where reporting margin disappears.
Google exposes Search Console data programmatically through its query API, which returns everything available in the Performance report and can be pulled into a centralized reporting layer 2. Agencies that pair the Search Console API with a third-party visibility API get two feeds: Google's first-party record of what actually surfaced, and the competitive context that explains whether the client is gaining or losing share against named rivals.
Score visibility vendors on three criteria before renewing a license:
- API coverage of the same metrics shown in the interface.
- Rate limits that survive daily portfolio pulls.
- Documented methodology for share-of-voice calculations, since a client's finance team will eventually ask how that number was produced.
Layer Two: Behavior Analytics That Explain What Rankings Actually Produce
A ranking is a promise. A session is the outcome. Behavior analytics is the layer that translates one into the other, and it is where most client reports fall silent.
Google Analytics 4, Adobe Analytics, and privacy-first alternatives such as Piwik PRO or Matomo answer the questions rankings cannot. Which landing pages convert the organic traffic they earn, and which ones leak it. Which internal search queries reveal intent that the site failed to satisfy. Which content sequences precede a demo request versus a bounce. Adobe's documentation makes the useful point that attribution and analysis are not confined to paid dimensions, and that internal search, content, and event data can all be modeled against conversions 3.
For an agency Head of SEO, the behavior layer is where the client's product and content teams show up in the report. A page ranking first for a high-intent term but converting at a fraction of the site average is not a ranking problem. It is a landing experience problem, and the behavior tool is what surfaces it before the CMO does.
Score behavior platforms on three practical criteria:
- Event schema flexibility, so organic-sourced conversions can be tagged distinctly from paid.
- Cohort and segment persistence, so a visitor who arrived from organic in March can be tracked to a closed deal in June without re-stitching sessions.
- Warehouse export, because portfolio-scale reporting eventually leaves the analytics UI and lives in BigQuery, Snowflake, or a client-branded dashboard.
A behavior tool that cannot export its raw event stream will cap the sophistication of every layer above it.
Track SEO performance and client ROI instantly
Test real-time SEO reporting workflows and validate campaign impact using actual client data, risk free.
Layer Three: Attribution Tools That Credit Organic Search Fairly
Why Last-Click Reporting Underserves Organic
Organic search is a compounding channel that rarely closes the deal by itself. A prospect reads a comparison article in week one, returns via a branded search in week three, clicks a paid ad in week five, and converts through a sales email in week seven. Under last-click, that entire path credits email. Organic gets nothing on the report, even though it started the sequence and appeared twice inside it.
Adobe's algorithmic attribution documentation frames the alternative directly: statistical techniques allocate credit across dimension items in the report rather than assigning it to a single touchpoint 5. Applied to the same seven-week path, a statistical model might distribute credit so that organic search receives roughly 40 to 50 percent of the conversion value, paid receives 20 to 25 percent, and email receives the remainder. The dollar amount tied to the deal does not change. What changes is which channel gets to claim it in the QBR.
Agency Heads of SEO who present last-click numbers are quietly volunteering to look weaker than they are. Switching the attribution lens is often the single largest reported-ROI increase available without changing a line of the client's site.
Model Selection Discipline Before Reporting
Switching models is not a license to pick whichever one flatters the retainer. Adobe's best-practices guidance is explicit that model selection should follow exploratory analysis of how customers actually touch channels before converting, not the other way around 4. That order matters because a client's finance team will eventually ask why the agency chose participation over U-shaped, or algorithmic over time-decay.
The disciplined sequence looks like this:
- Pull the client's conversion paths for a defensible window, typically 30 to 90 days depending on sales cycle.
- Inspect how many touches precede a conversion, where organic appears in the sequence, and whether early or late touches dominate.
- Only then choose a model whose weighting logic matches the observed behavior.
A B2B client with 12-touch paths and a six-month sales cycle needs a different model than an e-commerce client whose median path is two touches over three days.
Document the choice in the report itself. A one-paragraph methodology note listing the model, the lookback window, and the reason both were selected turns an attribution number from a rhetorical claim into a defensible one. That paragraph is also the fastest way to survive a procurement audit.
Blended Methods: When MMM and MTA Belong in the Same Report
Multi-touch attribution is precise about individual paths but blind to what would have happened without the channel at all. Media mix modeling asks that counterfactual question at the aggregate level but cannot tell a client which specific blog post produced a demo. IAB research documents both approaches as complementary ways to measure effectiveness across channels and touchpoints, not as competing schools 8.
For an agency portfolio, the practical split is by client scale. Smaller accounts with limited data volume live on MTA alone, because MMM requires enough spend and outcome variance to model meaningfully. Larger accounts running organic alongside meaningful paid budgets benefit from running MTA weekly for tactical decisions and MMM quarterly for strategic ones. When both point the same direction, organic's contribution is defensible in front of a CFO. When they disagree, the disagreement itself is the finding, and the QBR should surface it rather than hide it behind a single number.
Layer Four: CRM-Linked Revenue and the Pipeline Stitch
Every layer above this one produces numbers a client's finance team will not accept as revenue. Impressions are not dollars. Sessions are not dollars. Attributed conversions are not dollars until they are matched to a record inside HubSpot, Salesforce, or whichever system the client uses to recognize pipeline. The stitch between analytics and CRM is where SEO ROI either becomes defensible or falls apart at the QBR.
The mechanics are straightforward and rarely executed well. A visitor arrives from organic search, and the analytics platform captures the session, source, and landing page. A form submission or scheduled call fires a conversion event with a unique identifier. That identifier travels with the lead into the CRM as a hidden field or API parameter, tagging the record with its originating channel, campaign, and landing page. Weeks or months later, when a salesperson marks the opportunity closed-won, the revenue amount and stage history flow back into the analytics warehouse against the original organic session. Adobe's documentation supports this pattern explicitly, noting that attribution can be applied to any dimension, metric, channel, or event rather than being confined to paid media 3.
The 2026 measurement environment makes this stitch harder and more valuable at the same time. IAB's summary of the current landscape describes an ecosystem shaped by privacy constraints, fragmented proprietary platforms, and inconsistent cross-channel approaches 9. Cookie deprecation and consent gating shorten the window in which client-side identifiers survive. Server-side event forwarding, first-party identity resolution, and CRM-native conversion imports are the workarounds that keep the stitch intact.
Agency Heads of SEO evaluating this layer should score tools against three questions:
- Does the platform support server-side conversion imports from the client's CRM, so revenue values overwrite estimated conversion values in the report.
- Can the identifier that leaves the site as a form submission be matched to the closed-won record without manual reconciliation.
- Does the reporting layer surface stage-level pipeline, not just closed revenue, so a slow B2B sales cycle does not make organic look inert for two quarters.
When all three answers are yes, the QBR opens with sourced pipeline instead of a ranking chart.
A Methodology-Disclosure Standard for Client-Facing Reports
The fastest way to lose a QBR is to present a number a client's finance team cannot reproduce. The fastest way to keep the retainer is to publish the methodology alongside the number, in plain language, before anyone asks.
The IAB and MRC have already written the standard agencies should be borrowing. The IAB/MRC Retail Media Measurement Guidelines hold that attribution should be suited to the campaign objective, supported by evidence, and disclosed transparently 6. The MRC Digital Audience-Based Measurement Standards go further, requiring that methodologies be disclosed to users of the measurement rather than buried in vendor documentation 7. Neither document targets SEO specifically, and that is the point. They describe what a defensible measurement artifact looks like regardless of channel.
Four disclosure practices belong at the front of every client-facing SEO report:
- Objective-suited attribution: state which model was chosen and why it fits the client's sales cycle and touch count, not the agency's preferred narrative.
- Evidence-supported crediting: show the conversion-path exploration that led to the model choice, so the weighting logic has an empirical basis rather than a rhetorical one.
- Transparent disclosure: name the tools in the stack, the identifiers used to stitch sessions to CRM records, and any known gaps such as consent-gated traffic or server-side event loss.
- Lookback-window discipline: publish the window applied to each conversion class and justify it against the observed path length.
Agencies that adopt this standard get two operational benefits. Procurement audits become shorter, because the answers are already in the report. And when a competing agency pitches the account with a flattering last-click number, the incumbent's disclosed methodology becomes the reason the client stays.
See How Leading Agencies Quantify SEO ROI Across Every Client
Get a personalized walkthrough of unified tracking solutions built to connect rankings, traffic, and pipeline impact—at scale. Benchmark your current reporting stack against proven, multi-account workflows.
If You Manage a Portfolio: Reporting Stack Cost and Time per Client
The four-layer stack is defensible in front of any CMO. It is also expensive to run at portfolio scale, and that cost lives in analyst hours rather than software licenses. An agency Head of SEO with 20 accounts is not deciding whether to adopt the stack. She is deciding how much of each analyst's month it will consume before margin disappears.
The variables that drive that cost are consistent across accounts. Setup time per client covers connecting Search Console, the behavior platform, the attribution model, and the CRM stitch. Ongoing monthly time covers pulling the data, reconciling identifiers, refreshing the attribution window, and producing the client-facing artifact. Neither figure is a fixed number, because sales-cycle length, event schema complexity, and CRM cleanliness vary by account. The table below uses ranges rather than invented benchmarks so the math holds up when a specific client's numbers are dropped in.
| Measurement Layer | Representative Tool Category | Setup Time per Account (hours) | Ongoing Reporting Time per Account per Month (hours) |
|---|---|---|---|
| Search visibility | Search Console + third-party visibility platform | 2–4 | 1–2 |
| Behavior analytics | GA4, Adobe Analytics, or privacy-first alternative | 4–8 | 2–4 |
| Attribution modeling | Analytics-native or standalone attribution | 3–6 | 2–3 |
| CRM-linked revenue | Server-side events + CRM conversion import | 6–12 | 2–4 |
Across a 20-client portfolio, the ongoing column is where the operating question sits. Even at the low end of each range, monthly reporting consumes roughly 140 to 260 analyst hours before a single slide is written. Search Console's query API narrows part of that gap by exposing performance data programmatically for centralized dashboards 2, but the attribution and CRM layers still require human reconciliation on most stacks.
Two decisions bend the curve:
- Standardize the event schema and identifier convention across every client onboarding, so the CRM stitch is a template rather than a custom build.
- Push each layer into a warehouse the same week it goes live, so reporting is a query against clean data rather than a monthly rebuild inside four separate interfaces.
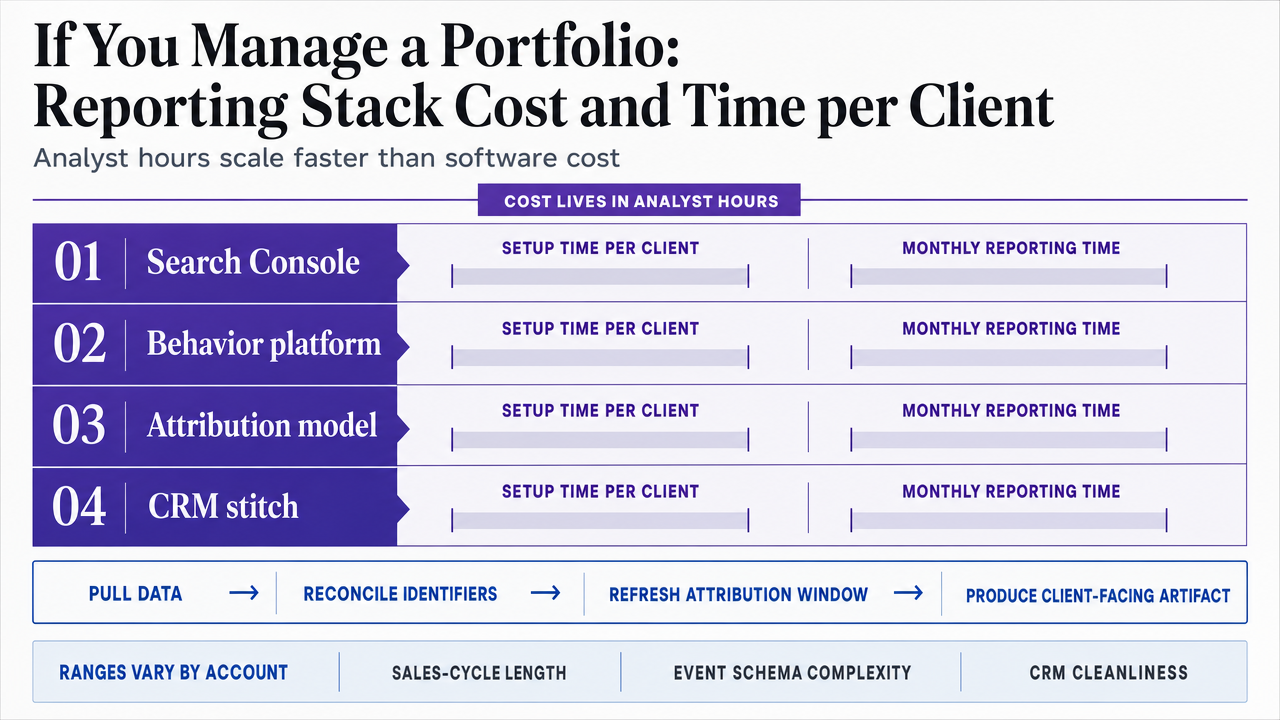 Reinforce the setup and monthly reporting time ranges by layer that appear in the article's table, since these numbers are explicitly cited in the surrounding prose
What These Tools Still Cannot Prove
Every layer of the stack answers a question. None of them answers the one a skeptical CFO eventually asks: would this revenue have arrived without the agency's work?
That is the incrementality question, and it sits outside what rank trackers, behavior platforms, and attribution models can prove on their own. WARC's 2026 coverage documents the same tension in retail media, where most brands still struggle with incrementality and cross-channel measurement despite investing in sophisticated attribution 10. IAB's framing of the current measurement environment is blunter: privacy constraints, fragmented proprietary platforms, and inconsistent cross-channel approaches make clean incrementality reads rare rather than routine 9.
Three claims sit in the gap:
- Whether a top-ranking page produced a conversion the client would have earned anyway through brand demand.
- Whether organic cannibalized paid clicks the client was already buying.
- Whether a content investment shifted long-term category demand rather than captured existing intent.
None of these show up on a standard SEO dashboard, and pretending they do is how a report loses credibility once a client's analytics team starts asking follow-up questions.
The honest posture at the QBR is to name the gap. Agencies that flag incrementality as an open question, and propose geo holdouts or scheduled content pauses as tests rather than claiming certainty, keep the room. Overclaiming closes it.
Orchestration: Sitting Above the Stack Instead of Adding to It
The four layers do not fail because the tools are weak. They fail because they are separate. Search Console lives in one tab, the behavior platform in another, the attribution model in a third, and the CRM in a fourth. An analyst reconciles them by hand, once a month, per client. That reconciliation is the bottleneck an agency Head of SEO cannot solve by buying another tracker.
Orchestration is the layer that sits above the stack rather than inside it. Its job is not to replace Search Console or Adobe Analytics. Its job is to read signals from all four layers, rank what deserves attention this week, route decisions for human approval, and push approved work back into execution without a briefing cycle. WARC's 2026 framing captures the direction of travel directly: measurement is collapsing the distance between insight and action, moving away from post-campaign reporting toward a real-time decision engine 11.
For agencies still buying rank trackers to solve a reporting problem, Vectoron operates as that orchestration band across content, SEO, backlinks, and call intelligence, with every recommendation routed for approval before it ships. The stack stays. The manual reconciliation does not.
Frequently Asked Questions
References
- 1.Introducing Search Generative AI performance reports in Search Console.
- 2.Query your Google Search analytics data | Search Console API.
- 3.Attribution Overview | Adobe Analytics.
- 4.Attribution Best Practices | Adobe Analytics.
- 5.Algorithmic Attribution | Adobe Analytics.
- 6.IAB/MRC Retail Media Measurement Guidelines.
- 7.Microsoft Word - MRC Digital Audience-Based Measurement Standards Final 1.0.
- 8.IAB State of Data 2024.
- 9.Modernizing MMM, Attribution & Incrementality with AI.
- 10.Retail media measurement gaps persist as brands prioritise sales over attribution.
- 11.Future of Measurement 2026: collapsing the distance between measurement and action.