
Key Takeaways
- Blog content generates B2B leads at roughly $68 versus the $198 channel average, but only pipeline-instrumented programs convert that CPL advantage into sourced revenue 3.
- Score topics by expected sourced revenue using search demand, buyer-role fit, and cluster-level close rate, then map each cluster to a specific CRM opportunity stage before drafting.
- Run demand capture and thought leadership as separate portfolios with distinct KPIs and conversion paths, since lead-gen-only content erodes trust and flattens pipeline over time 13.
- Close the reporting-to-attribution gap with a persistent lead-source taxonomy, influenced-touch tracking, and a rolling twelve-month window that captures blog-sourced deals with longer sales cycles 8.
The Economics That Separate Traffic Blogs from Pipeline Blogs
Blog content produces B2B leads at roughly $68 each, significantly lower than the $198 average cost per lead across B2B channels in 2024 3. This economic advantage, derived from a benchmark analysis combining Demand Gen Report and Content Marketing Institute figures, underscores the potential for blogs to function as pipeline assets rather than mere editorial outputs. While gated whitepapers average $134 per lead and the broader content marketing average is $92 3, blog content stands out as the most cost-effective scalable lead source.
Despite this clear CPL advantage, many blog programs fail to translate it into sourced pipeline. This isn't primarily a content quality issue but a systemic one. A blog that achieves high rankings might still generate traffic that never progresses to a CRM opportunity stage. Conversely, a smaller blog with strategically instrumented conversion paths can consistently feed qualified accounts into sales.
This distinction is crucial, as lead generation is a primary objective for B2B marketers. Eighty-five percent of B2B marketers identify lead generation as their most important content marketing goal 7. Furthermore, 45 percent of B2B companies in 2024 cite lead volume as their biggest challenge 6. Blog marketing thus occupies a unique position, offering the lowest CPL benchmark while addressing a critical pain point in the industry.
The following sections outline an operating model designed to leverage this CPL advantage: focusing on topic selection based on close probability, differentiating demand capture from thought leadership, establishing cadence as a foundational minimum, and measuring blog output by opportunities and revenue instead of just sessions.
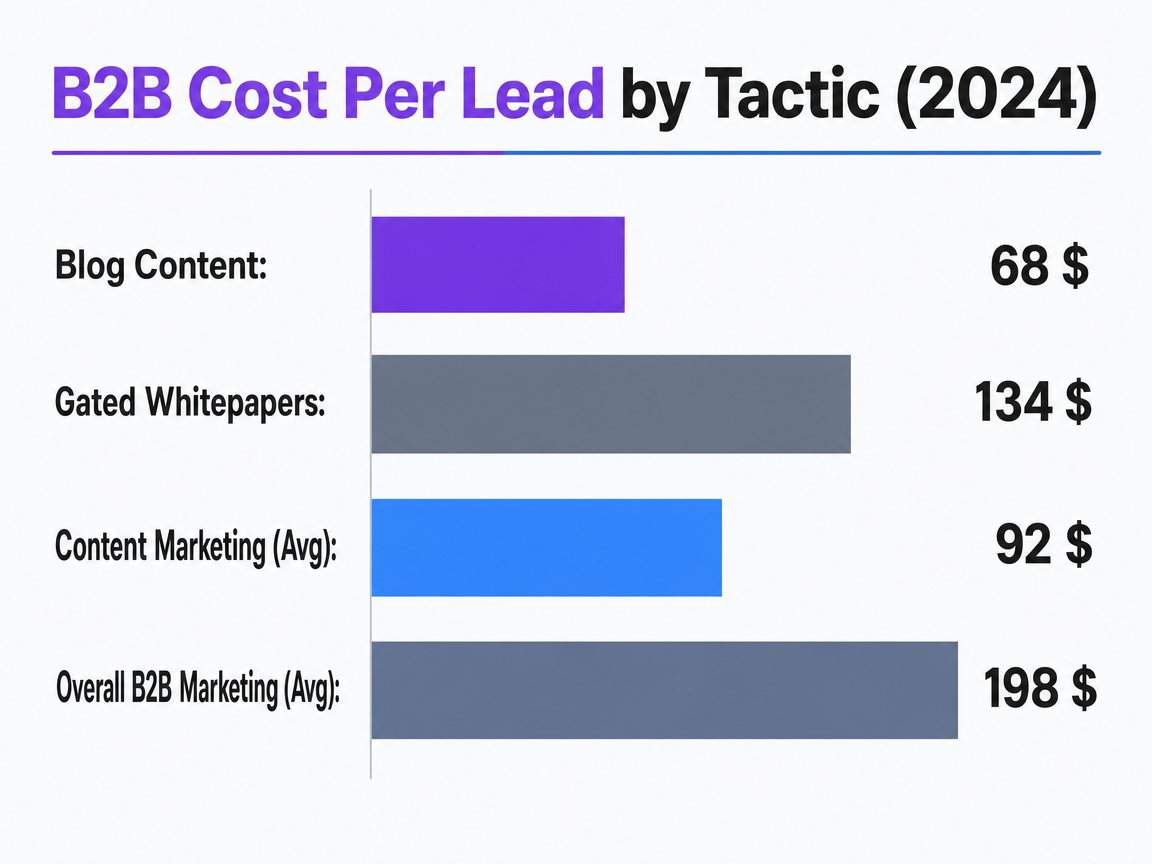 B2B Cost Per Lead by Tactic (2024)
A comparison of the average cost per lead for different B2B marketing tactics, showing blog content to be the most cost-effective.
Why Most Blog Programs Stall Before They Reach Pipeline
The stagnation in blog programs is typically a systemic issue, not a lack of content volume. While 81 percent of B2B marketers report measuring content performance, only about 70 percent of award-submitted thought leadership programs formally track pipeline impact 1, 8. This gap highlights where many blog programs falter: teams often report on traffic, engagement, and downloads but struggle to demonstrate sourced opportunities to stakeholders like the CFO.
Three common failure modes prevent blog programs from achieving pipeline impact:
- The first is topic selection driven solely by search volume. While this generates sessions, many visitors may lack buying authority or immediate intent. Without a scoring model that prioritizes topics based on downstream conversion behavior, the blog inadvertently optimizes for irrelevant metrics.
- The second is the absence of a clear connection between blog articles and the CRM. Most blog posts lead to newsletter sign-ups or related content, neither of which directly aligns with an opportunity stage. The 73 percent of B2B marketers who prioritize conversions as their top content metric often measure form fills that aren't integrated with sales-accepted lead criteria 21.
- The third is treating all blog content uniformly. Demand capture posts and thought leadership pieces serve distinct purposes, target different audiences, and have varying conversion timelines. However, they often share the same template, call-to-action, and success metrics, leading to an averaged performance view that obscures both successes and inefficiencies.
Each of these issues has a specific solution, which will be explored in subsequent sections: implementing close-rate-weighted topic scoring, mapping conversion paths to CRM stages, and adopting a two-portfolio operating model.
Close-Rate-Weighted Topic Selection
Scoring Topics on Downstream Close Probability, Not Search Volume
Search volume indicates supply, whereas close rate reflects demand. A topic scoring model based solely on search volume will generate traffic, but one built on close rate will drive revenue. The data supports this: inbound and SEO-sourced leads close at 14.6 percent, significantly higher than the 1.7 percent for outbound leads 12. This 8.6x difference is not marginal; it's the mathematical foundation for weighting topics based on the behavior of actual buyers, not just the potential audience.
This directly impacts topic selection. A high-volume query attracting researchers or non-buyers dilutes the close rate of any leads generated. Conversely, a lower-volume query targeting budget owners with an active problem maintains a higher close rate. Demand generation managers should evaluate each potential topic using three inputs: search demand, buyer role fit, and the observed downstream close rate for leads from similar existing posts.
The third input is frequently overlooked. It necessitates integrating the CMS with the CRM: tagging each post with the opportunities it sourced or influenced, then calculating the average close rate by topic cluster over time. Over several quarters, clear patterns emerge. For instance, product-comparison and pricing-methodology posts often attract late-stage readers who convert at rates near the 14.6 percent inbound benchmark 12, while broad category-education posts attract earlier-stage readers with lower close rates.
Topics should be ranked by expected sourced revenue per post: calculated by multiplying search demand, conversion rate, cluster-level close rate, and average deal size. While precision isn't the goal, consistent application of this formula can shift the editorial calendar from traffic optimization to pipeline optimization.
Mapping Topic Clusters to CRM Opportunity Stages
A topic scoring model is effective only when each cluster has a defined role within the CRM. Topics should be organized by the opportunity stages they support, not just by search themes.
Most B2B programs can categorize topics into three cluster roles:
- "Problem-aware" clusters address symptoms buyers recognize but haven't fully diagnosed. These posts target the top of the funnel and should offer conversion paths aligned with that intent, such as diagnostic tools or benchmark downloads.
- "Solution-aware" clusters compare approaches, frameworks, and vendor categories. Readers at this stage are closer to an opportunity, and conversion paths should encourage scoped conversations rather than just asset downloads.
- "Decision-stage" clusters cover pricing, implementation, procurement, and competitive comparisons. Conversion paths here should directly route to sales-accepted lead criteria.
Assigning a target CRM stage to each post before drafting ensures that topic decisions directly address the question: "Which opportunity does this post create or advance?" Posts that cannot answer this question should not be added to the calendar.
The CRM integration is equally vital. Each cluster requires a corresponding lead source value, UTM convention, and a first-touch or influenced-touch tag visible in opportunity reports. Without these, the 73 percent of B2B marketers who prioritize conversions 21 will continue to measure form fills instead of sourced opportunities. Cluster-to-stage mapping transforms a conversion metric into a pipeline metric, forming the operational bridge for the next section.
Experience Predictable Blog Pipeline Growth Firsthand
Publish real blog content and directly measure its impact on lead pipeline during your trial period.
The Two-Portfolio Model: Demand Capture and Thought Leadership
Why Lead-Gen-Only Content Erodes Pipeline
A blog solely optimized for form fills may boost short-term MQL counts but can lead to long-term pipeline decay. A 2024 industry study found that 69 percent of B2B tech respondents believe prioritizing content exclusively for lead generation undermines thought leadership and negatively impacts pipeline and revenue 13. Additionally, 78 percent in the same study emphasized the need for more substantial, thought-provoking content 13. These figures highlight a tangible cost, not merely a stylistic preference.
The mechanism is clear: when every post concludes with a gated download and every headline targets a bottom-funnel query, the blog loses the reader trust essential for late-stage conversions. Executives recognize this; 73 percent of executives in Edelman-LinkedIn research stated that an organization's thought leadership content is a more reliable indicator of its capabilities than its marketing materials 18. Content that resembles a lead form fails to meet this standard.
Operationally, this results in a shrinking top of the funnel. Programs that only harvest late-stage demand without nurturing earlier stages see sourced pipeline flatten after a few quarters, often leading to reliance on paid channels. The issue isn't the blog itself, but the imbalance in the content portfolio.
Separate KPIs, Separate Conversion Paths
Effective blog management requires two distinct operating models for demand capture and thought leadership content, even if they share the same publishing platform.
Demand capture posts target readers actively comparing solutions. Key Performance Indicators (KPIs) for these posts include conversion rate to sales-accepted lead, MQL-to-SQL rate, and cost per opportunity. Conversion paths should lead to demos, consultations, or pricing discussions. Cadence is determined by search demand and competitive coverage. Success is measured within 30 to 90 days of publication, with opportunities created being the primary metric, not sessions.
Thought leadership posts engage readers who are not yet actively shopping. Their KPIs differ: subscriber growth on owned channels, return-visitor rates, executive-role traffic share, and assisted-touch presence in closed-won deals over a six-to-twelve-month period. Conversion paths for thought leadership should encourage further reading, newsletter subscriptions, or event registrations, not immediate demo requests. This distinction is reflected in award-submitted thought leadership programs: 85 percent track lead generation, 70 percent track pipeline impact, 75 percent measure content downloads, and 80 percent track website traffic 8. Programs that report on pipeline understand the need to avoid forcing all posts through a single conversion goal.
Demand generation managers who implement both portfolios shift their focus from whether a post "performed" to identifying its portfolio slot and whether it met that slot's specific KPI. Posts that fail to meet either are not underperformers but are likely miscategorized.
The Hidden Buyer Argument for Assisted Pipeline Reporting
First-touch attribution inherently undervalues thought leadership content. It credits the final click before a form fill, disregarding the preceding engagement that led to that click. This reporting bias obscures the influence of key readers.
Research by Edelman-LinkedIn reveals that 75 percent of global B2B buyers and C-suite leaders reported that a specific piece of thought leadership content prompted them to explore a product or service they hadn't previously considered. Furthermore, 23 percent ultimately engaged with the publishing organization 17. These buyers typically don't convert directly on the influential article. Instead, they read, leave, research the vendor later, and enter the pipeline via a branded search or a referral.
A measurement system that only credits the branded-search visit attributes the pipeline win to "direct" or "organic - brand," categorizing the thought leadership post as low-converting traffic. This makes the blog appear as a cost center, despite its actual impact on the buyer's journey.
Assisted-touch reporting resolves this by tagging thought leadership content with an influenced-touch attribute in the CRM. Reporting on the percentage of closed-won opportunities that involved at least one thought leadership content view within the past twelve months provides a crucial metric. Tracking this quarterly ensures the continued funding of the thought leadership portfolio by demonstrating its contribution to pipeline.
Cadence as a Floor, Not a Ceiling
The common recommendation of one to two posts per month for blog cadence should be considered a minimum, not a target. Companies maintaining this rate generate 67 percent more sales opportunities than those that don't, according to a synthesis of B2B blogging performance data 12. This statistic indicates that anything below this minimum measurably reduces pipeline, but it doesn't suggest that this rate is optimal.
The operational question isn't "what's the minimum cadence for a lift?" but "what production capacity is needed to cover the topic clusters that feed opportunity stages?" A demand generation manager overseeing three decision-stage clusters, two solution-aware clusters, and an active thought leadership portfolio cannot adequately cover this scope with just two posts per month. This necessitates either a higher production rate or a narrower portfolio focus.
Production capacity, rather than editorial ambition, is often the limiting factor. In-house teams frequently encounter ceilings due to constraints like subject-matter-expert interview time, editorial review cycles, and the challenge of finding writers with category expertise. The 45 percent of B2B companies citing lead volume as their biggest challenge 6 are often capacity-constrained, not strategy-constrained.
Two primary levers can increase this capacity. The first is optimizing subject-matter-expert extraction: using recorded interviews transcribed and structured by an editor, rather than requiring SMEs to draft posts. The second is leveraging production tooling that streamlines research, drafting, and editorial review without compromising the quality that late-stage readers expect. Cadence is fundamentally a capacity problem before it becomes a calendar problem.
Measurement Discipline: Closing the Reporting-to-Attribution Gap
Many blog programs falter in their measurement practices, not due to a lack of tracking, but because they effectively measure the wrong metrics.
An analysis of B2B thought leadership programs submitted for 2024 marketing awards revealed that while 85 percent tracked lead generation, 80 percent tracked website traffic, and 75 percent tracked content downloads, only 70 percent formally tracked pipeline impact 8. This 15-point difference between lead generation reporting and pipeline reporting represents the critical reporting-to-attribution gap – the disparity between marketing dashboard metrics and the revenue insights a CFO seeks.
Bridging this gap requires three specific instrumentation decisions.
- Implement a lead-source taxonomy that persists through the sales handoff. Every blog-sourced lead needs a CRM value that remains consistent across MQL, SQL, opportunity creation, and closed-won stages. Without this persistence, the blog's contribution vanishes once a sales development representative logs the initial call. Programs that lose attribution at handoff often report only on form fills, explaining why the 73 percent who prioritize conversions 21 frequently cannot link that number to sourced revenue.
- Track influenced-touch alongside first-touch attribution. Relying solely on first-touch undervalues thought leadership, while last-touch alone undervalues top-of-funnel demand capture. A blended, quarterly view reveals which clusters source opportunities and which influence them. Both contributions are vital and belong in the pipeline report.
- Attribute revenue using a rolling twelve-month window. Blog-sourced opportunities typically have longer sales cycles than paid-search leads. A monthly attribution report will consistently underrepresent the blog's impact. A quarterly report with a trailing twelve-month view effectively captures the compounding revenue that content generates, especially after the initial six months, which is often when programs are either defunded or their value finally recognized.
The operational imperative is clear: instrument the CRM before creating new content. Reporting without attribution is merely bookkeeping; attribution without proper instrumentation is speculative.
See How AI-Driven Blog Strategies Deliver Measurable Pipeline Gains
Connect with our team to review benchmarks for blog-driven lead quality and pipeline contribution in high-stakes verticals—plus get a walkthrough of coordinated multi-channel execution workflows for agencies and enterprise teams.
Blog Unit Economics: An Illustrative Cost-Per-Closed-Deal Model
The economic justification for a blog becomes concrete when CPL and close rate are integrated into a single downstream metric. Existing benchmarks allow for this calculation without needing internal assumptions.
Consider two core benchmarks: blog content generates B2B leads at approximately $68 each, compared to a $198 overall B2B average, $92 for general content marketing, and $134 for gated whitepapers 3. Additionally, inbound and SEO-sourced leads close at 14.6 percent, while outbound leads close at 1.7 percent 12. Multiplying the CPL by the inverse of the close rate yields an implied cost per closed deal at the lead-source level.
Using the blog CPL of $68 and a 14.6 percent close rate, the implied cost per closed deal is approximately $466. Applying the same 14.6 percent inbound close rate to the overall B2B average CPL of $198 increases this figure to roughly $1,356. If the 1.7 percent outbound close rate is applied to the $198 CPL, the implied cost per closed deal exceeds $11,600. This demonstrates that the blog is not just incrementally cheaper, but an order of magnitude more cost-effective at the deal level, not just the lead level.
These figures are illustrative, not predictive forecasts. Actual deal costs are influenced by MQL-to-SQL rates, sales cycle length, and the assisted-touch pipeline that first-touch reporting often misses. The key takeaway is directional: when building a business case for blog investment, the defensible unit is cost per closed deal, and all inputs are traceable to published benchmarks rather than internal assumptions.
Building the Production System
A blog that consistently generates pipeline functions as a production system, not merely an editorial calendar. This distinction is vital because the strategies discussed—close-rate-weighted topic scoring, cluster-to-stage mapping, the two-portfolio model, and instrumented attribution—all depend on the operational capacity to execute them consistently.
Such a system comprises five key components:
- A topic intake process that scores candidates based on expected sourced revenue, not just search volume.
- A subject-matter-expert extraction workflow that converts expert knowledge into drafts efficiently, minimizing SME time commitment.
- An editorial layer that upholds the quality standards expected by late-stage readers, crucial given that 73 percent of executives consider thought leadership content a more reliable indicator of vendor capability than marketing materials 18.
- A publishing layer with a persistent lead-source taxonomy integrated into the CRM from the outset.
- A measurement layer that reports assisted-touch pipeline over a rolling twelve-month window.
Most in-house teams manage only a few of these components, outsourcing the rest, which often leads to inconsistent cadence and attribution gaps. The 45 percent of B2B companies struggling with lead volume in 2024 6 are frequently operating with incomplete systems rather than underfunded ones.
The practical approach is to identify the weakest component in the current quarter and address it before increasing post volume. Platforms like Vectoron are designed to consolidate these components into a single workflow, but the underlying principle remains: a blog generates pipeline when the system consistently produces posts, not just when the calendar dictates.
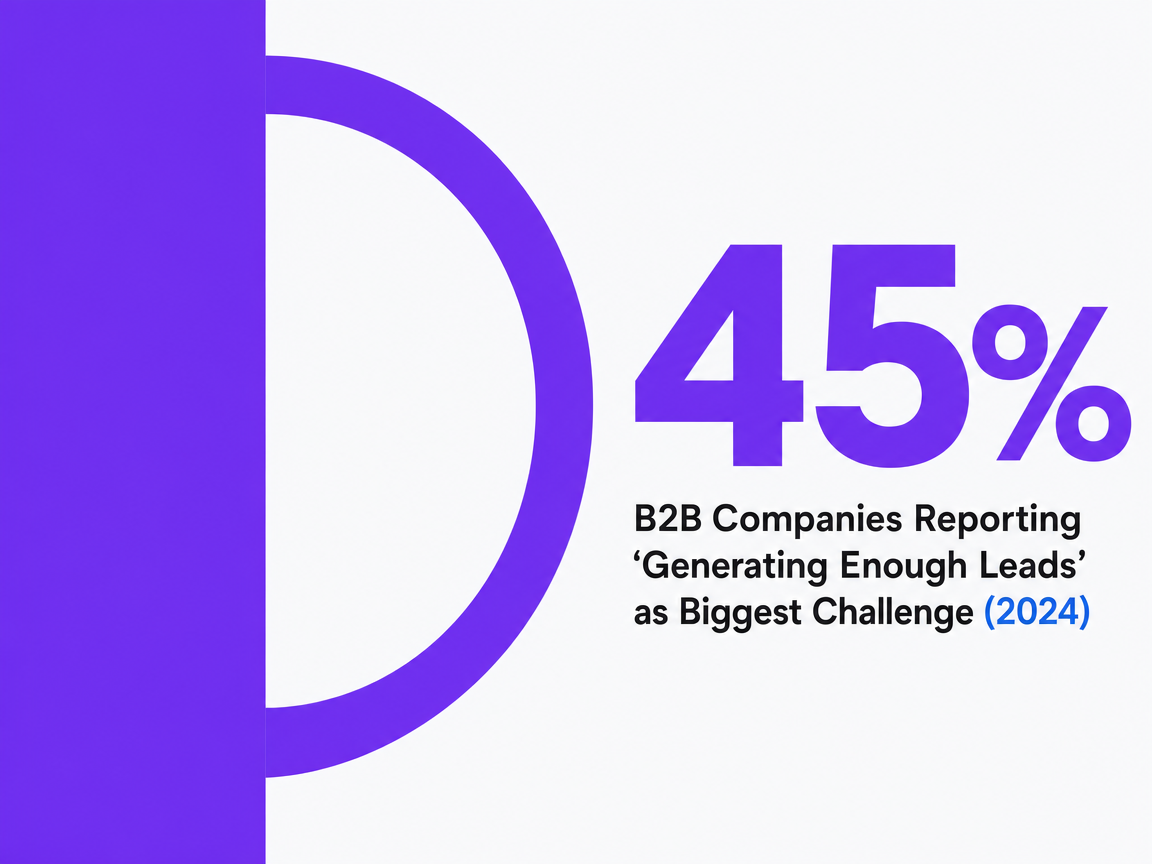 B2B Companies Reporting 'Generating Enough Leads' as Biggest Challenge (2024)
B2B Companies Reporting 'Generating Enough Leads' as Biggest Challenge (2024)
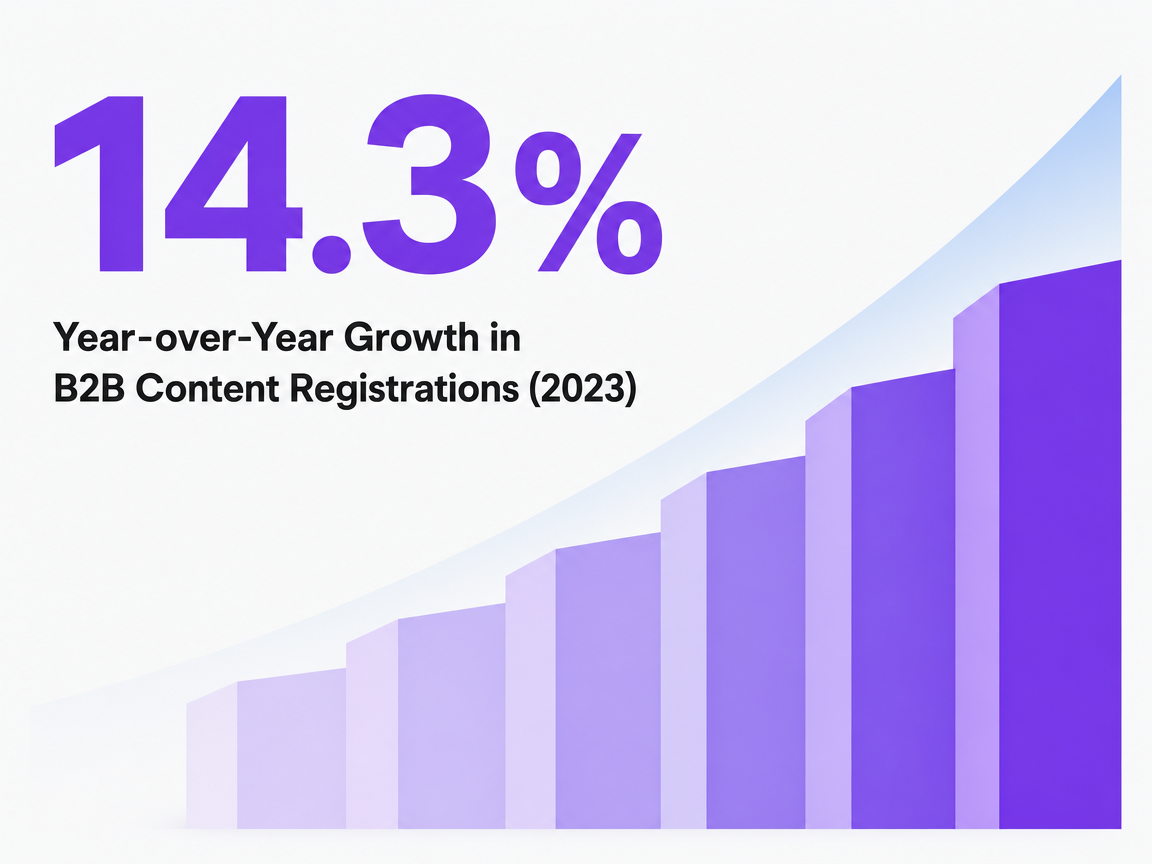 Year-over-Year Growth in B2B Content Registrations (2023)
Year-over-Year Growth in B2B Content Registrations (2023)
Frequently Asked Questions
References
- 1.13th Annual B2B Content Marketing Benchmarks, Budgets, and Trends: Insights for 2023.
- 2.The 2023 B2B Content Marketing Report | Study.
- 3.B2B Marketing ROI Benchmarks: 2024 KPIs.
- 4.2024 State of B2B Content Consumption & Demand Report.
- 5.Lead Generation Statistics 2026: Benchmarks & Trends.
- 6.67 Lead Generation Statistics and Trends for 2026.
- 7.20 B2B Content Marketing Statistics for 2024 and Beyond.
- 8.The State of B2B Thought Leadership: Analysis of 2024 Marketing Awards.
- 9.Corporate blogs, social media links and firm performance: A study of Fortune 500 companies.
- 10.Corporate blogs, social media links and firm performance.
- 11.Corporate blogging and microblogging.
- 12.Blogging ROI: 100 stats for Content Marketers.
- 13.Groundbreaking Report Exposes Crisis in B2B Tech Thought Leadership: Only 44% Achieve Success.
- 14.Reach Beyond The Ready: B2B Thought Leadership Research.
- 15.Revenue And Business Impact: Content-Led Lead Generation Statistics.
- 16.Lead Generation Benchmark Report.
- 17.How Thought Leadership Gets Out-of-Market B2B Buyers Back Into the Game.
- 18.The Impact of Thought Leadership on Engaging Out-of-Market B2B Buyers.
- 19.Unlocking the Power of Hidden Buyers: 2025 Edelman-LinkedIn B2B Thought Leadership Impact Report.
- 20.The Battle for B2B Influence is Won Before Sales Walks In.
- 21.B2B Content Marketing Benchmarks, Budgets, and Trends: Outlook for 2024.
- 22.Blogging for Lead Generation: Key Statistics (2025).