
Key Takeaways
- Standard rank reports collapse in QBRs because average position is presented as a score when Google defines it as an impression-weighted average across whatever dimensions were selected 1.
- Average position is a distribution, not a scoreboard; defensible slides show median, percentile bands, and the exact device, country, and date filters that produced the figure 1, 3.
- A credible reporting stack layers Search Console visibility, GA4 and CRM outcomes, and, where feasible, incrementality evidence, with each layer answering a distinct question 11, 12, 15.
- Attributed conversions in GA4 are not incremental conversions; label them accordingly and reserve the word incremental for outcomes backed by a controlled test 16.
- When traffic drops, run Google's dimension-by-dimension diagnostic (query, page, country, device, search appearance) and overlay the date against confirmed ranking system updates before assigning cause 13, 14.
- A QBR-ready report sequences visibility distributions, attributed outcomes with offline tracking, a dated change log, and two or three scoped tests for the next quarter 12, 13, 17.
- Portfolio economics force a choice between manual pulls, API-extracted templates, and approval-governed automation; the retainer defense lives in the annotation, not the chart 1, 3, 14.
- Productizing the extract-report-recommend loop means fixing handoffs: scheduled API extraction, pre-filled templates, and an exception queue where strategists approve tests rather than rebuild decks 1, 3, 14.
The QBR Question That Breaks Standard Rank Reports
A client opens the quarterly business review with one sentence: "Where do we rank for commercial roofing contractors Dallas?" The strategist pulls up a slide showing position 4.2. The client squints and says their nephew just searched the term and saw them at 11. The next twenty minutes evaporate into a defense of the number instead of a conversation about pipeline.
This is the moment most agency rank reports fail. Not because the data is wrong, but because the number was presented as a score when Google defines it as an average. Search Console reports average position as the average topmost placement a site held across its impressions for a query, grouped by whatever dimensions the requester selects 1. One person refreshing in a different ZIP code on a different device is a sample of one against a distribution of thousands.
The operational problem for a head of SEO running 5 to 50 accounts is not learning how to check a rank. That takes five minutes in the Performance report. The problem is building a reporting layer that survives the QBR without a senior strategist rewriting the narrative on every account every quarter.
That requires reframing the deliverable. A defensible report connects three layers: visibility from Search Console, outcomes from GA4 and the CRM, and, where volume allows, incrementality evidence 11, 12, 15. The rest of this piece walks through how to productize that stack so the next QBR starts with revenue, not with a position argument.
Average Position Is a Distribution, Not a Score
Search Console does not publish a rank. It publishes a performance table. Each row contains four metrics for the date range and dimensions selected: clicks, impressions, click-through rate, and average position 1. Average position is the average of the topmost placement the property held across every impression counted, grouped by whatever combination of query, page, country, device, and date the operator requests 1.
That definition carries three consequences most client decks ignore.
- First, the number is an average over impressions, not an average over searches. A query that fires 10,000 impressions for a client and 100 impressions for a competitor is weighted accordingly. A property that showed at position 3 for 9,000 impressions and position 20 for 1,000 impressions reports an average position of roughly 4.7. No single user ever saw position 4.7.
- Second, the number is sensitive to the dimension slice. The same query can report average position 4 at the property level, 2 when filtered to desktop in the United States, and 11 when filtered to mobile in a secondary market. Search Analytics returns different values because it is aggregating different impression sets 1, 3. A client checking from their phone in a city the agency never optimized for is sampling a slice the report never isolated.
- Third, the data is bounded by Search Console's aggregation and anonymization. The API returns rows the requester asks for, filtered and grouped by the dimensions selected, which means a 90-day pull and a 28-day pull produce different averages for the same keyword even when nothing changed on the SERP 2, 3.
The practical implication for agency reporting is to stop quoting a single average position as if it were a scoreboard. A defensible rank slide shows the distribution: the median position, the position at the 25th and 75th percentile of impressions, the device split, and the country or city filter the number represents. When the client's nephew sees position 11, the report already contains position 11 as part of the mobile tail, and the conversation moves to what share of impressions sit in the top three and what that share converted to in clicks and CTR 1.
The correction is simple to install and difficult to walk back once a client sees it. Lead with impressions and clicks as the volume signals Google itself identifies as the ultimate measures of search success 14. Treat average position as a diagnostic for where impressions are concentrated, not as the headline. Annotate every position figure with the exact dimension filter used to produce it. The slide stops being a number to defend and starts being a map of where the property actually shows up.
The Three-Layer Measurement Stack
Layer 1 — Visibility From Search Console
Search Console is the only source Google itself publishes for how a property appears in its search results, and Google is explicit that the Performance report is the correct starting point for understanding crawling, indexing, and search performance 11. For an agency, Layer 1 is scoped to what happens before the click: how often a property surfaced for which queries, on which devices, in which countries, and at what topmost position across those impressions 1, 11.
Four metrics carry the layer. Impressions quantify exposure. Clicks quantify selection. CTR measures the efficiency of the title and snippet given the position earned. Average position describes where the property tended to show, weighted by impressions, within the dimension filter requested 1. Google treats impressions and clicks as the ultimate measures of search success in its own debugging guidance, which is a useful anchor for client conversations that drift toward position as the headline 14.
The operational discipline is to extract the layer the same way every month for every account. The Search Analytics API returns rows grouped by any combination of query, page, country, device, and date, which lets an agency build one extraction template and apply it across the book rather than clicking through the interface per client 1, 3. Google's own guide recommends querying search appearance first and then layering additional filtered queries to capture dimension-level depth 2.
Layer 1 ends at the click. Everything after the click belongs to Layer 2.
Layer 2 — Outcomes From GA4 and the CRM
Search Console measures what Google showed and what users clicked. GA4 measures what those users did on the site. The two systems answer different questions, and Google states the boundary directly: Search Console focuses on activity before a user reaches the site from Google Search, while Analytics measures interactions on the website or app 12. A click in Search Console and a session in GA4 are not the same unit and will not match in a side-by-side table 12.
Layer 2 translates clicks into outcomes the client's finance team recognizes. GA4 key events — form submissions, calendar bookings, phone taps, chat starts, qualified lead events fired from the CRM — carry organic traffic from a landing page into a defined business action. From there, the CRM extends the chain: which leads qualified, which converted, which produced revenue, and which produced repeat revenue. Attribution, in the formal sense used by the UK competition and advertising reports, is the exercise of assigning credit for those downstream outcomes to the preceding marketing interactions 4, 10. The 2019 government framework states this plainly: attribution measures the monetary impact of communications on real business goals, including sales, profit, revenue, and retention 10.
Two practical cautions shape the layer. First, platform attribution tracks exposure across websites and devices under constraints, and matching that exposure to subsequent actions is where most reporting breaks down 9. Second, where offline conversions dominate — phone calls, walk-ins, scheduled consultations — digital metrics such as visits and clicks have to be supplemented. The DHSC campaign framework recommends unique phone numbers or URLs to attribute actions to specific materials, which is exactly the pattern that lets a legal, dental, or home services client tie an organic landing page to a booked appointment 17.
Layer 2 answers whether the visibility produced business. It does not yet prove the business would not have happened anyway.
Layer 3 — Incrementality Evidence
Layer 3 answers the question that attribution cannot: how many of the outcomes credited to organic search would have occurred without the SEO program. Attribution distributes credit for conversions that already happened; incrementality asks what would have happened under a counterfactual with no activity 15. Google and WARC's effectiveness framework calls user- and geo-experiments the gold standard for incrementality where feasible, with attribution and marketing mix models providing complementary coverage rather than a substitute 8. The Modern Measurement playbook makes the same distinction operational: attribution reports attributed sales, while incrementality experiments estimate incremental sales at a specific point in time 16.
This layer used to be optional in agency reporting. It is becoming standard. WARC's 2025 measurement report finds that the share of marketers using experiments to evaluate effectiveness doubled from 18% to 36%, driven in part by broader access to testing tools in social and retail media platforms 7.
For SEO specifically, Layer 3 is harder than for paid channels. Experiments can be difficult for low-volume websites, long sales cycles, or changes that cannot ethically or operationally be withheld from a market 15. The practical implementations that do work for organic programs tend to be geo-based: a technical or content change rolled out across a matched set of location pages or regional landing pages while a comparable set holds steady, measured over a defined window.
The reporting posture matters as much as the method. The Modern Measurement playbook is explicit that observed outcomes, modeled attribution, and experimental lift should be reported separately rather than blended into a single figure 16. For a QBR deck, that means three distinct lines: Search Console impressions and clicks for visibility, GA4 and CRM counts for attributed outcomes, and, where a test ran, an incremental lift estimate scoped to the markets and window tested. Clients that see the three layers presented as distinct inputs stop arguing about rank and start debating budget allocation, which is the conversation an agency wants to be in.
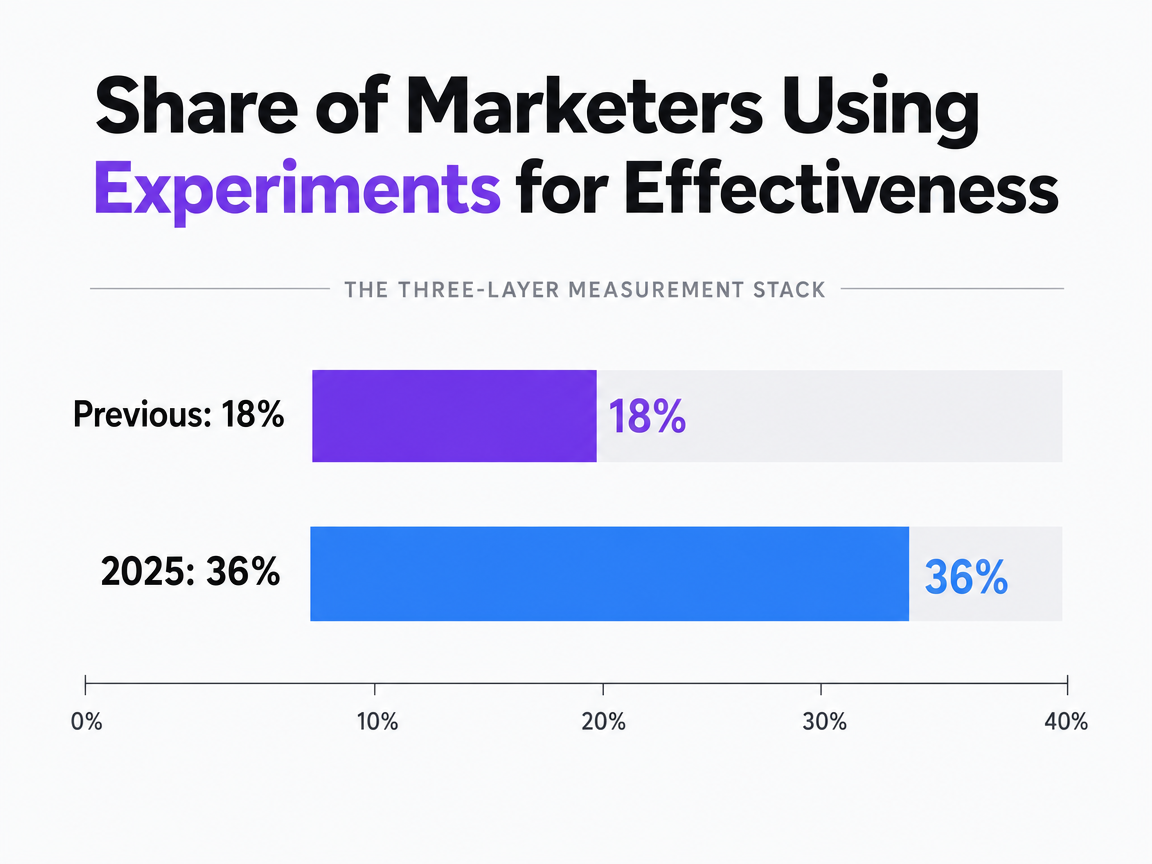 Share of Marketers Using Experiments for Effectiveness
Compares the percentage of marketers using experiments to evaluate effectiveness before and in 2025, showing a doubling from 18% to 36% as reported by WARC.
Test Real-Time Google Rankings With Full Access
Validate ranking improvements and client ROI using live campaigns during your free trial period.
Why Attributed Conversions Are Not Incremental Conversions
Attribution and incrementality answer different questions, and conflating them is the single most common way agency ROI slides overstate the case for SEO. Attribution assigns credit for conversions that already occurred to the preceding marketing interactions, including organic clicks on branded or near-branded queries that a buyer would have reached anyway 4, 10. Incrementality asks a narrower, harder question: how many of those conversions would have failed to occur without the activity 15. The Modern Measurement playbook draws the boundary explicitly, noting that attribution produces attributed sales while incrementality experiments estimate incremental sales at a specific point in time 16.
The gap between the two numbers can be large, and paid social provides the clearest published analog. A 2025 FTC-hosted experimental study on Meta measured cost per incremental customer rather than cost per attributed customer and found a median of $43.88, with a 10th-to-90th percentile range from $5.03 to $172.77 under the targeting conditions studied 6. The study is scoped to Meta paid acquisition, not organic search, and the figures should not be ported to an SEO deck as a benchmark. What transfers is the shape of the finding: when the same conversion is measured by attribution and by experiment, the two numbers routinely disagree, sometimes by an order of magnitude.
For an organic program, the practical reporting posture is to label GA4 and CRM figures as attributed outcomes rather than caused outcomes, and to reserve the word incremental for lines backed by a test. Clients that absorb this distinction stop treating a dip in attributed conversions as proof the program failed, because they already understand attributed numbers as a credit-assignment artifact, not a causal measurement 16. The reporting conversation shifts toward which queries, pages, and markets justify the next test, which is where the agency wants the retainer debate to live.
A Diagnostic Script for When Traffic Drops
When organic clicks fall, the client email usually arrives within hours and the implicit question is whether the agency broke something. Google's own guidance resists that framing: impressions and clicks are the ultimate measures of search success, and the first move is to compare affected dimensions in Search Console before assigning cause 14.
A repeatable script keeps the conversation evidence-based. Open the Performance report and compare the affected window against a matched prior period. Then isolate the drop by dimension in sequence: query, page, country, device, and search appearance 14. A fall concentrated in one country or one device points to a market or crawl issue. A fall concentrated in a cluster of pages points to indexing, canonicalization, or a specific content change. A fall spread evenly across queries and pages, arriving on a single date, usually points to a ranking system update rather than anything the agency touched that week 13.
Two checks run in parallel. Confirm indexing status for the affected URLs and review Search Console for manual actions, security issues, or crawl anomalies 11, 14. Then overlay the drop date against Google's ranking system change history. Google has moved Helpful Content into its core ranking systems and continues to roll core updates that reorder results across hundreds of billions of pages 13.
The client output is a three-line note: what dimension the drop sits in, what external event or site change aligns with the date, and what the next 14-day diagnostic will test. That note replaces the defensive QBR exchange with a documented investigation already underway.
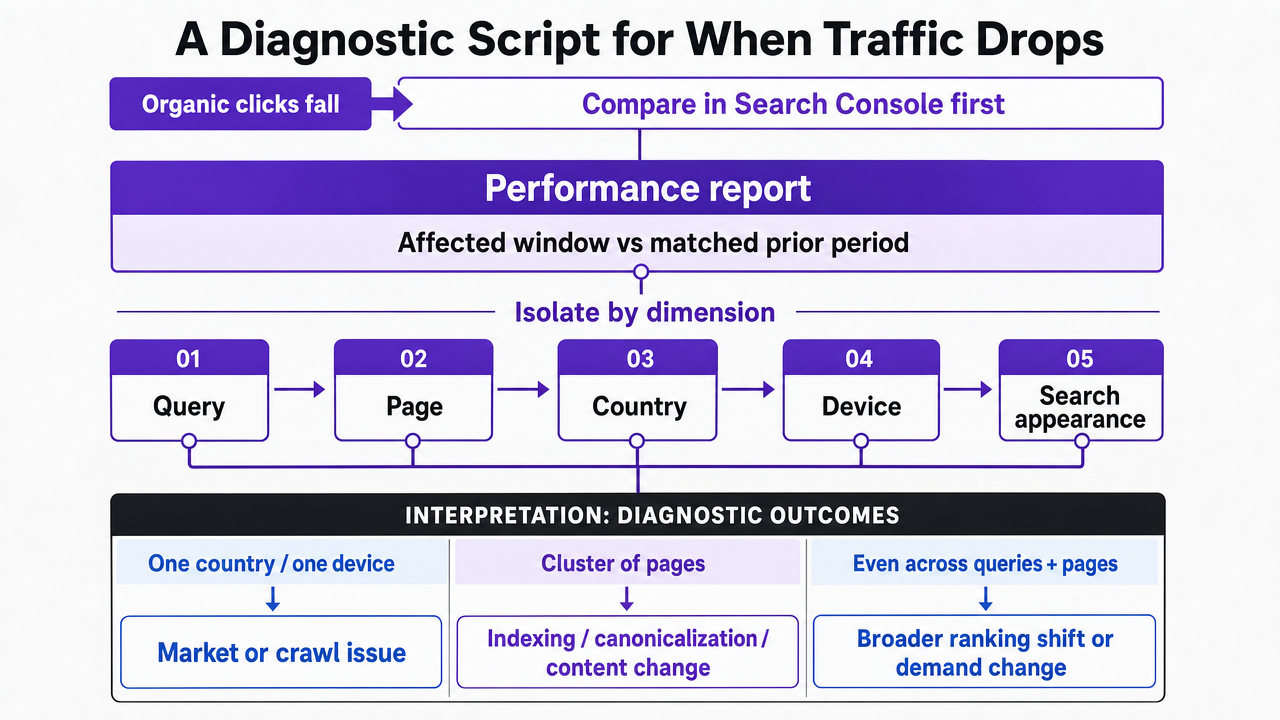 Visualize the sequential diagnostic workflow Google recommends when organic clicks fall, as described step-by-step in the section
What a QBR-Ready Rank and ROI Report Actually Contains
A QBR deck earns its retainer when it answers three questions in order: where the property showed up, what that visibility produced, and what the next quarter's investment should test. The content follows the three-layer stack, but the sequencing and the omissions are what separate a defensible report from a dashboard dump.
The visibility section opens with impressions and clicks over the reporting window, segmented by the dimension that matters most to the client — usually market or page cluster. Average position appears next, annotated with the exact dimension filter used, and accompanied by the distribution rather than the single average: share of impressions in positions 1 to 3, 4 to 10, and 11+ 1, 11. CTR is reported against position band, which turns a flat number into a title-and-snippet diagnostic.
The outcomes section pivots to GA4 key events and CRM-qualified leads tied to organic landing pages, with unique phone numbers or tracked URLs carrying offline conversions into the same table 12, 17. The figures are labeled attributed, not caused 16.
The third section covers what moved and why. A dated change log lists content shipped, technical fixes deployed, and Google ranking system updates confirmed in the window 13. Any traffic anomaly is paired with the dimension-level diagnostic that explains it 14.
The omissions matter as much. No raw rank-tracker screenshots. No blended ROI number that fuses attributed and modeled figures. No position quoted without its dimension filter. The deck closes with the two or three tests the next quarter will run, each scoped to a market, page cluster, or query set the current data flagged as worth the budget.
See How Leading Agencies Quantify Google Rankings and Client ROI—at Scale
Request a walkthrough of automated rank tracking and transparent ROI reporting workflows proven to help agencies demonstrate measurable impact across portfolios—without increasing manual workload or overhead.
If You Manage a Portfolio: Reporting Workflow Economics
The economics change once a head of SEO is responsible for 20, 30, or 50 accounts rather than one. Manual Performance report pulls that take an hour per client turn into a week of strategist time, and the week recurs every month. The Search Analytics API exists precisely to collapse that work: one authenticated extraction routine returns clicks, impressions, CTR, and average position grouped by any combination of query, page, country, device, and date across every property in the account 1, 3. The question for an agency head is not whether to automate extraction. It is which delivery model the retainer can defend when a strategist's time is the binding constraint.
Three models dominate. Each trades hours, risk, and ceiling differently.
| Delivery Model | Hours per client per month | Strategist review time | Cost of a missed algorithm-change annotation | Scalability ceiling (clients per strategist) ||---|---|---|---|---|| Manual per-client reporting | High | High | High — anomalies surface in the QBR, not the report | Low || API-extracted templated reporting | Low | Moderate | Moderate — anomalies flagged, context still manual | Moderate || Approval-governed automated reporting | Low | Low, concentrated on exceptions | Low — change log and dimension diagnostic generated with the report | High |
The table uses variables because the honest answer depends on account complexity, vertical, and how many markets each property serves. What transfers across agencies is the shape: manual reporting scales linearly with headcount, API extraction breaks the linearity on data pulls but still consumes strategist time on narrative and diagnostics, and approval-governed automation moves the strategist from report assembly to exception review.
The hidden line item is the missed annotation. A core ranking system update lands, a client's traffic shifts, and the QBR arrives three weeks later with no dated note explaining what moved 13. In a manual workflow the annotation gets skipped because the strategist ran out of hours. In an automated workflow the annotation is a required field attached to the dimension-level diagnostic Google itself recommends running when clicks fall 14. The retainer defense is the annotation, not the chart.
Productizing the Extract-Report-Recommend Loop
The extract-report-recommend loop is three jobs stitched together: pull Search Console data by dimension on a schedule, assemble a QBR-shaped narrative with change-log annotations and attributed outcomes, and surface the two or three recommendations worth the client's next budget cycle 1, 2, 3. Each job has a different failure mode:
- Extraction fails silently when API quotas or date windows shift.
- Reporting fails when a strategist runs out of hours before writing the annotation.
- Recommendation fails when the person closest to the data is not the person building the deck.
Productizing the loop means fixing the handoffs rather than buying a prettier rank tracker. Extraction becomes a scheduled routine against the Search Analytics API, returning rows grouped by query, page, country, device, and date for every property in the book 1, 3. Reporting becomes a template that pre-fills visibility distributions, GA4 key events, CRM-qualified leads, and a dated change log tied to Google ranking system updates 12, 13, 17. Recommendation becomes an exception queue: the strategist reviews flagged anomalies and approves the next tests rather than rebuilding the deck from scratch.
The retainer defense that survives this redesign is the one the strategist did not have time to write before — the dimension-level diagnostic Google itself recommends when clicks fall, attached to every anomaly before the client sees the report 14. That is the loop worth productizing, and it is where approval-governed automation earns its place in the stack.
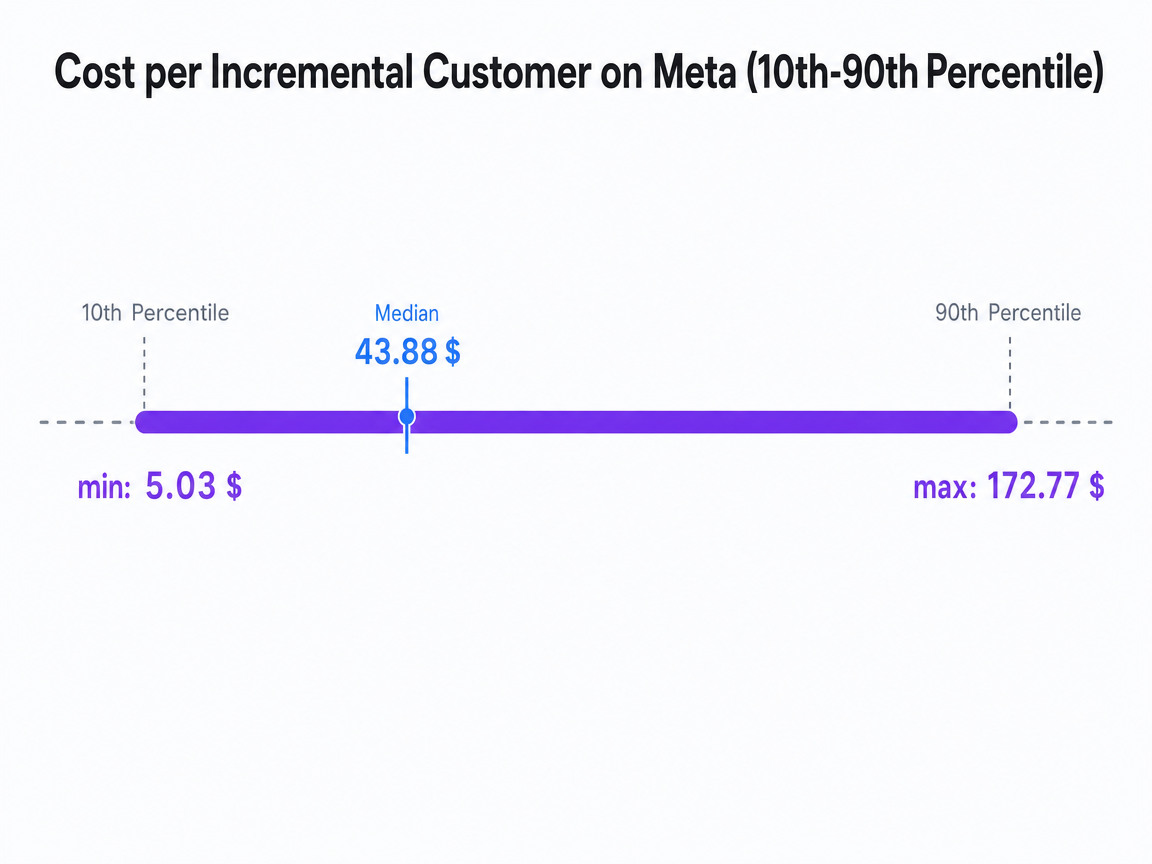 Cost per Incremental Customer on Meta (10th-90th Percentile)
Based on a large-scale experiment on Meta, this range represents the 10th to 90th percentile for cost per incremental customer. The median cost was $43.88.
Frequently Asked Questions
References
- 1.Search Analytics: query | Search Console API.
- 2.Getting your performance data | Search Console API.
- 3.Search Analytics | Search Console API.
- 4.Appendix O: measurement issues in digital advertising.
- 5.Estimating the Value of Offsite Data to Advertisers.
- 6.Estimating the Value of Offsite Data to Advertisers on Meta.
- 7.The Future of Measurement 2025: experiments, price, and AI on the rise.
- 8.The Effectiveness Equation.
- 9.Online platforms and digital advertising.
- 10.Online advertising in the UK.
- 11.How To Use Search Console.
- 12.Google Search Console .
- 13.A Guide to Google Search Ranking Systems | Documentation.
- 14.Debugging drops in Google Search traffic.
- 15.Get a grip on marketing incrementality.
- 16.Modern Measurement.
- 17.Evaluate campaign performance.