
Key Takeaways
- Map competitor visibility by segmenting their ranking queries into informational, evaluative, and transactional buckets, then size each cluster using published B2B conversion ranges 5.
- Inventory rival content as named artifacts — pricing pages, ROI calculators, proof grids, comparison pages — and score each against Google's helpful-content criteria rather than word count 10.
- Reverse-engineer conversion paths from observable CTAs and form friction, then translate each into revenue using MQL-to-Pipeline at 21% and marketing-sourced share of 25–45% 4, 5.
- Audit experience signals against Core Web Vitals thresholds and grade personalization on both consent and payoff, since overreach degrades repeat purchase intent for 53% of buyers 2, 9.
- Sort rival authority into durable editorial, regulatory, and partner citations versus patterns Google's spam policies already flag, and check schema completeness on pipeline-adjacent pages 11, 14.
Reframing the teardown as a funnel diagnosis
Most competitor website analyses stall at the same point: a slide deck full of screenshots, a keyword-gap export, and a vague conclusion that the rival "invests more in SEO." That output rarely survives a CFO review, and it almost never changes what the marketing team ships next quarter.
The more useful frame treats the rival site as a funnel under a microscope. Every observable element — the pages that rank, the assets they gate, the CTAs above the fold, the load behavior on a demo request — is a proxy for a stage in the buyer journey. Forrester's 2024 demand and ABM research shows that leading B2B teams have already moved their scorecards away from lead volume and toward opportunity creation and revenue influence, which is the standard any teardown should meet 15.
Marketing leaders who work this way stop asking "what are they doing?" and start asking "where in the funnel would this move the number?" Each finding gets tied to a specific stage — visibility, content depth, conversion path, experience signals, or authority — and then translated into a pipeline delta using published B2B benchmarks as the rubric 5. The five steps that follow build that diagnosis in order, so the analyst ends with a ranked list of gaps sized by expected qualified pipeline, not by how dramatic the screenshot looks.
Step 1: Visibility mapping — what rivals earn in the SERP
Baseline before benchmarking: Search Console vs. Analytics
Comparing a rival's search footprint against nothing produces theater, not analysis. The first move is to fix the analyst's own baseline in two separate systems that answer two different questions. Search Console reports impressions, clicks, average position, and the specific queries that surface each URL — the demand side. Google Analytics reports how those visitors behave once they land, which channels feed them, and where they exit — the response side 7.
Running both in parallel produces a query-to-behavior map: which non-branded queries pull in evaluators, which pages hold them past the fifteen-second mark, and which convert to a form fill or booked meeting. A professional services firm that discovers its top-impression page is a founder bio rather than a service page has learned something the rival teardown cannot teach on its own.
Only after that baseline is stable — usually a rolling 90-day window with seasonality noted — does the competitor overlay become meaningful. Now every rival URL that ranks against the analyst's target queries can be scored not by position, but by the query intent it is capturing and what the analyst's site fails to serve.
Reading competitor visibility as demand capture, not keyword count
A rival ranking for 12,000 keywords is not automatically a threat. The relevant question is how many of those queries sit at the pipeline-adjacent end of intent — pricing, comparisons, integrations, implementation, RFP language, regulatory questions — and what conversion path waits at the other end of the click.
The analyst should segment the competitor's ranking set into three buckets: informational (top-of-funnel education), evaluative (comparisons, alternatives, pricing), and transactional (demo, quote, consultation). A dental group operator will find that a rival's 800 informational blog posts contribute far less to pipeline than the 40 pages ranking for "[procedure] cost [city]" queries. An enterprise SaaS competitor's win is more often the comparison page than the ebook.
Sizing the opportunity requires anchoring to realistic conversion math. Public B2B benchmarks show most sites convert visitors to leads at 0.8% to 2.5%, while stronger performers reach 3% to 5%, and marketing-sourced pipeline contribution typically lands between 25% and 45% for B2B SaaS 5. Those ranges turn a visibility gap into a defensible forecast: an evaluative query bucket driving 10,000 incremental sessions at a 2% lead rate implies roughly 200 net-new leads, which — at the low end of pipeline contribution — sizes the search-traffic prize before a single page is rewritten.
The output of this step is not a keyword list. It is a ranked inventory of query clusters where the rival is capturing intent that the analyst's site is not yet serving, each cluster tagged with an intent bucket and a rough lead-volume estimate.
Step 2: Content depth measured against helpful-content criteria
Naming the artifacts: pricing pages, ROI calculators, proof grids, gated PDFs
A content audit that lists "blog posts, whitepapers, videos" tells the analyst almost nothing about pipeline. The rival's site is better read as an inventory of named artifacts, each engineered for a specific stage of buyer decision-making.
The pages that consistently correlate with qualified opportunity capture are narrower than most teardowns admit: a pricing page (even a "talk to sales" one that discloses tiers, seat logic, or minimums), an ROI or savings calculator that returns a personalized number, a customer proof grid organized by vertical and company size, side-by-side comparison pages against named alternatives, integration or implementation documentation, and gated benchmark PDFs that require a work email. A behavioral health group's site might add a licensure-and-coverage map; a legal firm's might add a matter-type intake questionnaire; a multi-location dental operator's might add per-location procedure pricing.
The analyst catalogs each artifact the rival publishes, notes which are gated, and marks which map to evaluative or transactional query buckets from the visibility step. McKinsey's work on B2B journeys shows that different stages demand different depths of digital support, so a rival missing a calculator but heavy on case studies is signaling a different conversion strategy than one gating every asset behind a form 3.
Scoring originality, completeness, and expertise the way Google does
Once the artifact inventory exists, each item gets scored against the criteria Google publishes for helpful, people-first content: originality, completeness, value beyond what other pages offer, demonstrated expertise, clear sourcing, and trustworthiness 10. Word count is not on that list, and neither is keyword density.
Originality shows up as proprietary data, named practitioners, or a methodology the rival owns rather than paraphrases. Completeness means the page answers the question a buyer actually arrived with — a pricing page that shows tiers, seat math, and minimum commitments scores higher than one that routes every visitor to a form. Expertise is legible when named authors, credentials, and specific case details appear on the page rather than a generic "our team" byline. Sourcing and trust show up as citations, methodology notes, dated updates, and verifiable customer names.
The analyst grades each rival artifact on those six criteria and compares the score against the equivalent asset on the analyst's own site. A comparison page scoring 5 of 6 against a rival's 2 of 6 is a defensible priority; a blog post scoring higher on trust markers than the analyst's own is a fast rewrite, not a new production project. Google's guidance also warns against scaled low-value content 10, which is the frame for judging a rival's 400-post blog: volume without expertise rarely translates to pipeline.
Run a Live Competitor Website Analysis Today
Experience actionable insights from real competitor analysis using your own data and website context.
Step 3: Conversion path and the funnel math behind every CTA
Reverse-engineering a rival's funnel from observable behaviors
A rival's funnel leaves fingerprints. The analyst's job in this step is to read them without access to the rival's CRM.
Start with the primary CTA on each evaluative page. Is it a demo request routed to sales, a self-serve trial, a gated calculator that returns a number, or a downloadable PDF behind a work-email form? Each choice implies a different qualification threshold and a different downstream conversion assumption. A rival that runs an unassisted trial is betting on activation; one that gates every asset behind an SDR call is betting on high-touch qualification. Neither is inherently better, but they produce very different MQL definitions and very different pipeline math.
Next, catalog the friction on each path: form fields, phone-number requirements, calendar embeds, chat handoffs, live-agent hours, and the language on the confirmation page. McKinsey's B2B journey work shows that the human-versus-digital blend at each stage materially shifts satisfaction and progression 3, so a rival forcing a sales call before pricing disclosure is signaling a different journey than one publishing tiers openly.
Anchor the sizing to a known benchmark. Public B2B SaaS data shows MQL-to-Pipeline conversion around 21% and MQL-to-Closed-Won around 8% 4. Those two numbers turn any observed CTA into a rough revenue estimate once traffic and lead-rate assumptions are attached.
The pipeline delta worksheet
Observations only earn priority when they carry a number. The pipeline delta worksheet is the artifact that forces that translation, and it uses only sourced benchmarks so the output survives a CFO review.
The worksheet has four columns per finding: the analyst's current rate at that funnel stage, the rate implied by the rival's observed conversion path, the benchmark median from published B2B data, and the implied incremental MQLs and pipeline per 10,000 sessions. Visitor-to-lead ranges of 0.8% to 2.5% (typical) and 3% to 5% (strong) supply the top of the funnel, while marketing-sourced pipeline contribution of 25% to 45% frames the downstream share 5. MQL-to-Pipeline at 21% converts qualified leads into opportunity volume 4.
| Stage | Current rate | Rival-implied rate | Benchmark range | Delta per 10,000 sessions |
|---|---|---|---|---|
| Visitor → Lead | 1.2% | 2.4% | 0.8–2.5% typical; 3–5% strong 5 | +120 leads |
| Lead → MQL | 40% | 45% | Team-specific | +6 MQLs on the delta above |
| MQL → Pipeline | 18% | — | 21% 4 | +~13 opportunities |
| Marketing-sourced pipeline share | 28% | — | 25–45% 5 | Sizing lever for board reporting |
Forrester's 2024 demand and ABM research argues that leading teams have already replaced lead-volume scorecards with opportunity and revenue-influence metrics 15, which is exactly what this worksheet produces. A finding that lifts visitor-to-lead by 1.2 points on a 10,000-session page cluster is no longer "the rival has a better hero section" — it is roughly 13 incremental opportunities per cycle, at a share of pipeline the finance team already tracks.
Step 4: Experience signals — speed, transparency, expertise
Core Web Vitals as a conversion-readiness check
Page experience does not carry a rival's pipeline on its own, but it shapes how much of the content and conversion work above actually gets seen. Google treats Core Web Vitals as one input among many in its ranking systems 8, and the same signals correlate with the load, jank, and delay behaviors that push evaluators off a demo page before the form loads.
The analyst opens each of the rival's top ten evaluative pages in a testing tool and records three numbers: Largest Contentful Paint under 2.5 seconds, Interaction to Next Paint under 200 milliseconds, and Cumulative Layout Shift under 0.1 9. Any page missing two of three thresholds gets flagged as a conversion-readiness weakness — a place where the rival is spending traffic without capturing it.
McKinsey's digital sales work frames the same audit in plainer terms: winning B2B experiences deliver speed, transparency, and expertise at every touchpoint 6. A pricing page that takes four seconds to render, hides its tiers behind an accordion, or lists no named practitioner is failing on all three at once — regardless of how the copy reads.
The personalization trap on rival sites
Personalization is the tactic most likely to be mistaken for a proven pipeline advantage during a competitor teardown. A rival serving industry-specific hero copy, role-based CTAs, or account-based landing pages looks sophisticated on a screenshot. The evidence on whether that sophistication converts is more divided than most audits admit.
Gartner's demand-generation research reports that B2B customers were 10% more likely to complete a purchase and twice as likely to buy more than originally intended when digital interactions were personalized 1. That is the upside curve most teardowns cite, and it is real when the personalization is grounded in firmographic and behavioral signals the buyer would recognize as relevant.
The downside curve is where the analysis usually stops short. A Gartner survey of 1,464 B2B buyers and consumers found personalized marketing generated negative experiences for 53% of customers, who were three times more likely to regret the purchase and 44% less likely to buy again 2. Overreach on a rival site — surfacing a name pulled from a data enrichment provider, referencing a competitor the buyer never mentioned, or gating the same asset three different ways — degrades long-term pipeline even when the short-term click-through improves.
The analyst grades each personalized rival experience on two axes: whether the signal driving it is one the buyer would consent to, and whether the payoff on the page is worth the disclosure. A calculator that returns a personalized number in exchange for company size and headcount scores well on both. A homepage that names the visitor's employer above the fold without explaining how scores poorly on the second, and often on the first.
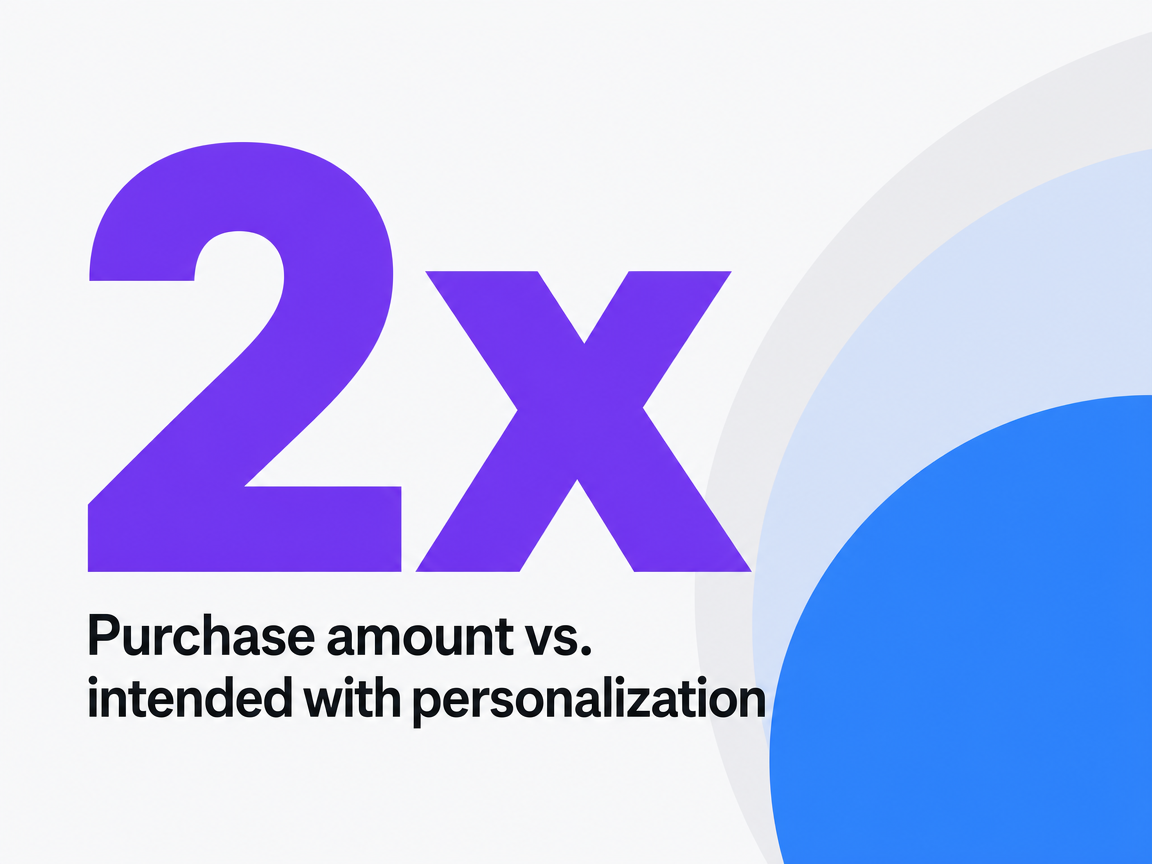 Purchase amount vs. intended with personalization
Purchase amount vs. intended with personalization
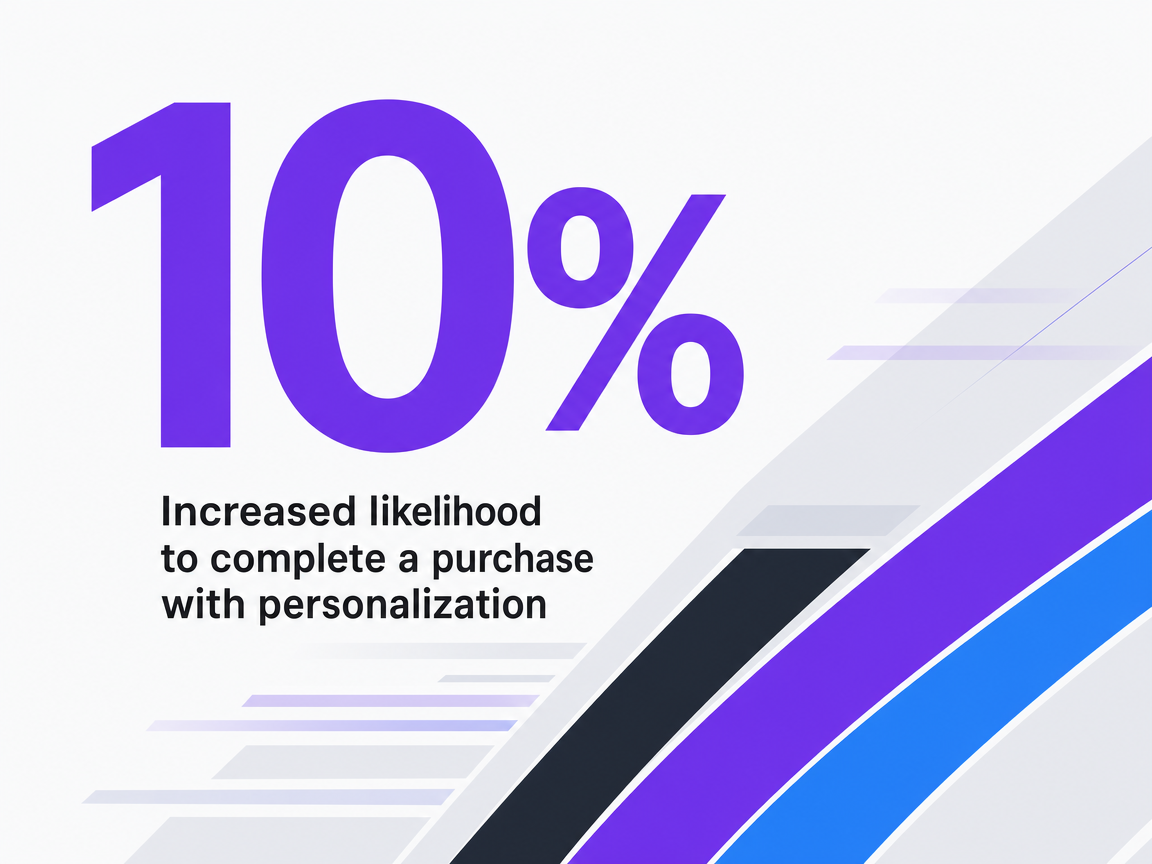 Increased likelihood to complete a purchase with personalization
Increased likelihood to complete a purchase with personalization
Step 5: Authority signals that survive policy scrutiny
Separating durable link patterns from tactics likely to be devalued
Backlink counts are the easiest metric to misread in a competitor teardown. A rival with 40,000 referring domains can look untouchable on a dashboard export and turn out, on inspection, to be leaning on patterns Google's spam policies have already flagged for devaluation.
Google defines link spam as links created primarily to manipulate rankings, and the current policy set explicitly names link schemes, expired-domain abuse, scaled content abuse, and site-reputation abuse as violations 11, 12. The analyst's job is to sort a rival's link profile against that list rather than against a volume threshold.
Three patterns separate durable authority from the disposable kind. Editorial mentions on named-author articles at publications the target buyer already reads. Citations from regulatory bodies, associations, or research institutions relevant to the vertical — a state bar page, a payer directory, a licensure board, an ISO standard. Product or methodology references from customers and integration partners who name the rival in their own documentation.
Everything else — sponsored posts on unrelated blogs, footer links across a network of thin sites, guest posts recycled across low-editorial domains — is a line item that may already be discounted by the algorithm or one policy update away from being discounted. The output of this pass is a two-column view: the rival's authority footprint that a spam sweep would leave standing, and the footprint that would not.
Schema completeness as a visibility multiplier
Structured data is where competitor audits usually stop at "they have schema, we don't." The finding that matters is which entity types are marked up, whether the markup is complete enough to qualify for enhanced results, and whether the pages carrying it are the ones with pipeline-adjacent intent.
Google uses structured data to understand page content and gather information about the web, and eligibility for enhanced results depends on completeness and validity 13, 14. A rival marking up Organization, Product, FAQ, and Review on comparison and pricing pages is compounding CTR on the exact queries the visibility step already flagged as evaluative. A rival with schema only on blog Article types is leaving the same lift on the table.
The analyst runs each of the rival's top ten evaluative URLs through a validator, records which schema types are present, and flags any that are incomplete or blocked from Googlebot — a common own-goal that voids eligibility entirely 14. Missing schema on a comparison page the rival ranks fifth for is a same-week fix on the analyst's own site, not a quarter-long project.
See Competitor Website Insights That Directly Impact Pipeline Growth
Request a tailored analysis revealing which competitor actions are driving conversions in your market, plus actionable opportunities to close pipeline gaps—built for enterprise and agency teams managing complex digital footprints.
Scoring findings by pipeline delta, not screenshot severity
By the end of the five steps, the analyst is holding thirty or forty observations across visibility, content, conversion path, experience, and authority. The instinct is to rank them by how dramatic the screenshot looks. That instinct produces roadmaps that impress the marketing team and stall at the revenue review.
A defensible ranking uses one number per finding: the incremental qualified pipeline the fix would generate against the analyst's own traffic base, expressed at the benchmark rate. A missing comparison page against a named alternative — scored against a 21% MQL-to-pipeline rate on the leads that page would produce — often outranks a Core Web Vitals fix on the homepage, even though the vitals gap is more visible in a slide.
Forrester's 2024 demand and ABM research is explicit that leading teams grade programs by opportunity creation and revenue influence rather than lead volume 15. Applied to a teardown, that means every finding earns a row on a single sheet with four fields: funnel stage, current rate, benchmark rate, and implied incremental opportunities per quarter. Findings without a plausible number get held for a later cycle or dropped.
The output the analyst brings to the CRO is one page: the top eight findings, each with a pipeline delta and the source page it lives on. The screenshots go in the appendix.
If the analyst manages multiple locations or a practice portfolio
The five steps shift when the marketing team owns a portfolio — a dental group with 30 offices, a behavioral health operator with regional intake teams, a law firm with practice groups across states, or a home services brand rolling up local operators under one domain. The competitor set changes at every ZIP code, and the funnel math has to be run per market, not per brand.
Three adjustments matter. First, the visibility step runs against local rivals for each location, not a single national comp set — a rival that dominates "[procedure] cost [city]" in Denver may be invisible in Phoenix, and the pipeline delta is only meaningful at the market level 5. Second, the content audit adds a per-location schema and completeness check, because inconsistent LocalBusiness markup across a portfolio voids enhanced-result eligibility that a single-location rival captures cleanly 13, 14. Third, the conversion-path step accounts for routing: which locations the intake form assigns leads to, whether pricing varies by market, and how the human-versus-digital handoff shifts when a call center sits between the site and the operator 3.
The output is one worksheet per market, then a portfolio roll-up ranked by incremental opportunities per quarter. Findings that lift three markets modestly often outrank a dramatic gap in one.
An operator cadence: quarterly deep, monthly delta, weekly SERP watch
A competitor teardown that happens once a year is a slide deck. A cadence that runs on three clocks is an operating discipline. The distinction shows up in whether the marketing team is briefing the CRO on last quarter's screenshots or on this week's pipeline movement.
- The quarterly deep is the full five-step pass — visibility mapping, artifact inventory, conversion-path reverse-engineering, experience audit, and authority review — against the top three to five rivals, output as a ranked pipeline delta worksheet. This is the version that gets presented to finance and defines the roadmap for the next 90 days.
- The monthly delta is narrower. The analyst re-runs only the sections where a rival shipped something new: a fresh comparison page, a repriced tier, a redesigned demo form, a schema change on a category page. Each delta gets scored against the same benchmark rubric — visitor-to-lead ranges, MQL-to-Pipeline at 21%, marketing-sourced pipeline share of 25% to 45% 4, 5— so the team is not restarting the math each cycle.
- The weekly SERP watch is thirty minutes. The analyst tracks position movement on the evaluative and transactional query clusters identified in the visibility step, flags any new page a rival has published against those queries, and logs it for the next monthly delta. Forrester's demand and ABM research frames this cadence directly: leading teams grade programs by opportunity influence on a running basis, not by annual reviews 15. The teardown becomes a live instrument.
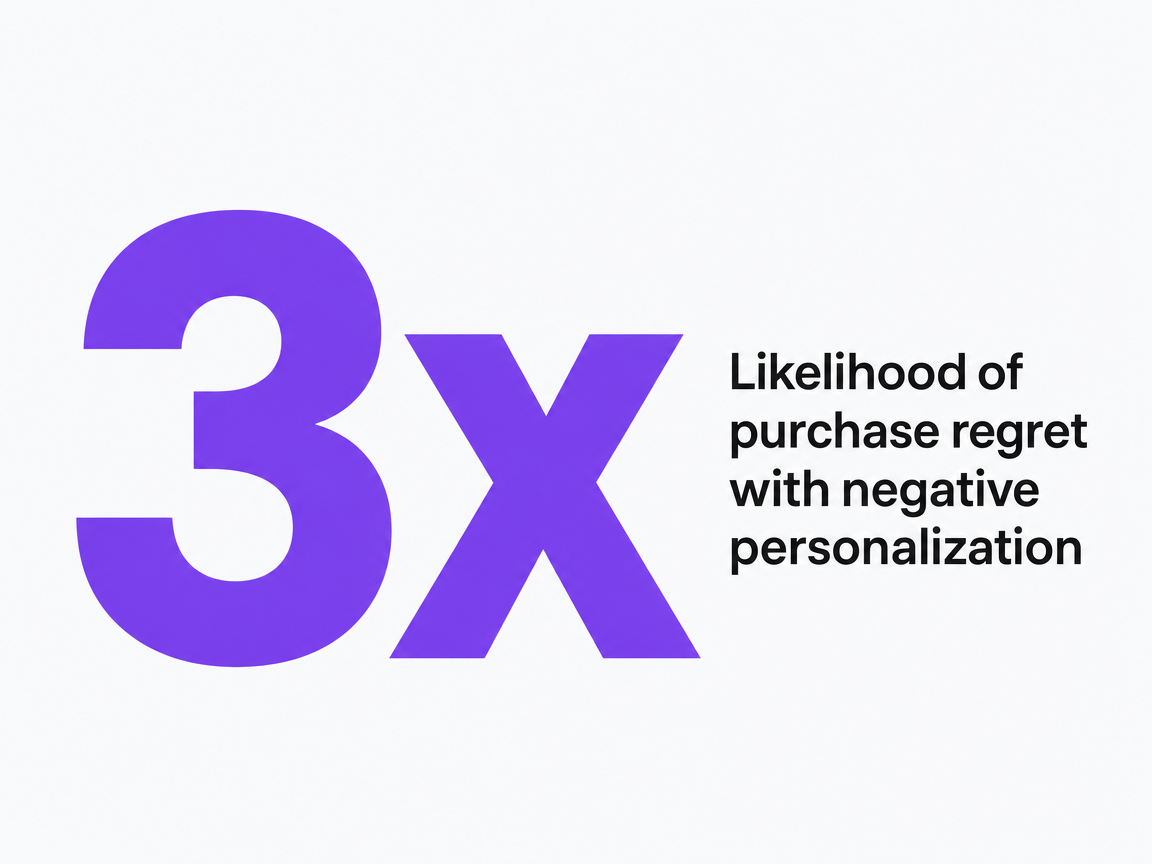 Likelihood of purchase regret with negative personalization
Likelihood of purchase regret with negative personalization
Frequently Asked Questions
References
- 1.Gartner®: CMOs: Use Generative AI for Personalization in B2B Demand Generation.
- 2.Gartner Survey Reveals the Pitfalls of Personalization to Avoid.
- 3.Finding the right digital balance in B2B customer experience.
- 4.SaaS Marketing Benchmark Report 2024.
- 5.B2B Marketing Benchmarks: 2026 Pipeline, Conversion & CAC Guide.
- 6.Digital Sales & Analytics: Driving above-market growth in B2B.
- 7.Using Search Console and Google Analytics Data for SEO.
- 8.Understanding page experience in Google Search results.
- 9.Understanding Core Web Vitals and Google search results.
- 10.Creating Helpful, Reliable, People-First Content.
- 11.Spam Policies for Google Web Search.
- 12.Spam Policies for Google Web Search | Google Search Central | Documentation | Google for Developers.
- 13.Introduction to structured data markup in Google Search.
- 14.Completeness.
- 15.The State Of Demand And ABM 2024.