
Key Takeaways
- A defensible first strategy runs as five interlocking components—audience definition, goal architecture, value proposition, validation, and measurement—each tied to a specific failure mode that surfaces within 90 days.
- Strategy clarity and audience-aligned production, not headcount or volume, separate programs that generate measurable effectiveness from those that accumulate inventory 1.
- Treat content as a pull system anchored to logged search demand and validated query clusters, with distribution running as a parallel track rather than a post-publication step.
- In the first 90 days, focus on producing three artifacts before scaling output: a narrow audience definition, a published validation gate, and a measurement cadence with documented kill criteria.
Why most first strategies fail before publication
The failure mode for a first content marketing strategy is rarely execution. It is the absence of a documented thesis before a calendar gets built. A peer-reviewed managerial survey on the determinants of content marketing effectiveness found that clarity and commitment around strategy were among the strongest predictors of measurable results, ranking alongside audience-aligned production and journalistic quality 1. Teams that skip the thesis step do not produce bad content. They produce content that cannot be evaluated, which is worse, because it cannot be killed.
Three patterns show up repeatedly in postmortems of first-year programs. The audience definition is too broad to support keyword targeting that ranks. Goals are stated as outputs—"publish twelve posts a quarter"—rather than mapped to a revenue motion. And measurement gets bolted on after publication instead of designed into the calendar, which means underperforming assets accumulate faster than the team can prune them.
None of these are content problems. They are operating problems disguised as content problems. A growth team that commits to eight long-form pieces per month without a defensible audience definition will spend the next two quarters producing assets that compete with stronger sites for queries that do not convert. The same team, with the same headcount, working from a documented thesis tied to comparison and middle-of-funnel decision queries, produces fewer pieces with materially better pipeline contribution.
The sections that follow treat strategy as an operating system: five load-bearing components, a pull-based topic model, and a production economics decision that gets made once and reviewed quarterly.
The five load-bearing components of a defensible strategy
Audience definition: the constraint that decides rankability
Audience definition is the upstream decision that determines whether anything published downstream can rank, convert, or be measured. A peer-reviewed managerial survey on content marketing effectiveness identified target-group alignment as one of the strongest empirical predictors of measurable outcomes, ranking with strategy clarity and journalistic quality 1. Programs that define audience as "SaaS marketers" or "healthcare decision-makers" are not defining an audience. They are describing a market.
A defensible audience definition narrows on three axes: the buying role (who signs the contract or approves the budget), the operational context (team size, tech stack, vertical constraint), and the decision moment (what triggers the search). A growth lead at a Series B vertical SaaS company evaluating a switch from a retainer agency is a different audience from a VP of marketing at a public company running a brand campaign. Both might type "content marketing strategy" into a search bar. Only one will read past the second paragraph of a piece written for the other.
The rankability test is mechanical. If the audience definition does not produce a list of comparison queries, decision queries, and category-defining queries that the team can credibly answer better than the top three results currently ranking, the definition is too broad. Programs that pass this test produce fewer pieces against tighter query clusters. They rank. Programs that fail it produce volume against queries owned by stronger domains and stall at six months.
Goal architecture: mapping content to a revenue motion
Goals stated as outputs collapse under quarterly review. "Publish twelve posts a quarter" is a production target, not a goal. A goal architecture connects each content type to a specific stage in the revenue motion and names the metric that proves the connection. The HBS framework treats this as the first step in any defensible strategy, ahead of topic generation or format selection 3. The order matters because format and cadence decisions made before the revenue map produce a calendar that looks busy and converts nothing.
Three motion archetypes cover most growth teams. A self-serve SaaS motion needs middle-of-funnel decision content, comparison queries against named competitors, and integration or use-case pages that catch evaluation traffic. A sales-led motion needs category-defining content, analyst-style market analysis, and bottom-of-funnel content that arms the sales team in active deals. A multi-location operator motion needs service-line landing pages, geo-modified content, and trust-building editorial that supports local search.
Each archetype produces a different KPI tree. Self-serve programs measure assisted conversions and trial starts attributed to organic landing. Sales-led programs measure pipeline influenced and deal velocity on opportunities that touched specific assets. Multi-location operators measure qualified location-level inquiries. Pieces that do not map to one of these trees are not strategy. They are inventory.
Value proposition, validation, and measurement cadence
The remaining three components in the Deschenes five-step framework—value proposition, validation, and measurement—are where most first strategies quietly fail 7. Each component has a specific failure mode that shows up in the calendar within ninety days, and the failures compound.
The value proposition component answers a narrow question: what can this program credibly say that the top-ranking competitor cannot, and why would the defined audience accept that claim. A weak value proposition produces undifferentiated content that ranks behind incumbents on every shared query. Programs anchor this component to a defensible asset—proprietary data, operator experience in a specific vertical, a methodology that produces non-obvious answers—not to a brand voice document.
Validation is the pre-publication test. Before a piece enters production, the team confirms that the target query has measurable search demand, that the intended angle differentiates from the top three results, and that the asset can plausibly be referenced by a sales conversation or product workflow. A weak validation step produces content that publishes on schedule and accumulates as unkillable inventory because no one defined the kill criteria upfront.
Measurement is the cadence, not the dashboard. The Deschenes framework treats measurement as the closing component of a repeatable loop, which means the cadence is set before the first piece publishes 7. A monthly review tracks ranking movement and pipeline contribution by asset cluster. A quarterly review prunes underperformers and reallocates production capacity. A weak measurement cadence produces a year-end report instead of a pruning decision, and the calendar fills with assets that no one is willing to retire.
The five components fail in predictable patterns: a vague audience produces unrankable content, a missing revenue map produces busywork, a weak value proposition produces undifferentiated copy, a skipped validation step produces unkillable inventory, and a deferred measurement cadence produces a program that cannot be optimized. Mapping each component to its failure mode before production starts is the cheapest review a growth team will run all year.
Reframing strategy as a pull system, not a publishing schedule
The dominant mental model for a first content marketing strategy is a calendar: topics on the left, dates across the top, owners in the cells. That model produces output. It does not produce demand capture. A more useful frame, drawn from the EU Business School analysis, treats content marketing as a pull strategy that activates only when consumers are already searching for an answer the program can credibly provide 10. The calendar is the artifact. The pull is the strategy.
The practical difference shows up in topic selection. A push calendar starts with internal priorities—a product launch, a quarterly theme, a campaign tied to a sales kickoff—and works outward to find audiences who might care. A pull system starts with logged search behavior, support ticket patterns, and sales-call objections, then works inward to identify which of those signals the team can answer better than the current top-ranking results. The first model treats content as broadcast inventory. The second treats it as a response to demand that already exists.
This reframing changes the input metrics that matter before publication. Search demand, query difficulty, and intent classification become validation gates, not post-hoc reporting fields. A topic that survives the gate enters production. A topic that fails it gets cut, even if it appears on the campaign brief. The feedback loop runs from analytics back to topic selection on a fixed cadence, so underperforming clusters surface early enough to redirect production capacity to clusters that are pulling.
Test a Complete Content Marketing Workflow Today
Experience a live content strategy cycle with real publishing rights during your free trial—no commitments required.
Production output: what active publishing actually returns
Volume is the wrong primary metric, but it is not irrelevant. The question is what active publishing actually produces in indexable surface area, link acquisition, and lead flow—numbers that bound the upper end of what a defensible strategy can return. An AMA beginner's guide reporting industry blog data found that sites with active blogs carry 434% more indexed pages and 97% more inbound links than sites without, and that companies maintaining active blogs generate 67% more monthly leads 6. The figures are industry aggregates from a guide aimed at first-time strategy builders, not a controlled study, and they describe the gap between publishing and not publishing rather than the gap between good and bad publishing.
The scope matters because the comparison is binary. A site that publishes nothing competes for branded queries and direct traffic. A site that publishes consistently against a defined query map accumulates indexable pages, earns links to specific assets, and creates the surface area that organic lead flow requires. The 434% indexed-page differential is mostly a function of having pages worth indexing in the first place. The 97% inbound-link differential follows from those pages being citable. The 67% monthly lead lift is the downstream consequence.
Treating these numbers as a target rather than a ceiling produces the failure mode discussed earlier: high-output programs against weak audience definitions hit none of the three. The figures describe what is possible when publishing is consistent and aligned. They do not describe what publishing alone delivers. A growth team setting production capacity should plan for the upper bound only after the audience, goal architecture, and validation gates from the five-component model are in place.
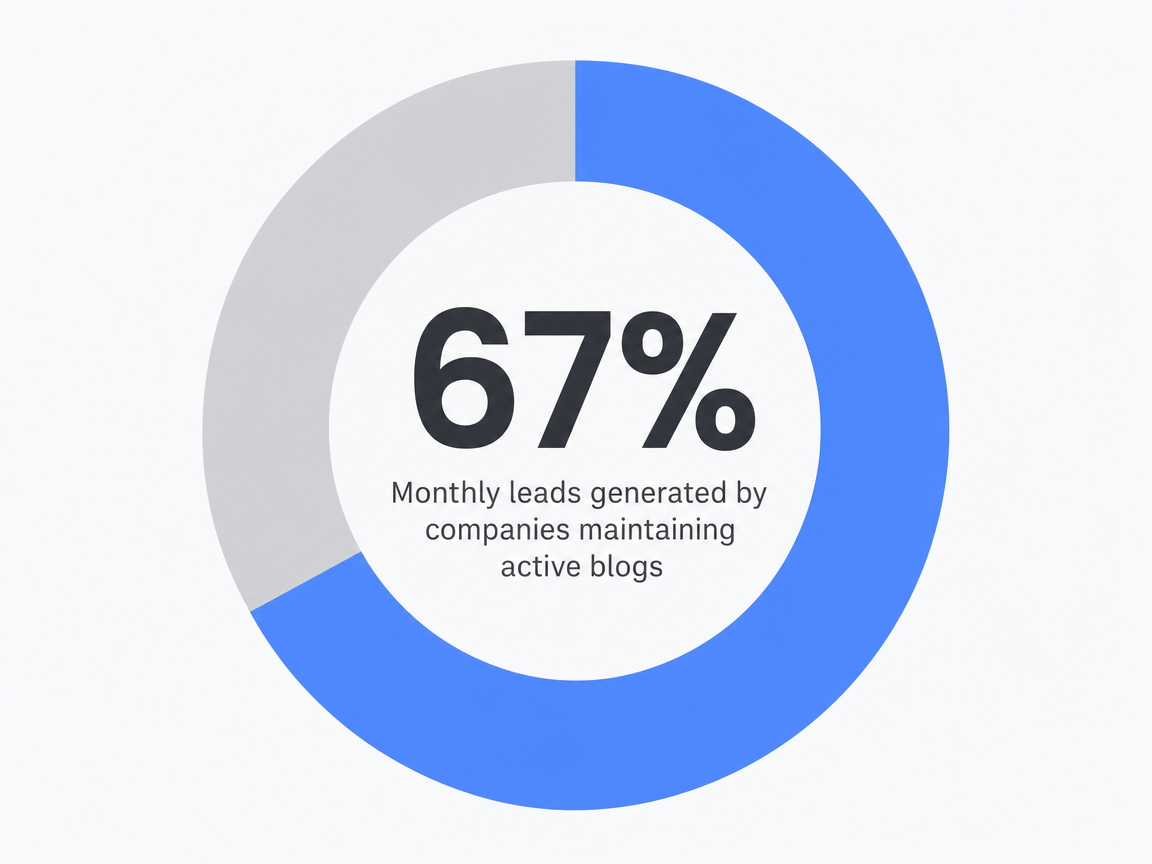 Monthly leads generated by companies maintaining active blogs: 67%
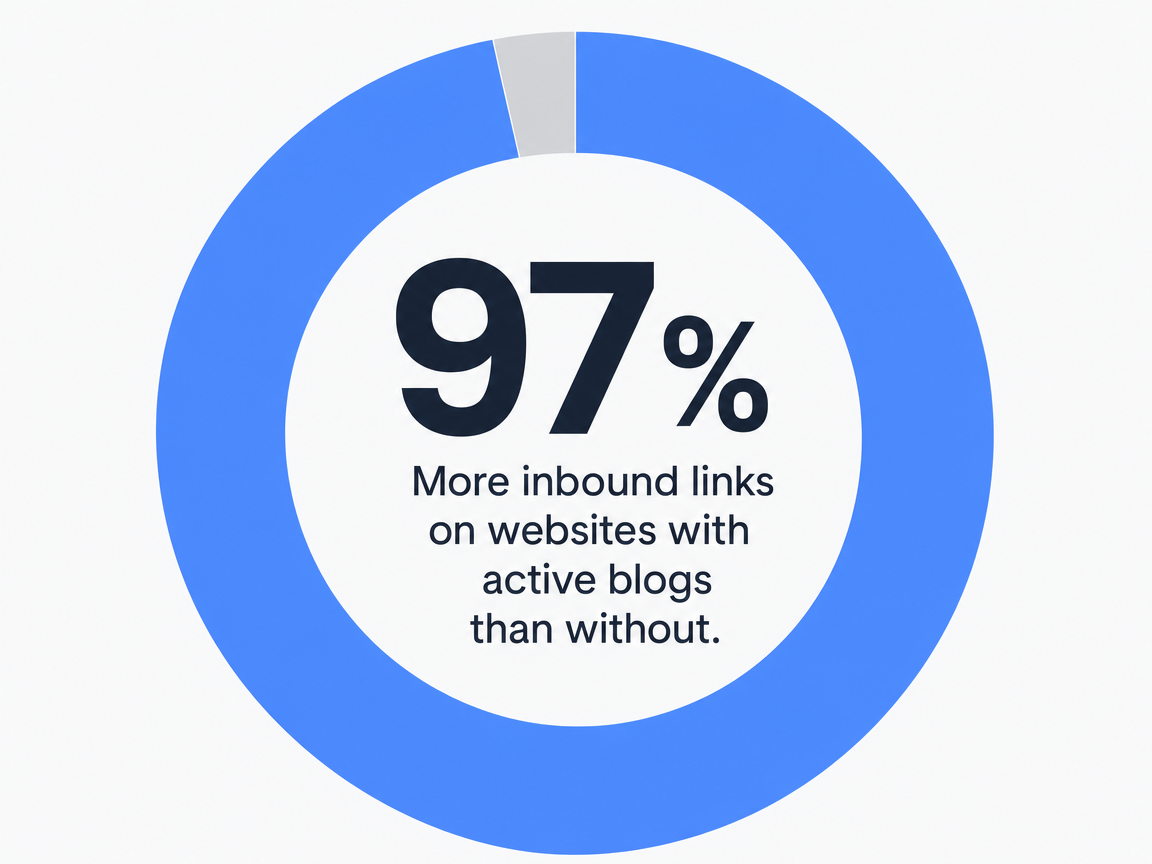 More inbound links on websites with active blogs than without: 97%
 More indexed web pages on sites with active blogs: 434%
Production economics: in-house, retainer, or AI-assisted
Once the five components are documented and the pull model is in place, the next decision is structural: who produces the work, at what cost shape, and against what output ceiling. The peer-reviewed determinants study found that strategy clarity and audience-aligned production—not headcount—predicted measurable effectiveness 1, which means the production model is a cost and capacity question, not a quality one. Three models cover the realistic options for a growth team standing up its first program at roughly eight long-form pieces per month.
The structural attributes matter more than any single line item. Fixed cost models scale poorly when output needs adjust quarter to quarter. Variable cost models trade predictability for flexibility. Ramp time determines when the first defensible asset publishes. Output ceiling caps what the model can deliver before the team has to add capacity or accept a queue. Revision latency—the lag between an editorial change and a corrected draft—shapes whether the validation gate from the five-component model can run as designed or gets skipped under deadline pressure.
| Attribute | In-house hire | Retainer agency | AI-assisted production |
|---|---|---|---|
| Cost shape | Fixed: fully loaded salary $X plus freelance overflow | Fixed: monthly retainer $Y, scope-capped | Variable: software $Z plus oversight hours |
| Ramp time | 60–90 days to hire, onboard, first publish | 30–45 days for kickoff, audit, first publish | Days to weeks, gated by brand intake |
| Output ceiling at 8 pieces/mo | At capacity; overflow needs freelancers | Within scope; additions billed separately | Headroom; ceiling set by oversight time |
| Revision latency | Hours, same-team | Days, queued through account manager | Hours, gated by reviewer availability |
| Failure mode | Single point of failure on one writer | Scope creep, generic output, handoff drag | Weak oversight produces undifferentiated drafts |
Illustrative comparison for a baseline of eight long-form pieces per month. Cost variables stated as labels, not benchmarks.
The in-house model produces the tightest editorial loop and the highest fixed cost. One content marketer plus freelance support covers eight pieces if the audience definition is narrow and the validation gate is disciplined. The model breaks when the hire leaves, when output needs double, or when the program expands into a second service line. The retainer model trades editorial proximity for capacity flexibility on paper, but most retainers cap scope and route revisions through an account manager, which extends revision latency past the point where validation gates run cleanly. The AI-assisted model converts most of the fixed cost to variable cost and lifts the output ceiling, but it depends on a brand intake step and active oversight; without those, drafts revert to undifferentiated copy that fails the value-proposition component. The decision is not which model is cheapest at eight pieces. It is which model holds its cost shape when the program needs to move to twelve, or contract to four, without renegotiation.
Distribution as a parallel track, not a downstream step
Most first strategies treat distribution as the step after publication: write the piece, then push it to social, email, and paid. The Kennesaw academic proceedings on integrating content and social media marketing argue for a different structure—a dual-track model where content production and distribution run as interdependent tracks rather than as a sequence 4. The distinction is not semantic. Sequential models route every asset through the same promotion template after the fact, which produces social posts that summarize articles instead of social assets designed to earn attention on their own terms.
The dual-track structure changes what happens during production. Each long-form piece in the calendar carries a paired distribution brief built at the same time as the editorial brief: the social cuts that can stand alone, the email angle for the existing list, the syndication targets where the asset is citable, and the paid amplification thesis if one applies. Both tracks publish on coordinated cadences, and both tracks feed the measurement loop. The content track owns ranking and indexed surface area. The distribution track owns referral traffic, branded search lift, and the link acquisition that compounds the content track's authority.
For a small growth team, the discipline shows up as a single editorial calendar with two columns of owners and two sets of validation gates. Pieces that cannot generate at least one defensible distribution asset alongside the long-form draft get reconsidered before they enter production, not after they underperform.
See How Top SaaS Teams Operationalize Content Marketing at Scale
Request a walkthrough of AI-driven workflows that consolidate strategy, production, and multi-channel execution—backed by research and proven to reduce content costs by up to 60% versus traditional agency models.
If you operate in a regulated or multi-location vertical
The frame shifts here. The preceding sections assumed a SaaS growth team running a single brand against a defined query map. Operators in regulated or multi-location verticals—healthcare systems with twelve service lines, agencies running content for franchise networks, any program where a piece can affect a clinical decision or a regional license—face a different constraint set, and the strategy components have to absorb it before production starts.
The audience-alignment finding still holds. A peer-reviewed literature review of digital marketing in healthcare reported that content marketing was the format most effective at persuading customer loyalty, ahead of paid and social tactics measured in the same review 2. The same review flagged adoption challenges specific to the vertical: medical accuracy review, regulatory exposure, and the coordination cost of producing content that has to clear legal before it can clear editorial. A separate peer-reviewed analysis of marketing strategies in healthcare systems argued that content programs in the sector extend well beyond blogging into patient education, service-line trust building, and condition-specific decision support 8.
Three components from the load-bearing model need explicit modification. The audience definition splits by service line and geography, not by buying role alone—a knee replacement candidate in one metro is a different cluster from a sports medicine patient in the same network. The validation gate adds a medical or legal review step before the editorial validation runs, which extends ramp time and makes revision latency a structural constraint rather than a workflow detail. The measurement cadence tracks location-level inquiry quality, not aggregate site traffic, because a program that lifts blended traffic while underperforming in three of twelve markets has not actually worked.
The first 90 days: a small-team execution sequence
A small growth team standing up its first program does not need a twelve-month roadmap. It needs a ninety-day sequence that produces a defensible audience definition, a published validation gate, and a measurement cadence running before the first quarterly review. The MSU extension service condenses the practical sequence into three operating moves—identify the audience and the queries they search, optimize the assets that already exist, and schedule the production calendar against a fixed cadence 9. Treating those moves as phases rather than parallel tasks keeps a two- or three-person team from launching a calendar before the upstream decisions are documented.
The first thirty days produce two artifacts: a written audience definition narrowed by buying role, operational context, and decision moment, and a query map of fifteen to twenty clusters the team can credibly answer better than the current top-ranking results. No publishing happens. Existing assets get audited against the query map, and pieces that match a cluster get reworked before new production starts.
Days thirty to sixty produce the validation gate and the first three pieces. Each piece carries a paired distribution brief from the dual-track model and a kill criterion written into the editorial brief. Days sixty to ninety produce the measurement cadence: a monthly review template, a quarterly pruning rule, and the first ranking and pipeline-contribution baseline. Programs that hit day ninety with all three artifacts in place enter the second quarter optimizing. Programs that skip any of them spend Q2 producing inventory.
The operating decision behind the strategy
The operating decision is not which framework to adopt. It is whether the program will be designed as a closed loop—audience, goal architecture, value proposition, validation, measurement, all running on a fixed cadence—or as a publishing schedule that gets reviewed when the quarterly numbers disappoint. The peer-reviewed determinants research is direct on this point: strategy clarity and audience-aligned production were the variables that separated programs producing measurable effectiveness from programs producing inventory 1. Headcount was not the variable. Volume was not the variable.
That reframes the build question for a growth team standing up its first program. The decision in front of the team is not which writer to hire or which retainer to sign. It is which production model holds the five components intact when output needs move, when a service line gets added, or when a quarterly review prunes a third of the calendar. The model that survives that test is the one worth committing to. Vectoron exists in the category that converts most of the fixed cost to variable cost while keeping the validation gate and measurement cadence inside the team's control, which is the structural answer to the operating question this article opened with.
Frequently Asked Questions
References
- 1.Determinants of content marketing effectiveness: Conceptual framework and empirical findings from a managerial perspective.
- 2.The impact and challenges of digital marketing in the health care industry: literature review and research agenda.
- 3.How to Create a Content Strategy That Drives Results.
- 4.A Framework for Integrating Content Marketing and Social Media Marketing.
- 5.Effectiveness of Social Media Marketing Strategies in the Healthcare Industry.
- 6.What is Content Marketing? A Beginners Guide.
- 7.Deschenes | Weave: Journal of Library User Experience.
- 8.The impact of marketing strategies in healthcare systems - PMC - NIH.
- 9.How to Reach Your Audience and Boost Sales with Content Marketing.
- 10.The Death of Content Marketing - EU Business School.
- 11.Content Marketing Strategy. Definition, Objectives and Tactics.