
Key Takeaways
- A defensible content marketing strategy template is built from seven linked artifacts—ICP, pipeline math, asset matrix, distribution mix, attribution model, production cadence, and quarterly review—each feeding the next.
- Pipeline coverage drives content sizing, not editorial capacity: walk quota backward through CRM conversion rates to derive required MQL volume and asset throughput across diversified channels 2.
- Attribution model choice hinges on cycle length and data maturity—U-shaped for cycles under 60 days, W-shaped for cycles over 90 days with clean opportunity-creation timestamps 5, 4.
- Focus next on closing the execution gap: hold the cadence sheet against named approval gates so every asset, including AI-assisted drafts, clears strategy, compliance, and sales sign-off before shipping 1, 8.
Why most strategy templates never reach the pipeline
A content marketing strategy template is rarely the bottleneck; execution is. The Content Marketing Institute's 2025 B2B survey found that 58% of marketers rate their content strategy as only moderately effective, 56% struggle to attribute ROI, and while 81% now use AI in some form, just 19% have integrated it into daily workflows 8. The gap between a documented plan and a plan that ships on cadence is where pipeline contribution quietly disappears.
Most templates circulating in demand gen circles organize work the wrong way. They begin with topic clusters, editorial calendars, or persona decks, then bolt measurement on at the end. That sequence produces traffic reports that survive a quarterly review but collapse under a CFO question about influenced pipeline. Salesloft's guidance on pipeline-accelerating content is blunt on this point: results must be tracked back to influenced pipeline, with engagement metrics treated as early signals rather than proof of impact 1.
The template that holds up in finance conversations is built backwards from a coverage target and forward through assets a multi-touch model can actually credit. It treats content as a pipeline instrument, not a publishing program. The sections that follow lay out seven linked artifacts, in the order a demand gen leader should build them, so the plan on paper and the plan in market describe the same work.
The seven artifacts that make a template defensible
A defensible template is not a document. It is a set of linked artifacts, each of which produces an input the next one needs. Skip one and the chain breaks. The seven, in build order:
- ICP and buying committee, named by role. The economic buyer, champion, technical evaluator, and end user, with the questions each asks before signing.
- Pipeline math. Quota translated backward into the opportunity count, MQL volume, and asset throughput required to hold 3–5x coverage 2.
- Stage-mapped asset matrix. A grid of roles by journey stages, with one format and one stage-advancing CTA per cell 1.
- Distribution mix. The channels that carry each asset to the right account at the right signal moment 6.
- Attribution model. A weighted multi-touch model matched to cycle length and data maturity 4, 5.
- 90-day production cadence. A shipping rhythm with named owners and approval gates, drawn from the role specialization principle in Predictable Revenue 3.
- Quarterly review loop. Conversion deltas, sales call themes, and coverage gaps that feed back into the matrix.
Each artifact answers a CFO-grade question. Together they make the plan reproducible by anyone who picks it up next quarter.
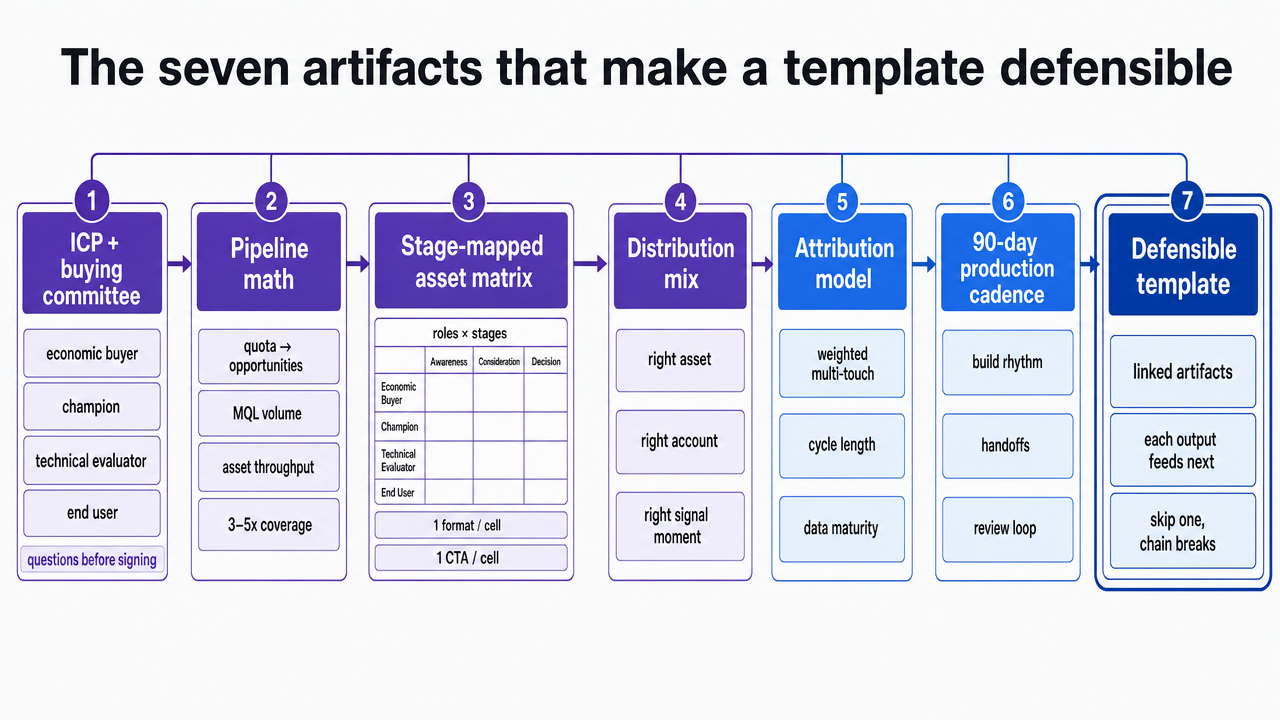 Visualize the seven linked artifacts in build order, since this section explicitly enumerates them as a sequential framework where each output feeds the next
Artifact one: ICP and buying committee, named by role
Generic personas with names like "Marketing Mary" produce generic content. A pipeline-grade ICP names the company profile and the four committee roles that actually approve a purchase: the economic buyer who signs, the champion who builds internal consensus, the technical evaluator who vets the fit, and the end user who lives with the choice daily. Each asks different questions, reads different formats, and responds to different proof.
The company profile sits above the roles. It captures the firmographic and operational filters that predict close: revenue band, employee count, vertical, tech stack, regulatory exposure, and the trigger event that puts an account in-market. A dental support organization adding its tenth location, a multi-state law firm hitting a compliance deadline, a senior living group losing a referral partner—each trigger creates a buying window the content matrix has to meet.
Inside that profile, the four roles get separate intake. For each, demand gen leaders should document three things: the primary outcome the role is measured on, the two or three objections that surface during evaluation, and the format the role consumes before a vendor conversation. The economic buyer reads a one-page financial summary. The technical evaluator reads a security or integration brief. The champion reads a peer case study. The end user reads a workflow walkthrough.
This artifact is the input to every other one. The pipeline math estimates how many accounts matching the profile must enter the funnel each quarter. The asset matrix uses the four roles as its rows. The distribution mix picks channels by where each role actually spends attention—LinkedIn for champions, vertical publications for economic buyers, peer communities for technical evaluators 6. The attribution model weights touches by which role engaged, since a champion download and an end-user signup carry different decision relevance 5.
One discipline keeps the artifact honest. Every six months, the demand gen team should pull the last twenty closed-won deals and confirm the named roles match who actually appeared in the deal log. When they don't, the ICP is wrong, not the content.
Artifact two: pipeline math as the input, not the output
Most content plans get sized by editorial capacity: how many posts the team can ship, how many gated assets the designer can produce. That sequence inverts the math. Pipeline coverage is the input. Asset throughput is what gets derived from it.
The starting number is the sales quota for the period. Pipeline experts recommend holding open pipeline equal to roughly three to five times that quota, with the multiplier rising as win rates fall or cycle length grows 2. A team carrying a $4M quarterly quota at a 25% win rate needs $16M in qualified opportunity value moving through stages. From there, the math walks backward through stage conversion rates already sitting in the CRM. If opportunity-to-close runs at 25%, SQL-to-opportunity at 50%, and MQL-to-SQL at 30%, the team needs roughly 427 MQLs per quarter to keep coverage intact at a $50K average deal size.
That MQL number is what sizes the content plan. Demand gen leaders should then divide the requirement across the diversified lead sources Lead Forensics recommends—organic search, paid, ABM plays, referral programs, partner co-marketing, and events—rather than loading the full target onto one channel 2. A program that depends on organic for 80% of MQLs has a single point of failure on every algorithm update.
The output of this artifact is a one-page coverage sheet: quota, coverage target, stage conversion rates, required MQL volume by channel, and the asset throughput each channel needs to hit its share. The asset matrix in the next artifact inherits those throughput numbers directly. When a channel underdelivers, the sheet shows exactly how many additional stage-mapped assets, retargeting touches, or outbound sequences have to compensate before the quarter closes.
Test a Predictable Content Pipeline in One Week
Experience live publishing and measurable results before committing to a long-term strategy shift.
Artifact three: the stage-mapped asset matrix
The matrix is where the ICP and the math become a publishing plan. Rows are the four buying committee roles. Columns are the four journey stages: problem aware, solution aware, vendor aware, and decision. Each of the sixteen cells holds two entries: the asset format that role consumes at that stage, and the single CTA designed to advance the prospect into the next column. Salesloft's guidance is direct on the CTA discipline—every asset should include a call-to-action that moves the prospect to the next stage, not a generic newsletter signup that strands the engagement 1.
A worked example clarifies the shape. For a multi-state law firm evaluating intake software, the champion's problem-aware cell might hold a benchmark report on intake leakage rates with a CTA to a self-scoring diagnostic. The same champion's vendor-aware cell holds a peer case study with a CTA to a 20-minute reference call. The technical evaluator's solution-aware cell holds a security and integration brief with a CTA to a sandbox environment. The economic buyer's decision-stage cell holds a one-page ROI summary with a CTA to a procurement-ready pricing sheet. Sixteen cells, sixteen specific moves.
Two rules keep the matrix from sprawling. First, no cell carries more than one primary asset. When a second asset is needed—say, a webinar recording and a written summary—one is named the primary and the other is treated as a repurposed derivative. Salesloft frames this as the discipline of repurposing core assets into stage-specific formats rather than producing new ones from scratch 1. Second, every cell names the next-stage destination explicitly. A champion's problem-aware asset has to hand off to a champion's solution-aware asset, not to a generic demo request that skips three stages.
The matrix also exposes coverage gaps the pipeline math has already flagged. If the coverage sheet shows organic search underdelivering champion-stage MQLs, the matrix shows which two or three cells are empty or under-resourced. Account intelligence and buying-signal monitoring then determine which cells get priority in the next sprint, since accounts showing in-market signals need the vendor-aware and decision cells filled before the problem-aware ones 6.
Production owners get assigned at the cell level, not the asset level. A single owner is responsible for the champion row across all four stages, which forces narrative consistency: the language a champion reads in stage one should echo through stages two, three, and four. When the quarterly review surfaces a stalled conversion between two columns, the cell owner is accountable for the rewrite, not a rotating editorial assignment.
Artifact four: distribution mix beyond organic search
A coverage sheet that loads 80% of MQL volume onto organic search is a coverage sheet one core update away from a missed quarter. The distribution artifact spreads the asset matrix across the channels where the four buying committee roles actually pay attention, and pairs each channel with the buying signal that triggers a push.
Salesmotion's 2026 demand gen tactics frame the mix around account intelligence and signal monitoring rather than channel volume 6. The practical translation is a five-column distribution sheet: channel, role it reaches, matrix cells it carries, signal that triggers activation, and the throughput share it owes the coverage math. Organic search carries problem-aware and solution-aware cells for champions and technical evaluators, activated by keyword intent. LinkedIn carries champion and economic buyer cells, activated by job-change signals and engagement with industry peers. Vertical publications and association newsletters carry economic buyer cells in regulated industries like behavioral health or senior living, where trust transfers through known editorial brands. Outbound sequences carry vendor-aware and decision cells, activated by ICP-match plus a recent trigger event. Paid retargeting carries decision-stage cells exclusively, since spending impressions on cold problem-aware audiences burns budget the coverage math already allocated to organic.
LinkedIn's 2024 B2B benchmark documents the broader move toward agile, customer-centric, data-driven strategies that decide channel weight by contribution rather than habit 7. The distribution sheet enforces that discipline: when a channel misses its throughput share two quarters running, its share moves to a channel that hit its number, and the asset matrix follows the budget.
Artifact five: choosing an attribution model that survives a CFO conversation
Attribution is where most content strategy templates lose the finance team. A program that ships hundreds of assets but credits them under a last-touch model hands the CFO a report showing demo requests as the source of all revenue and content as a rounding error. Salesforce's guidance on multi-touch attribution is direct: the model has to match journey complexity, draw on accurate data across touchpoints, and be tuned continuously against business goals rather than installed once and left alone 4. The American Marketing Association's academic treatment reinforces the case, arguing that multi-touch models give managers a defensible read on the direction and magnitude of advertising effects across the journey, which is exactly the language a CFO will accept 10.
The artifact itself is short. A one-page attribution spec names the chosen model, the weights assigned to each touch position, the data sources feeding each touch, the refresh cadence, and the qualitative override conditions. The two sub-sections below cover the choice between the two weighted models most B2B teams actually deploy, and the conditions under which the model's output should be set aside in favor of what sales and customers are saying directly.
U-shaped versus W-shaped: a decision rule by cycle length
The choice between U-shaped and W-shaped attribution is not philosophical. It is a function of how many committee-grade conversion events sit between first touch and closed-won. U-shaped models weight first touch and lead conversion at 40% each, with the remaining 20% spread across middle touches. W-shaped adds a third anchor at opportunity creation, typically splitting 30/30/30 across first touch, lead conversion, and opportunity, with 10% across the middle 5.
The decision rule: cycles under 60 days with a single committee-grade conversion event use U-shaped. Cycles over 90 days with a distinct opportunity-creation moment after MQL use W-shaped. A dental support organization evaluating a new intake platform across a four-month committee process gets a more honest read from W-shaped, because the opportunity-stage content—security briefs, ROI summaries—does real work that a U-shaped model under-credits. A home services franchisor running 30-day cycles to a single demo request does not need the third anchor and gets noise from it. Data maturity also gates the choice. W-shaped requires clean opportunity-creation timestamps; teams without them should hold at U-shaped until the CRM hygiene catches up 4.
Where attribution breaks and what qualitative signals override it
No weighted model captures dark social, peer referrals exchanged in private channels, or the conference hallway conversation that put an account in-market three months before the first tracked touch. Salesloft is candid that over-reliance on imperfect attribution can mislead a content strategy when the model is not balanced against qualitative feedback 1. The AMA's review of methodological challenges in MTA estimation echoes the limit: the math is directional, not absolute 10.
Three qualitative signals should override model output when they conflict:
- Sales call themes pulled from the last 30 days of recorded discovery calls—when champions consistently cite an asset the model under-credits, the weight is wrong, not the asset.
- Deal review notes from closed-won post-mortems, where the AE names the content that actually moved the committee.
- Lost-deal reasons that cluster around a missing asset the matrix never produced.
The quarterly review loop should adjust model weights or asset priorities based on those signals before the next cycle, not after the model has compounded the error for two more quarters.
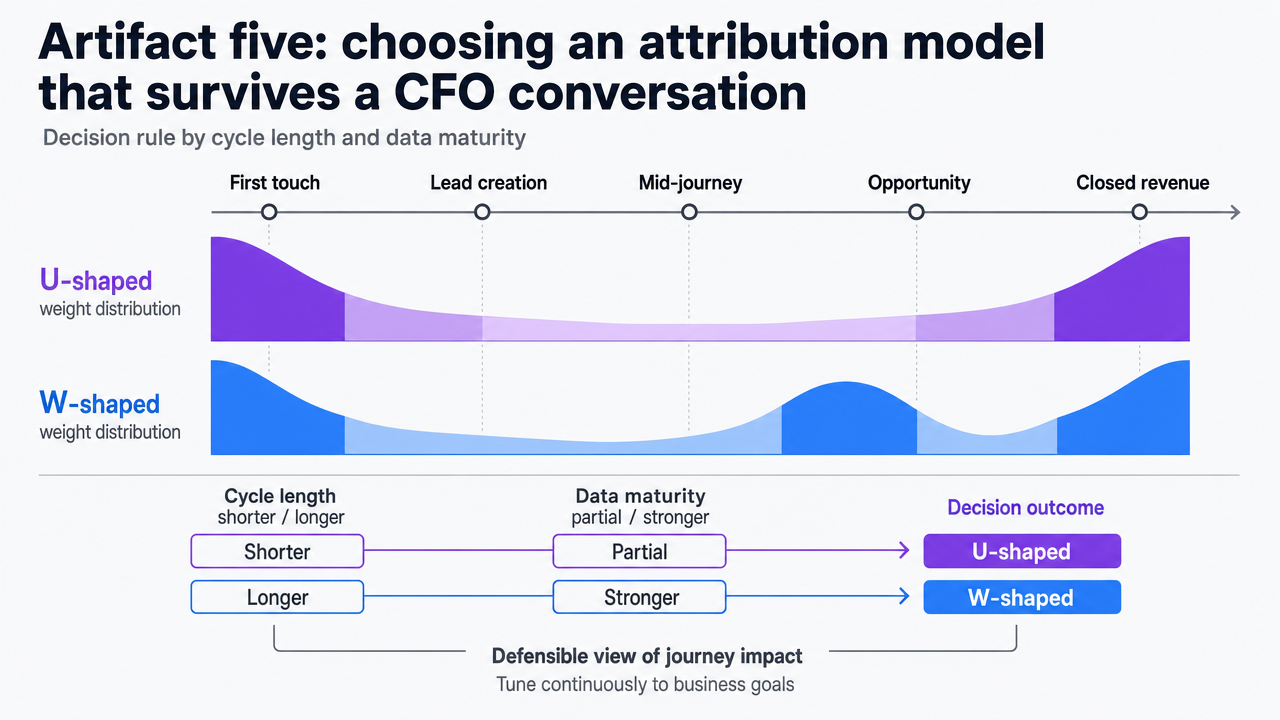 Visualize the decision rule comparing U-shaped vs W-shaped attribution by cycle length and data maturity, as the section explicitly lays out a comparison framework with named weight distributions
Access a Proven Template for Content-Driven Pipeline Growth
See how leading teams are structuring content marketing strategies that directly map to qualified pipeline—complete with workflow examples and measurable benchmarks for enterprise-scale execution.
Artifact six: a 90-day production cadence the team can actually hold
A cadence sheet is the artifact that decides whether the matrix ships. Most plans collapse here, not in design. The Content Marketing Institute's 2025 survey found that 81% of B2B marketers now use AI in some form, but only 19% have integrated it into daily workflows—the gap where strategy stalls between approval and publication 8.
The cadence sheet covers thirteen weeks and assigns three things per asset: a named owner, a publication date, and the approval gate that precedes it. Predictable Revenue's case for role specialization applies directly: separating production from approval, and approval from distribution, creates the repeatable rhythm a pipeline plan needs 3. A single owner who writes, edits, approves, and publishes will miss dates the moment a deal review runs long.
Three rhythms run in parallel:
- A weekly shipping rhythm clears two to four stage-mapped assets, weighted toward the matrix cells the coverage sheet flagged short.
- A biweekly repurposing rhythm converts each primary asset into the two or three derivatives the distribution mix needs—the webinar becomes a LinkedIn carousel, a sales one-pager, and an outbound sequence snippet.
- A monthly signal rhythm pulls account intelligence and reprioritizes the next four weeks against in-market triggers 6.
Approval gates are the throttle. Each asset clears strategy review, legal or compliance review where regulated verticals demand it, and a final sales sign-off confirming the CTA matches the next-stage destination in the matrix 1. When a gate slips, the cadence sheet shows which downstream assets shift, not just which one missed.
Artifact seven: the quarterly review loop
A template without a review loop becomes a relic by month four. The quarterly loop is the artifact that closes the system, pulling conversion data, sales call themes, and coverage gaps back into the matrix before the next cycle compounds the error. Lead Forensics recommends quarterly deep-dives into conversion rates and deal patterns as the discipline that keeps a pipeline plan honest 2.
Three inputs drive the review:
- The coverage sheet's stage conversion rates compared against the prior quarter—any cell that moved more than five points in either direction gets a written diagnosis.
- Themes pulled from recorded discovery and deal review calls, clustered by buying committee role, with named assets the AE team credits or wishes existed.
- The attribution model's weights tested against closed-won post-mortems, with U-shaped or W-shaped weightings adjusted only when qualitative signals corroborate the math 5, 10.
The output is short: a one-page memo naming the three matrix cells getting reinforced next quarter, the two channels losing throughput share, and the model adjustments going into effect. Predictable Revenue's process discipline applies here—the loop runs the same way every quarter, owned by the same role, so the template improves instead of drifting 3.
Closing the execution gap without adding headcount
Seven artifacts on paper do not produce pipeline. Shipped assets do. The persistent problem for in-house demand gen teams is that the cadence sheet calls for two to four stage-mapped pieces a week, the matrix flags three under-resourced cells, and the team running the program is the same three people who were running it last quarter. Hiring is not on the table. Agencies quote retainers that the coverage math cannot absorb at the cost-per-shipped-asset the plan requires.
This is where AI-assisted execution earns its place in the template, and only here. Not as a volume play that floods the matrix with thin assets, but as cadence protection for the cells the coverage sheet has already prioritized. The same Content Marketing Institute survey that found 81% of B2B marketers using AI also found only 19% had integrated it into daily workflows 8—meaning most teams are using AI to draft faster, not to hold a shipping rhythm against named approval gates. The integration gap, not the adoption gap, is what stalls the plan.
The discipline that closes it is approval-first. Every AI-produced draft enters the same strategy, compliance, and sales sign-off gates the cadence sheet already defines 1. Nothing ships without the human review that protects the CTA-to-next-stage logic in the matrix. Demand gen leaders evaluating platforms like Vectoron should judge them on that test: does the system hold the cadence, or just produce more drafts to review.
Frequently Asked Questions
References
- 1.How to Accelerate Sales Pipeline With the Right Content Strategy.
- 2.Sales Pipelines – How to Build Predictable Revenue.
- 3.Predictable Revenue by Aaron Ross & Marylou Tyler – Book Notes.
- 4.Multi-Touch Attribution: What It Is & Best Practices.
- 5.Data-Driven B2B SaaS Revenue Attribution Models.
- 6.10 B2B Demand Gen Strategies That Drive Pipeline in 2026.
- 7.2024 B2B Marketing Benchmark.
- 8.B2B Content Marketing: 2025 Benchmarks & Trends.
- 9.2025 Annual Marketing Report | Nielsen.
- 10.Multitouch Attribution in the Customer Purchase Journey.