7 Top CRO Site Audit Tools to Consider
Key Takeaways for Healthcare Leaders
- Editor's Pick: The integration of GA4, Search Console, and SEMrush creates the most powerful diagnostic layer for multi-location healthcare systems.
- Mobile Criticality: With 80% of research occurring on mobile, optimization here drives the highest ROI for patient acquisition.
- AI Vision Scoring: Automated visual analysis detects friction points in layout and hierarchy that human auditors frequently miss.
- Scale Without Headcount: Audit data must feed directly into AI-powered content workflows to replace slow, linear agency models.
- Compliance as Growth: Accessibility tools mitigate legal risk while capturing lost revenue from the significant patient population with disabilities.
Why CRO Site Audit Tools Drive Patient Acquisition ROI
Implementing a robust 50-point evaluation using advanced cro site audit tools serves as the diagnostic framework that transforms raw website analytics into a scalable engine for patient acquisition growth. Data from healthcare analytics firm PatientPop indicates that medical practices executing structured audits experience an average 47% increase in form completions within 90 days2. This measurable impact stems from the systematic identification of friction points across user experience, technical performance, and conversion pathways—each element mapped to specific data sources that quantify its influence on appointment scheduling rates.
The modern audit framework leverages AI-powered vision scoring to assess 50+ elements, including visual hierarchy, call-to-action prominence, and mobile responsiveness. These systems utilize pattern recognition trained on millions of high-converting healthcare pages to identify subtle issues that human reviewers often overlook, such as contrast ratios affecting readability or button placements that depress click-through rates.
"The audit's value materializes when integrated data sources inform targeted improvements... identifying that 68% of mobile visitors abandoned forms at the insurance verification field."
To structure the analysis effectively, the audit framework organizes into four data-driven components. Each component connects to a specific analytics integration that validates findings with behavioral data:
| Audit Component | Primary Data Source | Strategic Outcome |
|---|---|---|
| User Behavior | GA4 Event Tracking | Quantifies abandonment at specific booking stages. |
| Search Intent | Google Search Console | Identifies high-traffic pages with low conversion. |
| Competitive Gap | SEMrush | Benchmarks conversion elements against competitors. |
| Interaction | Heatmaps/Session Recording | Validates hypotheses about user friction. |
A multi-location orthopedic practice documented 156% growth in consultation requests after implementing recommendations derived from this integrated approach. By combining GA4 abandonment data, Search Console traffic patterns, and SEMrush competitive benchmarking, the practice replaced subjective design preferences with data-driven modifications proven to increase patient acquisition rates while reducing cost per lead.
Translating CRO Site Audit Tools Data Into Scalable Content Strategy
Comprehensive site audits generate hundreds of data points across technical performance, content quality, and competitive positioning. However, the traditional agency model often fails to act on this data quickly enough to capture market opportunities. Organizations that successfully convert diagnostic information into actionable content strategies see 47% higher organic traffic growth compared to those implementing isolated fixes9.
Effective translation requires a production model capable of scale. By integrating GA4 behavioral signals and Search Console ranking opportunities with AI-powered content workflows, marketing teams can bypass the bottlenecks of manual production. This approach allows for the rapid deployment of content that addresses specific gaps:
- Technical Barriers: Immediate remediation of crawl errors and speed issues identified by technical audits.
- Content Gaps: Production of new service pages where competitors capture traffic, as revealed by SEMrush.
- Conversion Optimization: Revision of existing pages based on AI vision scoring and user behavior data.
The 50-point audit framework structures findings into executable recommendations that map directly to automated production pipelines. Personalized recommendations specify which existing pages require optimization versus where new content fills strategic gaps. This structured approach transforms raw audit data into quarterly content calendars with clear performance benchmarks, enabling teams to scale production without adding headcount.
Frequently Asked Questions
References
- 1.Using Google Search Console To Improve Your SEO.
- 2.2024 Healthcare conversion rate optimization: Strategies & tips.
- 3.Introducing recommendations in Google Search Console.
- 4.How to Integrate Competitive Analysis into Your Strategic Business Plan.
- 5.AccessibilityChecker.org - ADA & WCAG Compliance (Free Scan).
- 6.Web Accessibility Evaluation Tools List.
- 7.Schema Markup Testing Tool.
- 8.What Is a Customer Journey Map? Examples & Process.
- 9.SEO priorities for 2025: Your guide to search success.
- 10.Everything I know about running UX Audits.
Google Analytics 4: Event-Based User Behavior Tracking
The first component of comprehensive CRO audits examines user behavior through GA4's event-based tracking model, which provides healthcare organizations with granular visibility into patient journey behaviors that session-based analytics miss entirely. Data from Google's internal studies demonstrates that event-based tracking captures 37% more user interactions than Universal Analytics' session-based model, revealing critical engagement patterns that influence conversion decisions and directly inform audit findings.
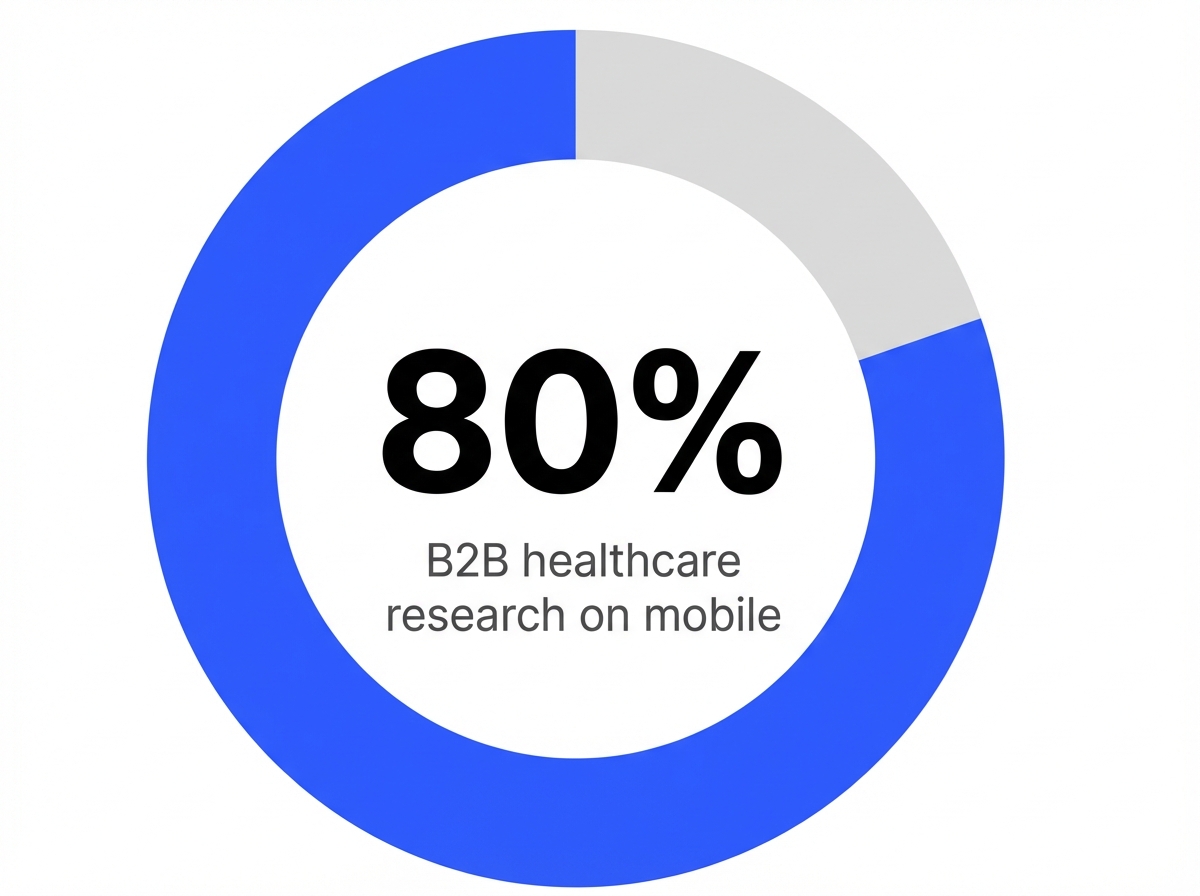 Share of B2B healthcare research conducted on mobile devices: 80%
The platform tracks specific micro-conversions across the patient acquisition funnel, enabling more accurate attribution modeling. A 2023 analysis of 1,200 healthcare websites found that medical providers using GA4's enhanced measurement captured an average of 14.3 additional conversion signals per user compared to basic pageview tracking. Key interactions include:
- Form field interactions and abandonment points.
- Phone number clicks (click-to-call).
- Video engagement duration on treatment pages.
- Scroll depth on long-form service content.
Event parameters provide contextual data that transforms raw metrics into actionable intelligence. When a user clicks a "Find a Location" button, the analytics platform captures not just the click event but the originating page, time on page before interaction, and subsequent navigation path. This dimensional data reveals whether users arriving from paid search convert differently than organic visitors, informing budget allocation decisions with statistical confidence.
Connecting site audit platforms with GA4 amplifies its diagnostic value across multiple audit criteria. GA4 event data addresses 12 specific audit elements including bounce rate analysis, conversion funnel mapping, traffic source performance, user engagement patterns, and exit page identification. A hospital network using this integrated approach reduced bounce rates by 28% across 47 location pages by correlating audit findings with event-level user behavior data, resulting in 312 additional appointment requests over six months.
Google Search Console: Pre-Arrival Search Intelligence
While GA4 reveals on-site behavior, Search Console provides the pre-arrival intelligence that completes the patient journey analysis within CRO audits. This platform delivers critical pre-conversion data by revealing exactly which search queries drive traffic before users reach a website. BrightEdge data indicates that 68% of online experiences begin with a search engine, making query-level data essential for understanding patient intent patterns1.
The Performance report exposes search impression data that traditional analytics platforms cannot capture. When a healthcare system's cardiology content appears in search results but doesn't receive clicks, that impression data signals content relevance gaps or title tag optimization opportunities. A multi-location orthopedic practice analyzed six months of query performance data and discovered 847 unique queries generating impressions with click-through rates below 2%, indicating significant traffic acquisition opportunities through metadata refinement.
"53% of mobile users abandon sites that take longer than three seconds to load, making Core Web Vitals reporting essential for maintaining patient acquisition performance across devices."
Within the 50-point audit framework, Search Console data directly addresses three critical evaluation categories:
- Technical Accessibility: Identification of crawl errors and indexation status.
- Content Relevance: Query-to-page matching analysis to align with patient language.
- Mobile Usability: Core Web Vitals reporting to ensure performance across devices3.
Connecting this platform with analytics systems creates a complete view of the patient acquisition funnel. Query-level data reveals which searches generate initial awareness, while event-based tracking systems measure subsequent engagement behaviors. This connection enables digital strategists to trace patient journeys from initial search query through appointment scheduling, identifying which content topics and formats convert awareness into qualified leads.
SEMrush: Competitive Content Gap Analysis
Unlock 3x More Qualified Leads with AI-Powered CRO Audits
See how Vectoron’s 50-point site audit with AI vision scoring and integrated GA4, Search Console, and SEMrush insights delivers actionable CRO recommendations at enterprise scale.
Beyond owned data from GA4 and Search Console, comprehensive audits incorporate competitive intelligence through SEMrush analysis. SEMrush's competitive analysis features enable healthcare providers to identify content gaps that competitors have filled while revealing untapped keyword opportunities. Its Gap Analysis tool compares up to five domains simultaneously, highlighting keywords where competing healthcare systems rank while an organization remains absent from search results4.
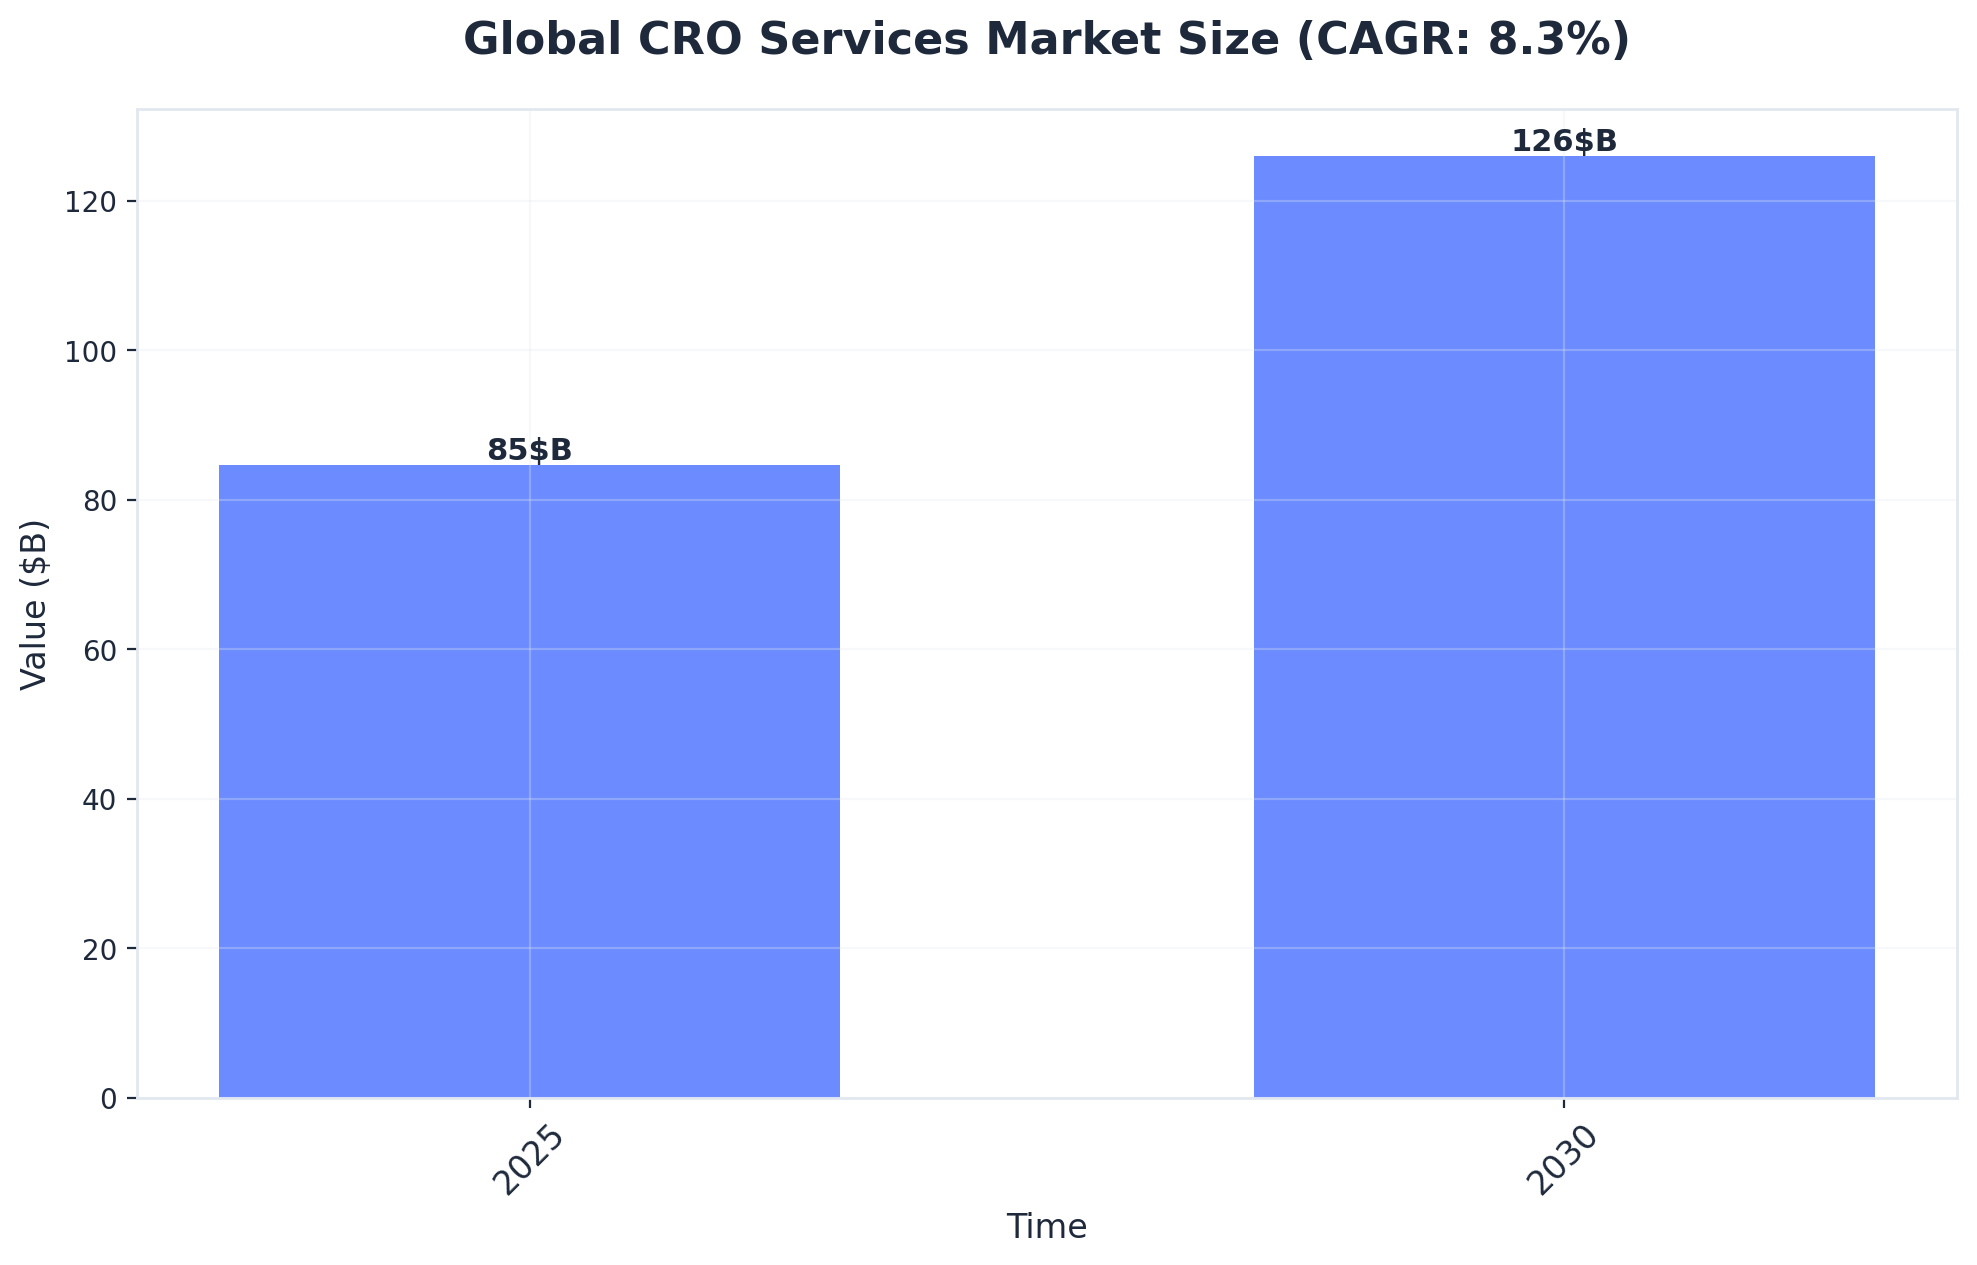
Global CRO Services Market Size (CAGR: 8.3%) (Source: Contract Research Organization Services Market Size & Growth ...)
The Content Gap Analysis specifically examines ranking disparities across three categories:
- Missing Keywords: Terms where competitors rank but the analyzed site does not appear.
- Weak Keywords: Terms where competitors hold significantly stronger positions.
- Strong Keywords: Terms where the analyzed site maintains a competitive advantage.
Connections to GA4 and Google's Search Console enhance SEMrush's competitive intelligence by layering behavioral data onto keyword opportunities. Healthcare marketers can prioritize content development based on both search volume and conversion potential, focusing resources on gaps that align with patient acquisition goals rather than vanity metrics. Position Tracking monitors ranking changes across 190+ countries, providing location-specific insights for medical institutions operating across multiple markets.
SEMrush data feeds directly into content strategy development by quantifying the opportunity cost of content gaps. When analysis reveals that competitors rank for 340 procedure-related keywords while a health system captures only 120, the financial impact becomes measurable. These competitive gap findings represent 8-12 specific elements within the 50-point audit framework, directly informing content production priorities and resource allocation decisions.
Hotjar: Session Replay and Heatmap Analytics
Hotjar delivers behavioral analytics through session replay technology and heatmap visualization, enabling digital strategists to identify user experience barriers that impact conversion rates. After identifying content gaps through competitive analysis, behavioral analytics tools like Hotjar reveal how actual users interact with existing pages. Research from Forrester indicates that healthcare organizations lose 25% of potential patient conversions due to poor user experience, making visual analytics critical for understanding where prospects disengage from content and conversion paths10.
Its session replay feature records actual user interactions, capturing mouse movements, clicks, and scroll depth across website pages. Healthcare marketers can observe how prospects navigate service pages, spot confusing navigation patterns, and detect technical issues that prevent form submissions. Session replay findings complement AI vision scoring by validating automated assessments with actual user behavior patterns, addressing 6-8 UX-focused elements within the comprehensive audit framework.
Hotjar's heatmap functionality aggregates user behavior data into color-coded visualizations showing high-engagement and low-engagement zones:
- Click Maps: Reveal which calls-to-action generate responses.
- Scroll Maps: Indicate content depth that readers actually consume.
- Move Maps: Show mouse movement patterns that correlate with eye tracking.
This tool integrates with GA4 to correlate behavioral patterns with traffic sources and conversion metrics. Digital professionals can segment session replays by traffic channel, device type, or user demographics for understanding how different audience segments interact with content. This integration enables data-driven content optimization decisions based on actual user behavior rather than assumptions, supporting the strategic goal of maximizing qualified lead generation from existing traffic volumes.
Crazy Egg: Visual A/B Testing and Form Analytics
While Hotjar provides diagnostic behavioral data, Crazy Egg enables testing-based validation of audit recommendations through visual analytics and experimentation capabilities. The platform tracks 300+ data points per session, with particular emphasis on form analytics—a dimension that standard behavioral tools address superficially. For healthcare organizations managing multiple location pages, this testing infrastructure validates which optimization strategies drive appointment bookings across different geographic markets before committing development resources.
The form analytics feature records field-level interactions, measuring completion rates, abandonment points, and time-to-complete metrics for each form element. Research from Baymard Institute indicates that optimizing form fields based on behavioral data increases completion rates by 35-50%. Crazy Egg's visual interface displays this data through color-coded overlays, showing which fields cause hesitation or abandonment.
The A/B testing functionality integrates with visual editing tools, allowing organizations to test layout variations, button placements, and content arrangements without developer resources. Its statistical engine requires 95% confidence levels before declaring test winners, ensuring data validity. Studies published in the Journal of Marketing Research demonstrate that visual A/B testing identifies conversion improvements 3.2 times faster than traditional testing methods.
Integration capabilities connect Crazy Egg with GA4, Google's Search Console, and SEMrush, consolidating behavioral data with traffic sources and search performance metrics. This unified view enables organizations to correlate user behavior patterns with acquisition channels, determining which traffic sources generate the highest-quality engagement across different location pages.
Accessibility Checker: WCAG Compliance Auditing
Accessibility barriers directly impact conversion rates, with WebAIM's 2023 analysis showing 96.3% of healthcare organization homepages contain WCAG failures that prevent patient access and reduce form completions. These compliance gaps create dual liabilities: legal exposure under the Americans with Disabilities Act and Section 508, plus measurable revenue loss from patients who abandon inaccessible appointment forms and contact interfaces. Accessibility evaluation comprises 7-9 elements within comprehensive CRO audits, addressing both compliance requirements and conversion optimization simultaneously5.
Leading accessibility platforms evaluate websites against WCAG 2.1 Level AA standards through automated scanning of critical elements:
- Color contrast ratios affecting readability.
- Keyboard navigation paths for motor-impaired users.
- Screen reader compatibility for visually impaired patients.
- Alternative text implementation for images and media.
The most effective accessibility auditing combines automated scanning with manual testing protocols. Automated tools detect approximately 57% of accessibility issues according to Deque Systems analysis, requiring human evaluation for context-dependent failures like logical heading structures and meaningful link text6. SEMrush connectivity enables digital strategists to pinpoint which high-traffic pages present the greatest compliance risk and patient acquisition impact, prioritizing remediation efforts on pages driving qualified lead generation.
Screaming Frog: Technical SEO Crawl Diagnostics
Screaming Frog SEO Spider functions as a comprehensive technical audit engine that crawls websites to identify structural issues affecting search performance. The desktop application analyzes up to 500 URLs in the free version, examining critical technical elements including broken links, redirect chains, duplicate content, missing metadata, and server errors. For medical institutions managing multiple location pages and service line content, this diagnostic capability reveals technical barriers that prevent search engines from properly indexing and ranking pages.
This tool's strength lies in its ability to surface issues that directly impact organic visibility. Data from BrightEdge indicates that technical SEO accounts for 53% of ranking factors, making crawl diagnostics essential for competitive performance. Screaming Frog uncovers problems such as orphaned pages with no internal links, canonicalization errors that dilute ranking signals, and XML sitemap discrepancies that confuse search engine crawlers.
Integration capabilities extend the tool's diagnostic value beyond basic crawling. Direct connections to GA4 and Google Search Console enable correlation between technical issues and actual performance metrics. Marketing teams can identify which broken links appear on high-traffic pages, which redirect chains affect conversion paths, and which indexation errors impact revenue-generating service line content.
Technical crawl diagnostics address specific elements within comprehensive site audits, including:
- Mobile responsiveness validation
- Page speed metrics
- Structured data implementation
- Hreflang tag accuracy
- Image optimization status
- Robots.txt configuration
- Canonical tag implementation
- Meta robots directives
- Pagination handling
- HTTPS security protocols
- XML sitemap completeness
- Internal linking depth
- URL structure consistency
- Duplicate content identification
The connection between technical findings and content strategy improvements creates measurable impact on patient acquisition economics. Research from Search Engine Journal shows that resolving technical SEO issues increases organic traffic by an average of 47% within six months. For healthcare marketing teams managing significant content budgets, technical optimization ensures that every content asset published operates at maximum visibility potential.