
Key Takeaways
- Treat the SaaS blog as acquisition infrastructure accountable to CAC payback math, not as discretionary content spend measured by traffic volume alone.
- Pillar-and-cluster only compounds when SEO, paid search, and link acquisition share one ranked keyword set with at least 60% overlap reviewed against a single pipeline number.
- Sustaining nine or more posts per month, the cadence correlated with ~35.8% YoY organic traffic growth 1, requires documented capabilities rather than additional writer headcount 2.
- Move dashboards past diagnostic traffic to outcome metrics—visitor-to-opportunity conversion rate, blog-sourced CAC, and pipeline contribution by cluster—before defending next year's budget 311.
The Blog as Acquisition Infrastructure, Not Content Marketing
A SaaS blog is a capital asset that produces pipeline, or it is a cost center that produces traffic nobody on the revenue team trusts. There is rarely a middle position once a company crosses $5M ARR.
The category called "content marketing" has obscured this. It groups a Series B horizontal SaaS publishing for sales-qualified intent next to a lifestyle brand publishing for impressions, as if the two activities share a P&L logic. They do not. Subscription revenue requires a continuous flow of new customers entering the funnel to offset churn and hit growth targets, which makes top-of-funnel acquisition a permanent line item rather than a campaign 4. The blog either feeds that flow at a measurable cost per acquired customer, or it does not belong in the budget.
Reframing the blog as acquisition infrastructure changes three things at once. Investment sizing moves from "what is a reasonable content budget" to CAC payback math the CFO already runs on every other channel, using the same conversion-rate and customer-acquisition-cost formulas applied to paid media 3. Production decisions stop being about hiring more writers and start being about whether the system can sustain the cadence the data rewards. Measurement stops at business outcomes — pipeline, qualified opportunities, closed revenue — rather than the diagnostic traffic numbers most dashboards still lead with 5.
The rest of this guide treats the blog accordingly: as one coordinated subsystem inside a customer acquisition operating model, sharing a keyword set with paid search and link acquisition, and accountable to the same revenue math. The teams pulling ahead in 2025 are not writing more. They are running a tighter system.
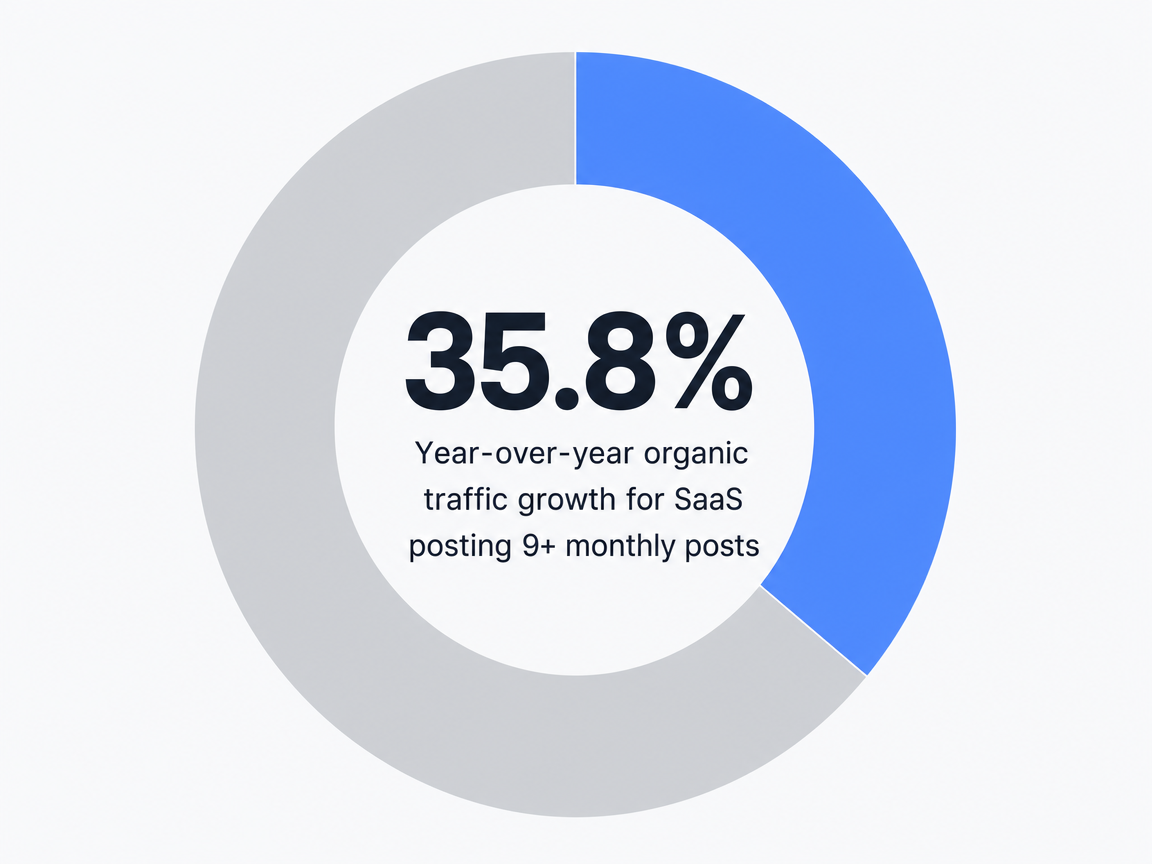 Year-over-year organic traffic growth for SaaS posting 9+ monthly posts: 35.8%
Sizing the Investment: CAC Payback Math for Blog Spend
The Subscription Math That Forces Continuous Acquisition
Subscription revenue compounds in one direction and erodes in the other. Every month, a percentage of the existing book churns, and the difference between flat revenue and 40% net new ARR growth comes down to whether the top-of-funnel pipeline keeps pace with both replacement and expansion targets 4.
That math has a direct consequence for content budgets. A blog is not discretionary brand spend in this model — it is one of three or four channels carrying the load of a continuous acquisition obligation. The CFO who funds Google Ads on a 12-month payback expects the same arithmetic from organic content: cost in, qualified pipeline out, payback period defined.
The framing matters because it dictates what gets measured. Most SaaS finance teams already calculate customer acquisition cost as fully-loaded marketing and sales spend divided by new customers acquired in the period 3. A blog enters that calculation as either a contributor to the numerator with attributable pipeline, or as overhead drag with none. There is no third option once the company is past Series A and burn discipline tightens.
The job, then, is to instrument the blog so it shows up on the right side of that ledger.
Modeling Cost-Per-Post Against Pipeline Contribution
The unit economics of a blog reduce to four variables: cost per published post, monthly cadence, conversion rate from organic visitor to qualified opportunity, and average contract value of customers sourced through that channel.
Cost per post is the most distorted number on most marketing P&Ls. It rarely includes the loaded cost of strategist time on briefs, SEO review, editorial cycles, design, and publishing — only the freelance invoice or the writer's salary slice. A realistic figure folds in every hour of human attention from keyword selection through publication.
Cadence then multiplies that cost. Publishing four well-researched posts a month at a true loaded cost of several thousand dollars per post produces a different annual investment than publishing nine, and the pipeline yield does not scale linearly with either input.
Conversion rate from organic visit to opportunity is where the model lives or dies. Harvard Business School's standard formulation — conversions divided by visitors, multiplied by 100 — gives the working ratio 3. SaaS blogs aligned to commercial-intent keywords typically convert organic traffic to email captures at low single digits and to opportunities at fractions of a percent. Multiplying that fraction by realistic ACV and gross margin produces the contribution number that has to clear annual production cost for the channel to be solvent.
Pipeline contribution at scale, then, is a cadence problem more than a creativity problem.
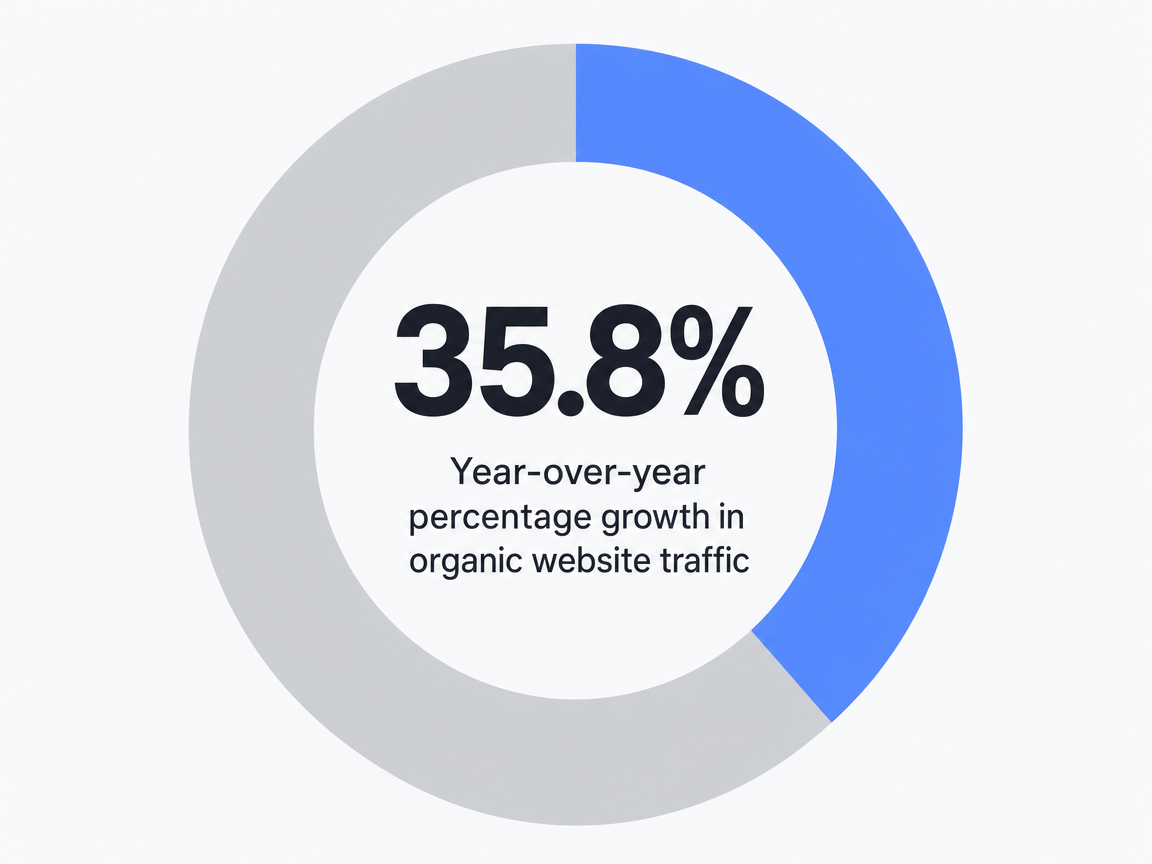 Year-over-year percentage growth in organic website traffic: 35.8%
Blog Investment Scenarios: A CAC Payback Comparison
The table below models three cadence scenarios using variables only — no invented dollar figures. Each scenario assumes the same loaded cost-per-post (C) and the same average contract value (ACV), with conversion rates drawn from the standard HBS formula of conversions ÷ visitors × 100 3. Organic traffic growth assumptions reflect the published correlation between cadence and year-over-year traffic in SaaS 1.
| Variable | Low Cadence (4 posts/mo) | Mid Cadence (6–8 posts/mo) | High Cadence (9+ posts/mo) |
|---|---|---|---|
| Annual posts published | 48 | 72–96 | 108+ |
| Annual production cost | 48 × C | 72–96 × C | 108 × C |
| YoY organic traffic trajectory | Modest, often flat | Moderate growth | ~35.8% YoY increase observed in benchmark data 1 |
| Visitor-to-opportunity rate | (conv ÷ visitors) × 100 3 | Same formula, larger denominator | Same formula, largest denominator |
| Pipeline contribution | Visitors × conv rate × ACV × close rate | Higher visitor base, same multiplier | Highest visitor base, compounding effect |
| Typical CAC payback window | Often beyond 18 months or never | 12–18 months | 9–14 months as cadence compounds |
Two patterns show up consistently. Low cadence rarely earns its production cost back inside a SaaS company's payback tolerance because the organic surface area never grows large enough for compounding to take hold. High cadence inverts the curve — the same per-post cost spread across more posts produces a steeper traffic ramp and a shorter window before contribution clears investment.
The strategic implication is sharper than the numbers suggest. The question for a $5M–$50M ARR company is not whether to fund a blog. It is whether the production system can sustain the cadence the math actually rewards, without the headcount cost that breaks the model.
Why Pillar-and-Cluster Fails Without Channel Coordination
The Coordination Problem Across SEO, Paid, and Links
Pillar-and-cluster became the default SaaS content architecture for a reason: it organizes topical authority around a buyer's intent path and gives Google a clean signal about which page deserves to rank for which query. The model is structurally sound. The execution failure is almost never the cluster map. It is that the cluster map exists in a vacuum while paid search and link acquisition are run by different people targeting different keyword sets on different timelines.
A typical mid-market SaaS team operates three parallel demand programs. The content team builds a cluster around a pillar like "customer onboarding software," optimizing for a long tail of informational queries. The paid team bids on "onboarding software" and competitor terms picked from a separate spreadsheet built around CPC efficiency. The link-building vendor pursues domains based on DR thresholds rather than topical relevance to the pillar. Three plans, three keyword sets, three reporting cadences.
The result is an organic page ranking page two for a query the company is simultaneously paying $14 a click to win, while inbound links land on unrelated posts. The cluster never accumulates the authority signals it was designed to compound, and the paid budget subsidizes traffic the blog should be earning for free 5.
One Keyword Set, Three Channels: How Coordination Actually Works
Coordinated demand programs share a single ranked keyword set and assign each term to the channel with the highest probability of winning it at the lowest fully-loaded cost. The keyword set is the unit of planning, not the channel.
For a Series B horizontal SaaS, that often means the pillar page and its top three commercial clusters get triple coverage: organic content for the long tail and informational head, paid search for the high-intent transactional terms while organic rank is still climbing, and targeted link acquisition pointed at the exact pillar URLs the SEO team needs to push past page-two rankings. Same terms, three reinforcing motions, one report.
The operational test is simple. Pull the top 50 keywords each channel is currently working. If overlap is below roughly 60%, the programs are not coordinated — they are three separate budgets producing three separate yields, and the blog is carrying the heaviest cost-per-result of the three because it has the longest payback curve 3.
The fix is not a new agency or a bigger team. It is a planning surface where SEO, paid, and link targets are selected from one keyword set and reviewed against one pipeline number every week 6.
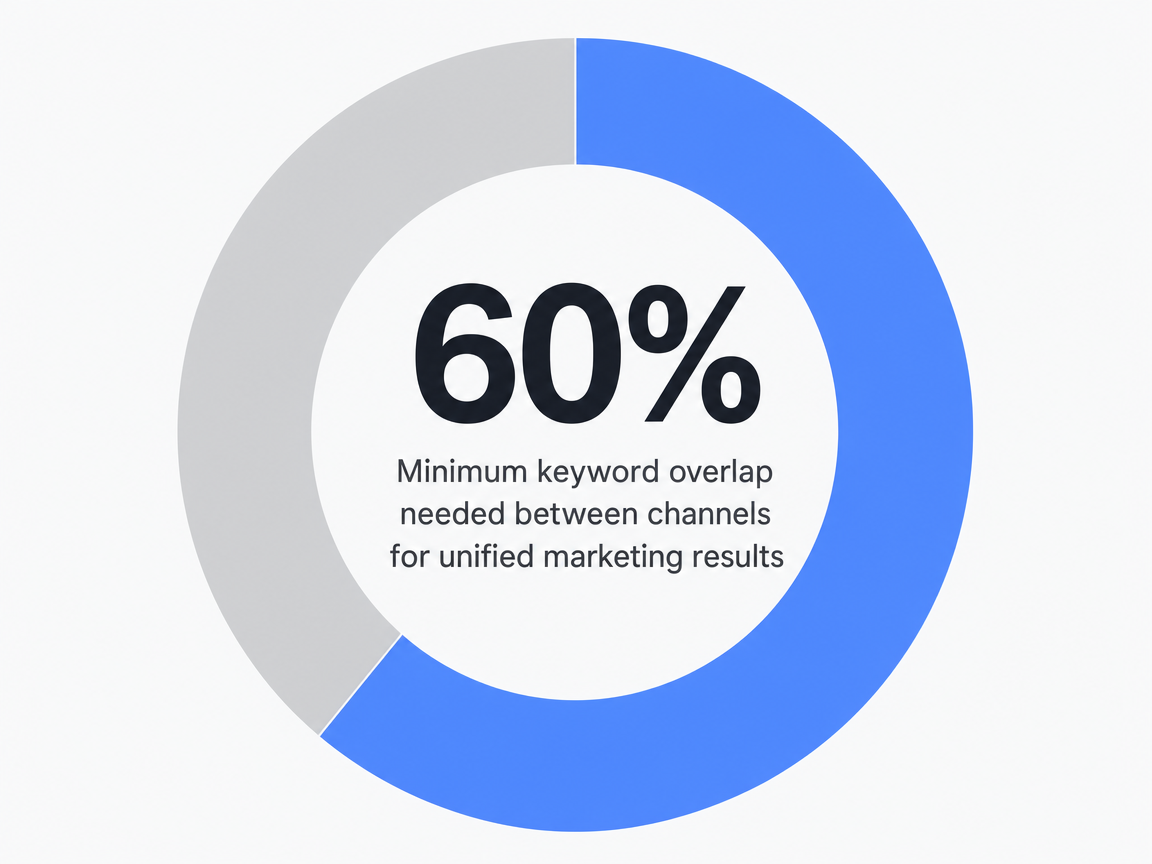 Minimum keyword overlap needed between channels for unified marketing results: 60%
Test Data-Driven Blog Growth in One Week
Experience measurable traffic impact from live content published during your risk-free trial.
Demand Research Before Production
Keyword-to-Intent Mapping for High-Probability Topics
Production cadence without demand research is just expensive output. Before a single brief gets written, the keyword set needs to be sorted by what the searcher is actually trying to do — evaluate vendors, learn a concept, troubleshoot a workflow, or compare alternatives — because intent dictates which posts can plausibly convert and which will pull traffic that never reaches a pricing page 6.
The mapping exercise is straightforward in structure and unforgiving in execution. Each candidate keyword gets tagged with three attributes: search intent (informational, commercial-investigation, transactional), proximity to the company's ICP problem space, and the realistic probability of ranking given current domain authority and SERP competition. Terms scoring high on all three become pillar and cluster candidates. Terms scoring high on volume but low on ICP proximity get cut, regardless of how appealing the traffic number looks.
The discipline this enforces is what most content calendars lack. A Series B SaaS targeting RevOps leaders does not need to rank for "what is sales enablement" — it needs to own the twenty queries a VP of RevOps types when scoping a buying decision. Keyword-to-intent mapping is how that filter gets applied before production cost is committed 6.
The Demand-to-Revenue Chain: Mapping Posts to Conversion Events
Every blog post should have a named downstream conversion event before the brief is approved. Not a vague "drives awareness" tag — a specific next action the post is engineered to produce, with a measurable rate attached.
The demand-to-revenue chain reads in five links: keyword cluster, blog post, on-page conversion event, product trial or demo, closed revenue. Each link has its own conversion rate, and each rate decays the volume passing to the next. Organic visitors convert to email captures or content downloads at low single-digit percentages. Captured contacts convert to product trials at a smaller fraction. Trials convert to closed revenue at the rate the sales team already reports 3.
Multiplying those rates against the visitor volume a cluster realistically produces gives the pipeline contribution number for that cluster. Posts whose intent is too far upstream — pure educational content with no plausible conversion path — show up in this model as what they are: brand spend, not pipeline spend. That is a legitimate budget category, but it should be funded explicitly, not smuggled into the pipeline forecast.
The mapping exercise also surfaces the on-page conversion gap most blogs carry. A post ranking for a commercial-investigation query with no relevant CTA, no comparison asset, and no trial offer in the reading path is leaking the entire downstream chain. Fixing the conversion event on existing high-traffic posts often produces faster pipeline lift than publishing new ones 5.
Plotting the chain for every active cluster turns the editorial calendar into a pipeline forecast. Posts get prioritized by expected contribution rather than topic enthusiasm, and the conversation with finance shifts from defending content spend to reviewing a yield curve.
Production Systems That Sustain Cadence Without Headcount
What 9+ Posts Per Month Actually Requires Operationally
The cadence threshold that moves the traffic needle in SaaS is well-documented: companies publishing nine or more posts per month see roughly 35.8% year-over-year organic traffic growth, well above the trajectory of teams publishing four or fewer 1. The number is cited often. The operational reality behind it is rarely examined.
Nine posts per month means roughly two publishable assets per week, every week, with no seasonal collapse and no Q4 catch-up scramble. Each asset moves through keyword selection, brief construction, draft, SEO review, design, internal review, and publishing. At a typical SaaS quality bar — 1,800 to 2,500 words, original analysis, custom visuals, accurate technical detail — that is somewhere between 18 and 30 hours of cumulative human attention per post when the work is done by people, not templates.
Multiplied by nine, the monthly load is 160 to 270 hours of focused production work. A two-person content team without structured production cannot absorb that and still own strategy. The math forces one of three outcomes: hire more headcount, drop quality, or replace manual coordination with a system that compresses the production cycle without compressing the editorial standard.
The first option breaks the CAC payback model laid out earlier. The second breaks the conversion economics. Only the third survives both tests, which is why the production question is the binding constraint on every other decision in this guide.
The 12-Capability View: Systems Over Specialists
Forrester's framework for modern digital marketing teams identifies twelve capabilities that span strategy, production, and execution — and makes the case that the path to scale runs through structuring those capabilities, not hiring a specialist for each one 2. The distinction matters because the default response to a cadence shortfall is almost always a hiring requisition, and the math rarely supports it.
A capability is repeatable work that can be documented, instrumented, and assigned. A specialist is a person whose tacit knowledge walks out the door at 5 p.m. Teams that scale content production without scaling headcount do so by converting specialist judgment into capability — keyword scoring rubrics, brief templates tied to intent categories, SEO review checklists, design systems for in-post visuals, and conversion-event mapping that runs the same way every week regardless of who is at the keyboard 2.
The practical effect is that one strategist plus a structured production system outperforms three writers working independently, because coordination overhead drops to near zero and per-post cost falls without quality loss. That is the operational shape of the cadence the data rewards 1. The blog earns its line item on the P&L by running like a system, not a roster.
Unlock Scalable Digital Marketing Blog Strategies for SaaS Growth
Connect with experts to see how coordinated SEO, PPC, and content workflows can drive measurable acquisition results across all your SaaS or agency portfolios—without increasing headcount or operational drag.
Measurement: Diagnostic, Engagement, and Outcome Metrics
The Three-Tier Hierarchy and Where Most Teams Stop Too Early
Blog measurement organizes cleanly into three tiers, and most SaaS dashboards never make it past the first one. Diagnostic metrics — sessions, bounce rate, click-through rate from SERPs — describe whether content is being found and opened. Engagement metrics — scroll depth, time on page, pages per session — describe whether it is being read. Business outcome metrics — qualified opportunities sourced, customer acquisition cost contribution, conversion rate from organic visitor to closed revenue — describe whether it is producing money 58.
The hierarchy matters because each tier answers a different question, and stopping at tier one is the most common reason marketing reports do not survive a finance review. Traffic going up is a diagnostic signal, not a result. It tells the team the content is indexed and the topics have search volume. It does not tell the CFO anything she can act on.
The outcome tier is where the conversation with finance becomes possible. Conversion rate from organic visitor to opportunity, calculated as conversions divided by visitors multiplied by 100, plugs directly into the same CAC and LTV formulas every other channel reports against 3. The board deck question shifts from "how much traffic did the blog get" to "what was the blog's CAC, and how does it compare to paid?" — which is the only version of the question that justifies next year's budget 11.
Failure Modes: Traffic That Sales Rejects
The most expensive failure mode in SaaS content is traffic the sales team refuses to work. It shows up in the marketing report as a win and in the SDR pipeline review as noise — leads from posts ranking for queries adjacent to the ICP problem space, captured by a generic gated asset, then disqualified at the first call.
The disconnect is structural. When the editorial calendar optimizes for keywords with traffic potential rather than buyer intent, the resulting visitors convert at low rates and at low fit. A post ranking for "what is sales enablement" pulls students, job seekers, and adjacent-industry browsers — none of whom show up in the close-rate column 6.
Two diagnostics surface this early. The first is conversion rate by post: clusters built on commercial-investigation queries should convert organic visitors to qualified opportunities at materially higher rates than informational clusters 5. The second is sales-accepted lead rate by source post, which forces marketing and sales to share one definition of fit before the lead reaches a CRM stage.
Posts that fail both tests get reclassified as brand spend or retired. The blog earns its credibility with revenue when its outcome metrics survive sales scrutiny, not when its traffic chart looks good in isolation 8.
Operating Model Decisions for the Next Twelve Months
Three decisions determine whether a SaaS blog crosses into pipeline contribution over the next year, and none of them are about content topics.
The first is whether the keyword set is unified across organic, paid, and link acquisition. If the top 50 terms each channel works do not overlap by at least 60%, the next twelve months will repeat the last twelve — three budgets producing three disconnected yields, with the blog absorbing the longest payback curve 6. Pull the lists this quarter. Reconcile them before the next planning cycle starts.
The second is whether the production system can sustain the cadence the data actually rewards without breaking the headcount math. A team committing to nine or more posts per month on a credible quality bar needs documented capabilities — keyword scoring, brief templates, SEO review, conversion-event mapping — operating as repeatable workflows rather than tacit specialist knowledge 2. Hiring more writers is the answer that fails the CAC payback test laid out earlier in this guide.
The third is whether measurement reaches the outcome tier. Dashboards leading with sessions and bounce rate will not survive a 2025 finance review. Conversion rate from organic visitor to qualified opportunity, blog-sourced CAC, and pipeline contribution by cluster are the numbers that justify next year's line item 311.
Operators rebuilding this stack without expanding headcount are increasingly turning to AI-driven production platforms — Vectoron among them — that fold strategy, content production, and channel coordination into one system rather than three vendor relationships.
Frequently Asked Questions
References
- 1.60+ SaaS Marketing Statistics & Benchmarks for 2026 - Oliver Munro.
- 2.How To Build A Purposeful Digital Marketing Team - Forrester.
- 3.7 Marketing KPIs You Should Know & How to Measure Them - Harvard Business School Online.
- 4.The Rebirth of Software as a Service - Harvard Business Review.
- 5.Content Marketing Performance: Critical Metrics That Drive SaaS Success - Monetizely.
- 6.Determinants of content marketing effectiveness: Conceptual framework - PMC/NIH.
- 7.60+ SaaS Marketing Statistics & Benchmarks for 2026 - Oliver Munro.
- 8.12 Content Marketing Metrics & KPIs For SaaS Companies - Factors.ai.
- 9.How To Build A Purposeful Digital Marketing Team - Forrester.
- 10.The Rebirth of Software as a Service - Harvard Business Review.
- 11.Content Marketing Performance: Critical Metrics That Drive SaaS ....
- 12.Determinants of content marketing effectiveness: Conceptual ... - PMC.