
Key Takeaways
- The Executive Scorecard condenses revenue, non-brand growth, and technical health into one page for CFOs, with attribution methodology disclosed so finance teams cannot dispute the figures 2.
- The One-Page Content ROI Summary structures Spend, Return, Drivers, and Decisions so clients can fund, cut, or redirect content programs without wading through multi-tab spreadsheets 4.
- The KPI Dashboard runs continuously with green/amber/red thresholds tied to strategic goals, replacing weekly status meetings and flagging issues before the next monthly report 10.
- The Transparent Calculation Walkthrough exposes the visits × CVR × AOV arithmetic with GA4, GSC, and CRM sources stamped on each input, turning ROI claims into verifiable evidence 5.
- The Algorithmic Attribution Report compares last-click versus data-driven credit and discloses model limitations, giving finance teams defensible grounds to reallocate budget toward organic 7.
- The Incremental Lift Report layers multi-touch attribution with media mix modeling to isolate organic's true contribution, with a reconciliation panel explaining where the two methods diverge 6.
- The Local Search and Call Intelligence Report ties GBP visibility to call volume, qualification, and intake patterns, closing the offline conversion gap that last-click analytics miss 3.
- The Technical Health Scorecard flags crawlability, Core Web Vitals by template, structured data, and stability against thresholds, surfacing debt before it disrupts launches or revenue 3.
- The Quarterly Content Review issues kill, keep, and rewrite verdicts across the full URL inventory, preventing library bloat that inflates cost per indexed article 4.
- The Portfolio Rollup applies one standardized format across every location with a comparative summary, cutting production from H × N hours to a fixed setup plus marginal review 2.
Why report format is the product agencies actually sell
Clients renew retainers when monthly reports clearly demonstrate the value of their investment, where growth originates, and what future initiatives to fund. The report is the tangible deliverable executives interact with, while audits, briefs, and technical fixes support it.
Effective reporting prioritizes metrics directly linked to strategic goals, enabling actionable insights rather than overwhelming dashboards 10. The difference between these approaches has significant financial implications. Companies lacking proper attribution and measurement waste an estimated 25–30% of their marketing budget on underperforming channels, according to aggregated Forrester and McKinsey data 11. When a CFO identifies such discrepancies, the report becomes crucial for justifying agency value and preventing budget cuts.
The following nine report formats are designed to answer specific executive questions: revenue impact, non-brand growth, channel performance, technical stability, and content strategy. Each format identifies what it replaces in the current production stack, the key stakeholder for sign-off, and the underlying methodology. Agencies that standardize these formats can move beyond rebuilding decks from scratch, offering a repeatable and valuable artifact.
The Executive Scorecard: answering revenue, growth, and health in one view
The executive scorecard provides a concise, one-page overview addressing three critical questions: financial performance, non-brand growth, and system health 2. This format is intended for CFOs or founders and is pivotal for retainer renewal during budget reviews.
It replaces lengthy monthly decks that executives rarely fully review. The scorecard features three main blocks: organic-attributed revenue or qualified leads, non-brand traffic and market share trends, and a technical status flag. Each block includes a delta compared to the prior period and against goals 1. A brief narrative explains the driver behind the numbers, for example, "Non-brand clicks up 18% on category pages after intent restructuring," rather than just "CTR improved."
Methodology transparency is essential for a credible scorecard. Research indicates that the choice of attribution model can alter calculated channel ROI by 30–40% for identical marketing activities, with an average of 31.4% of conversion credit reallocated when shifting from last-click to rule-based multi-touch models 8. While this study focused on enterprise digital ad accounts, the implication for organic reporting is clear: reporting organic ROI without disclosing the attribution model invites skepticism from finance teams.
To address this, a methodology footer should specify the attribution model used, the lookback window, and which conversions are counted as organic. The account lead must sign off on the scorecard before delivery, ensuring its integrity.
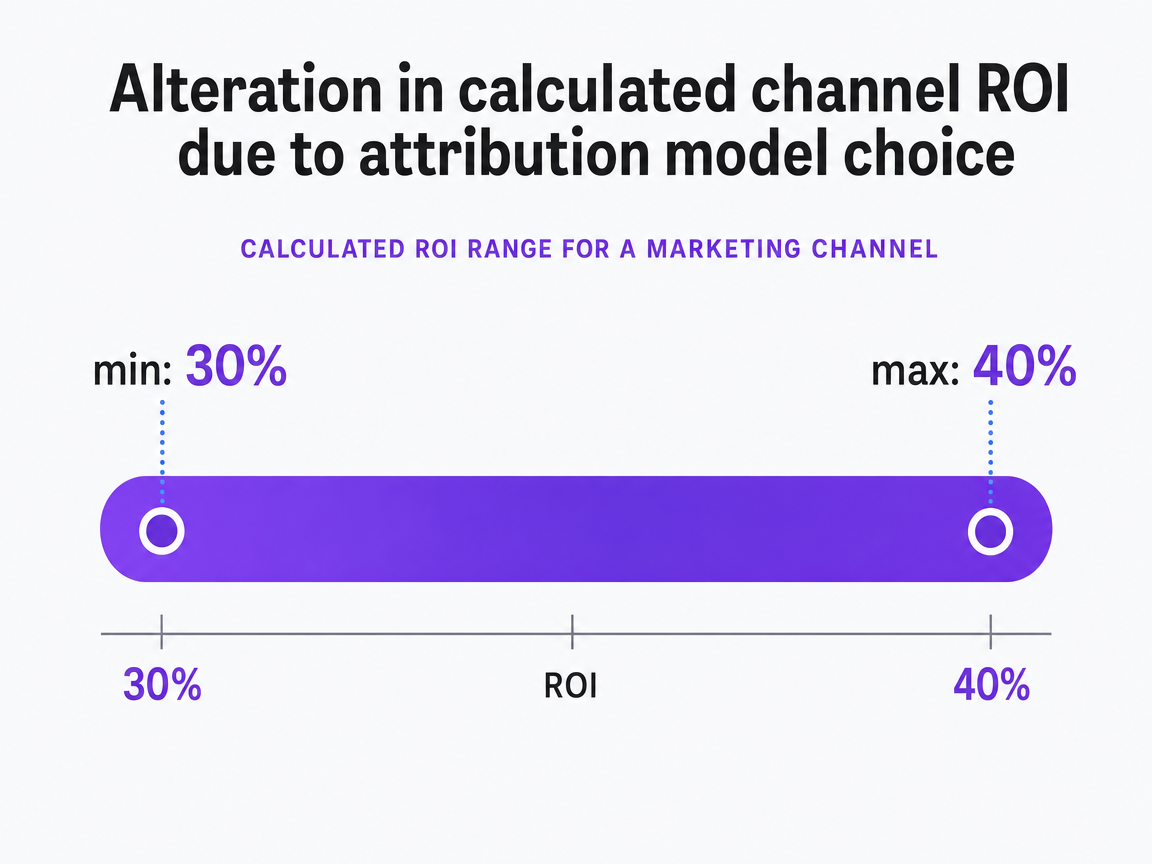 Alteration in calculated channel ROI due to attribution model choice
Illustrates how much the calculated ROI for a marketing channel can change simply by choosing a different attribution model.
The One-Page Content ROI Summary: spend, return, drivers, decisions
Content programs often suffer from overly complex reporting. A single-page summary can streamline this. Four key blocks—Spend, Return, Drivers, Decisions—provide all necessary information for clients to fund, cut, or redirect their content strategy 4.
The "Spend" section details fully loaded costs, including writer fees, editor hours, tooling, and cost-per-published and cost-per-indexed article metrics. This highlights unindexed content inventory that might otherwise be overlooked 4. The "Return" section presents organic conversions, assisted revenue or pipeline, and the ROI percentage calculated as: ROI % = (Return − Cost) / Cost × 100 4. A payback trend also shows whether the program is moving towards breakeven.
The "Drivers" section is where many content reports fall short. Instead of merely listing top pages by traffic, it identifies two or three key mechanisms that influenced performance, such as non-brand click gains on a specific cluster, improved CTR on high-impression queries, or content refreshes that boosted assisted pipeline. The "Decisions" block, though brief, is crucial, outlining what to publish, refresh, sunset, or reallocate budget towards, with each decision linked to a specific driver.
This format replaces the cumbersome, multi-tab content performance spreadsheets agencies often rebuild monthly. The head of marketing signs off before it reaches the CFO. Its concise, decision-forcing nature is key to renewing content retainers.
The KPI Dashboard: a live view tied to strategic goals, not metric exhaust
A KPI dashboard differs from a scorecard. It operates continuously, updates against predefined thresholds, and serves both the account team and the client. A common pitfall is displaying every available metric, leading to "metric exhaust"—a cluttered dashboard with no clear hierarchy or decision path. Research on KPI-driven reporting emphasizes that effective systems prioritize metrics directly linked to strategic goals, facilitating action rather than exhaustive, unhelpful lists 10.
The key is subtraction. For a lead-generation client, a dashboard might include qualified leads, cost per qualified lead, non-brand organic sessions, non-brand conversion rate, and a technical status indicator. For e-commerce, it would feature organic revenue, assisted revenue, and product-page indexation coverage. The specific tiles adapt to the client's goals, but the total count remains under a dozen.
Evidence supports linking dashboards to strategic KPIs. Aggregated research, including Forrester and McKinsey benchmarks, indicates that companies with advanced analytics achieve 15–25% higher marketing efficiency and grow revenue 1.5–2x faster than those without sophisticated attribution 11. While these figures reflect enterprise marketing across multiple channels, the principle applies: dashboards that highlight critical metrics enable faster decisions than those that present everything.
Thresholds provide a second layer of utility. Each tile displays a green, amber, or red status based on a defined target, not just month-over-month changes. Amber triggers a Slack notification to the account lead, while red prompts a client-facing note in the next weekly update. This transforms the dashboard from a passive report into an active operational alert system.
This KPI dashboard replaces weekly status meetings. The account lead reviews it each Monday, and clients can check it anytime for proof of progress. It answers the executive question between monthly reports: "Is anything critical happening right now?"
Test real SEO reporting workflows in production
See how actionable SEO reports drive measurable client ROI before making a commitment.
The Transparent Calculation Walkthrough: visits × CVR × AOV, sourced from GSC and GA4
Executives lose trust in ROI figures when the underlying calculations are opaque. The transparent calculation walkthrough addresses this by detailing the arithmetic behind headline numbers, identifying the source system for each input, and allowing a skeptical CFO to independently verify the figures.
This format centers on the formula: Organic Revenue = organic visits × conversion rate × average order value, with SEO ROI calculated as (Organic Revenue − SEO Investment) / SEO Investment × 100 5. Each input is clearly sourced. Organic visits come from GA4, with the channel definition disclosed. Conversion rate is calculated for the same segment, not a site-wide average. Average order value (AOV) or average deal value is pulled from the CRM or e-commerce platform, noting whether refunds and cancellations are excluded. Google Search Console provides click and impression data, which is reconciled against GA4 sessions to ensure consistent understanding of "organic" 5.
For lead-generation clients, AOV is replaced with pipeline value per qualified lead and closed-won rate, maintaining the same structure of three multiplicative inputs, three source stamps, and one output.
This format replaces the "black-box" ROI slide often defended quarterly. The analyst who built the model signs off, and a reconciliation note flags any discrepancy greater than 5% between GSC clicks and GA4 organic sessions, proactively addressing potential client concerns. By exposing the arithmetic, the reported number becomes evidence rather than a mere claim.
The Algorithmic Attribution Report: showing incremental lift by channel
Last-click reporting consistently undervalues organic search. The algorithmic attribution report corrects this with a defensible model, providing evidence to reopen budget discussions that were previously stalled.
The report includes four blocks: channel credit under last-click, channel credit under an algorithmic model, the financial delta, and a plain-English explanation of how credit was reallocated. Empirical research supports the value of data-driven attribution; companies implementing algorithmic models achieved a 15% improvement in marketing ROI and 34.8% market share growth within 24 months, without increased budgets 7. This study focused on organizations fully deploying algorithmic models across their digital mix over a two-year period, providing a credible ceiling for potential gains rather than an immediate promise.
The report must also disclose the model's limitations. Peer-reviewed analyses of attribution methods highlight that algorithmic models can struggle with data sparsity, offline conversions, view-through activity, and may overfit with low conversion volumes 6. A limitations footer, detailing the training window, conversion volume, and excluded touchpoints, prevents the CFO from discovering these gaps independently.
This format replaces the quarterly "organic is undervalued" argument delivered without supporting data. The analytics lead signs off on the model configuration, and the account lead approves the narrative. The client receives a channel-credit comparison that their finance team can use to justify budget reallocation.
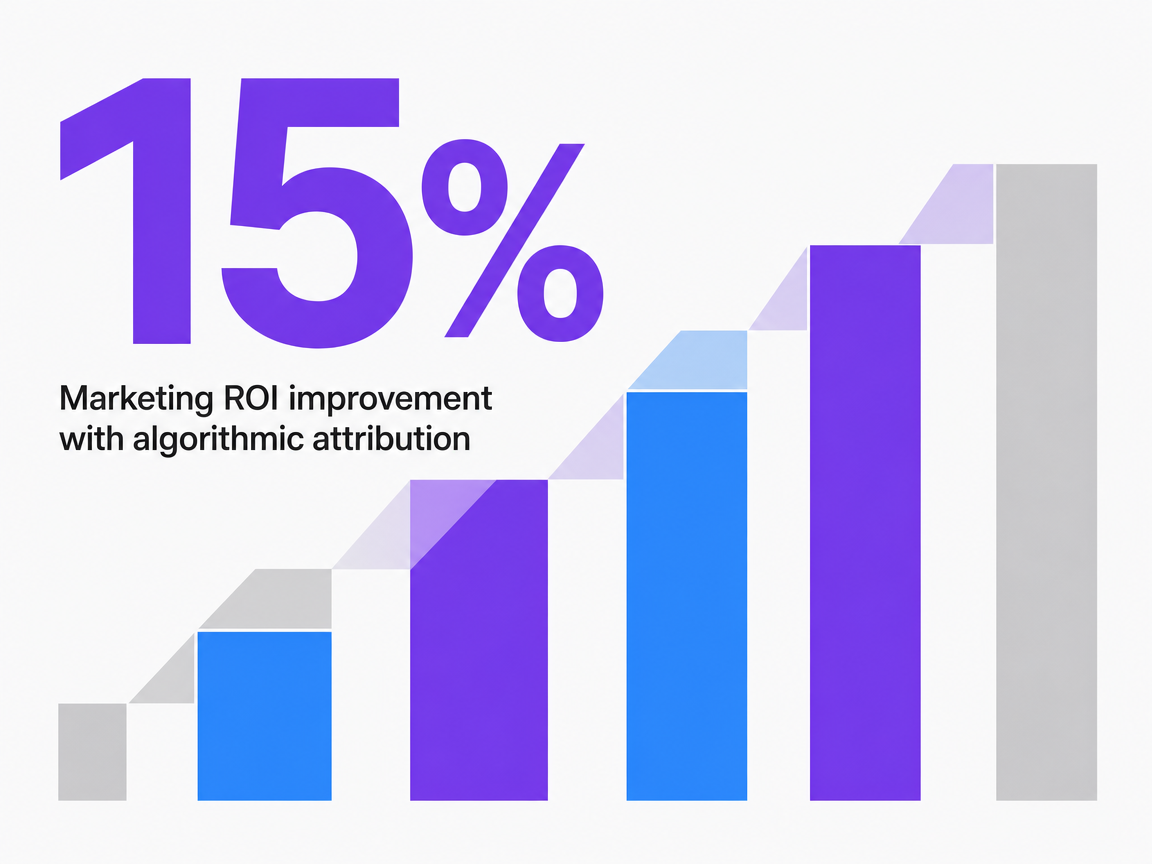 Marketing ROI improvement with algorithmic attribution
Marketing ROI improvement with algorithmic attribution
The Incremental Lift Report: pairing multi-touch attribution with media mix modeling
Multi-touch attribution (MTA) identifies touchpoints that assisted a conversion, while media mix modeling (MMM) estimates what would have happened without a specific channel. The incremental lift report combines both, recognizing that neither method alone provides a complete picture for clients with significant organic programs.
Peer-reviewed research views MTA and MMM as complementary. MTA offers granular, touchpoint-level credit within digital channels, while MMM provides causal, top-down estimates that account for offline activity, seasonality, and diminishing returns 6. Layering these methods allows agencies to quantify the incremental lift attributable to organic search, moving beyond just assisted revenue and completing the ROI reporting cycle 9.
The report structure features three panels. The MTA panel shows organic's credit under the algorithmic model, broken down by funnel stage. The MMM panel displays the modeled incremental contribution of organic over a rolling window, with confidence bands. The reconciliation panel highlights where the two methods agree, where they diverge, and the agency's recommended number for budget decisions, along with the rationale. Divergence is presented not as a flaw, but as evidence that the analyst understands the limitations of each method.
A scope footer ensures data integrity for the finance team. MTA requires sufficient conversion volume to prevent overfitting, and MMM needs a long enough media history (typically two years or more) to model saturation curves. Accounts that don't meet these thresholds receive an interim single-model report, with the data gap disclosed rather than fabricating a lift figure.
This format replaces annual planning arguments where organic budgets are cut due to cleaner last-click attribution from paid channels. The analytics lead signs off on the models, and the head of growth approves reallocation recommendations. The client receives a decision-ready view of which channels merit further investment.
The Local Search and Call Intelligence Report: closing the offline conversion gap
Many local SEO reports focus solely on Google Business Profile impressions and map-pack rankings, overlooking the significant revenue generated through phone calls. A report that ignores call content, qualification, and missed calls leaves a major local search conversion channel invisible to clients' finance teams.
The local and call intelligence format includes four blocks. "Local visibility" covers GBP impressions, direction requests, and map-pack presence for key queries. "Call volume" categorizes inbound calls by source (organic, GBP, paid), attributed via phone number or dynamic insertion. "Call quality" is where the report demonstrates its value, detailing qualified inquiries, missed calls, average handle time, and top intake patterns identified from transcripts. "Revenue impact" links qualified calls to booked appointments or closed deals using CRM data, with a clear definition of "qualified" for the specific account 3.
The intake pattern block often captures client attention. For example, if call transcripts reveal that 40% of qualified calls in a month inquired about an unprioritized service, this becomes a direct directive for content creation or PPC campaigns, not just a footnote. Reporting research emphasizes that metrics must drive decisions, not merely exist as ambient data 10. Call intelligence provides this direct link, as each tagged pattern suggests a page to build, a query to bid on, or a front-desk script to refine.
This format replaces the fragmented reporting common in many agencies: a rank-tracker screenshot, a GBP insights export, and a separate call log the client rarely provides. The account lead signs off on visibility and volume, while the strategist approves intake patterns and recommendations. The client receives a report that closes the offline conversion loop, which last-click analytics cannot see.
See Real-World SEO Reporting Formats That Quantify Impact
Request a walkthrough of data-driven SEO report templates designed for agencies—demonstrating ROI with segmented traffic, conversion, and pipeline attribution.
The Technical Health Scorecard: proving the system won't break the retainer
Technical debt often remains hidden until it disrupts a major launch or impacts revenue. The technical health scorecard makes this debt visible proactively, providing the account team with justification when core updates affect rankings.
The report comprises four blocks. "Crawlability" covers index coverage, orphan pages, and the gap between submitted and indexed URLs. "Performance" details Core Web Vitals status by template, not just site-wide averages, preventing slow product templates from being obscured by fast homepages. "Structured data" reports schema coverage and validation errors for critical organic visibility templates. "Stability" tracks server response codes, redirect chains, and canonical conflicts introduced since the last report 3. Each block uses a green, amber, or red flag against a defined threshold, rather than simply comparing to the previous month.
This scorecard replaces the extensive crawl exports clients rarely review. The technical lead signs off before it is distributed. The head of marketing receives a concise, one-page status report identifying issues, fixes, and potential threats to organic revenue within the next 30 days if problems persist.
The Quarterly Content Review: what to kill, keep, and rewrite
While monthly reports track ongoing activity, the quarterly content review assesses the entire content inventory. Its purpose is to evaluate every URL touched by the agency in the past 12 weeks and issue a clear verdict: kill, keep, or rewrite. Without this process, the content library grows inefficiently, increasing cost per indexed article and decreasing overall ROI 4.
The format includes three blocks. The "kill list" identifies underperforming URLs by cluster—pages with negligible non-brand clicks after 90 days, thin duplicates, and cannibalization pairs—along with recommended deindexation or consolidation actions. The "keep list" highlights the top decile by assisted revenue or qualified leads, marking them for internal-link reinforcement and refresh scheduling. The "rewrite list" is operational, focusing on pages with high impressions but weak CTR, or strong rankings for secondary intent, each paired with the specific gap the rewrite aims to close. KPI-driven reporting research emphasizes that metrics must lead to action 10, and this review forces that link quarterly.
This format replaces stagnant content backlogs. The content lead signs off on the kill and rewrite lists before the head of marketing reviews them. The result is a decision document, not merely a status update.
The Portfolio Rollup: one report format across many locations
For agencies managing multi-location clients, the economics of reporting shift significantly. A dental DSO with 40 offices, a home-services franchise with 25 territories, or a senior-living portfolio with 18 communities cannot be effectively reported with 40 individual, bespoke decks, as the production cost would outweigh the retainer. The portfolio rollup consolidates this overhead into a single, standardized format applied across all locations, with an overarching comparative view.
The report has two layers. The "portfolio summary" ranks every location based on the same three metrics: organic-attributed revenue or qualified leads, non-brand growth versus goal, and a technical status flag 2. This allows a client's regional VP to quickly identify top and bottom performers. Below this, each location receives an identical one-page block, structured like the executive scorecard and populated from the same data pipeline. Standardization is key; effective reporting prioritizes metrics linked to strategic goals rather than exhausting every data cut per unit 10, and inconsistent formats across locations hinder comparability.
The efficiency gains are clear when expressed in variables:
| Model | Hours per report | Locations | Total hours |
|---|---|---|---|
| Bespoke per-location deck | H | N | H × N |
| Standardized rollup | H_s (setup, one-time) | N | H_s + (h × N) |
Here, 'h' represents the marginal minutes per location for flag review and a brief narrative, typically a fraction of 'H'. For N = 25 or 40 locations, this delta compounds significantly each month.
The rollup replaces the "parallel deck factory" often run by agencies for portfolio accounts. The account lead signs off on the portfolio summary, and regional leads approve flagged locations before client review. The client receives a single artifact that the VP of operations can act upon across the entire network.
Standardizing on a portfolio of formats without stapling two audiences together
Nine formats do not imply nine reports per client monthly; rather, they represent a menu of options. An agency selects two or three formats that align with a client's decision-making cadence, standardizes the underlying data pipeline, and eliminates the need to rebuild decks from scratch. For instance, a lead-generation account might receive the executive scorecard monthly, a live KPI dashboard, and the technical health scorecard quarterly. A content-heavy SaaS account might opt for the one-page content ROI summary monthly and the quarterly content review. The formats remain consistent, but the specific mix adapts to the buyer's needs.
The production efficiency of this approach strengthens retainer defense. Each format described specifies what it replaces, the responsible stakeholder for sign-off, and the methodology it exposes. This structured artifact is what clients truly value. AI-assisted execution platforms like Vectoron can populate these reports without extensive briefing cycles, allowing account teams to focus their efforts on narrative development and strategic decisions rather than report assembly.
 Market share growth with algorithmic attribution
Market share growth with algorithmic attribution
Frequently Asked Questions
References
- 1.SEO Reporting Guide 2026: KPIs, Dashboards & Reports.
- 2.SEO Reporting Template for Executives: Free XLSX.
- 3.6 SEO Report Examples, Templates & What to Include.
- 4.How to Measure SEO Content ROI Without Guesswork.
- 5.SEO ROI: how to measure real results.
- 6.Multi-Touch Attribution and Media Mix Modeling for Marketing ROI.
- 7.Multi-Touch Attribution Models In Digital Marketing.
- 8.A Comparative Study of Ad Attribution Models: Evaluating the Impact on ....
- 9.Gyanshauryam, International Scientific Refereed Research Journal.
- 10.Constructing KPI-Driven Reporting Systems for High-Growth ....
- 11.32 Marketing Analytics and Attribution Statistics for Data-Driven ....