
Key Takeaways
- Treat map pack rank as a patient-decision signal by measuring it against qualified calls per location, not as a standalone scoreboard metric.
- Stress-test trackers on relevance, distance, and prominence together, since category depth, grid density, and review telemetry each shape whether rank data reflects reality.
- Load four keyword classes per location—branded, core service, symptom-adjacent, and geo-modified near-me—so the tracker captures the high-intent queries that generate emergency calls 1.
- Join rank movement to review ratings, themes, and response cadence on a shared timeline, because a two-star swing meaningfully reorders patient selection 8.
- Model scan volume as L × K × G × S and account for marketer hours per 100 GBPs, since triage labor scales with locations and caps portfolio growth.
- Extend grid geography for high-value procedures like full-arch implants and sedation cases, where reputation signals influence willingness to travel farther 9.
- Route signals through a governance model with named approvers for profile edits, review replies, citations, and content, replacing ad hoc regional edits with a documented workflow.
- Build attribution by sitting timestamped grid rank, qualified call tags, and booked-visit outcomes in one table, with guardrails for algorithm updates and paid media spend.
Why Map Pack Rank Is a Patient-Decision Signal, Not a Vanity Metric
The three-pack on Google Maps is where a prospective patient decides whether a practice is worth a call. For a dental support organization running dozens or hundreds of locations, that pin position is not a scoreboard entry—it is the last surface a patient touches before a booked visit. A systematic review of digital marketing in healthcare found that search visibility and online reputation materially influence patient choice and organizational performance, which places map pack rank inside the acquisition funnel rather than beside it 5.
Dental patients behave the same way. Research on how patients choose dental services shows that most respondents use online search to identify and compare providers, leaning heavily on visibility and reviews before contacting anyone 11. Rank on a grid, then, is a proxy for how often a location gets a fair shot at consideration.
The vanity-metric framing collapses when rank is measured against qualified calls per location. A pin that climbs from position seven to position two on the correct queries either produces more inbound calls or it does not. If the tracker cannot answer that question at the practice level, it is measuring the wrong thing.
Stress-Test Every Tracker Against Relevance, Distance, and Prominence
Relevance: Category Depth, Service Attributes, and Keyword Coverage
Relevance is what the algorithm scores when it matches a query to a Google Business Profile. A tracker that only reports rank for a handful of head terms like "dentist near me" leaves most of the relevance surface unmeasured. The primary GBP category, the secondary categories, service items, and attributes (financing options, languages spoken, accessibility features) all feed how Google interprets a profile against a specific query.
A defensible tracker exposes three things at the profile level:
- Which categories and services are currently published on each GBP, so drift and mismatches show up before they cost rank.
- Keyword coverage broken out by intent class—branded, service ("invisalign," "emergency extraction"), symptom-adjacent ("tooth pain at night"), and geo-modified.
- Per-keyword rank tied to the specific location, not aggregated across a metro.
Peer-reviewed work on healthcare digital marketing frames search visibility and reputation as central levers for patient acquisition, which means relevance data needs to be legible at the practice level, not rolled up into a portfolio average that hides the two locations misfiring on category selection 5.
Distance: Grid Density and Why 5x5 Hides What 13x13 Reveals
Distance in the local algorithm is not a single number—it is a field. Rank changes as the searcher's device moves across a metro, and a geo-grid is the only way to see that field. Grid density is the variable that determines whether a tracker is describing reality or averaging it away.
A 5x5 grid at a 1-mile radius produces 25 sample points. A 13x13 grid at the same radius produces 169. The sparse grid can report a healthy average rank of 4.2 while hiding the fact that a location is invisible on the western quadrant where a competing practice sits two blocks off a major arterial. The dense grid surfaces that pocket. For a DSO comparing acquisition performance across markets, the sparse grid also makes two locations look identical when their real coverage patterns differ by half a mile.
The practical rule: match grid density to the catchment a location actually serves, and keep density consistent across the portfolio so cross-location comparisons remain honest. Trackers that let a marketer set radius, point count, and scan cadence per location—rather than forcing a house default—produce data that survives an executive review. Systematic evidence on healthcare marketing supports this level of resolution, because visibility gaps at the neighborhood level directly shape which practice a patient contacts 5.
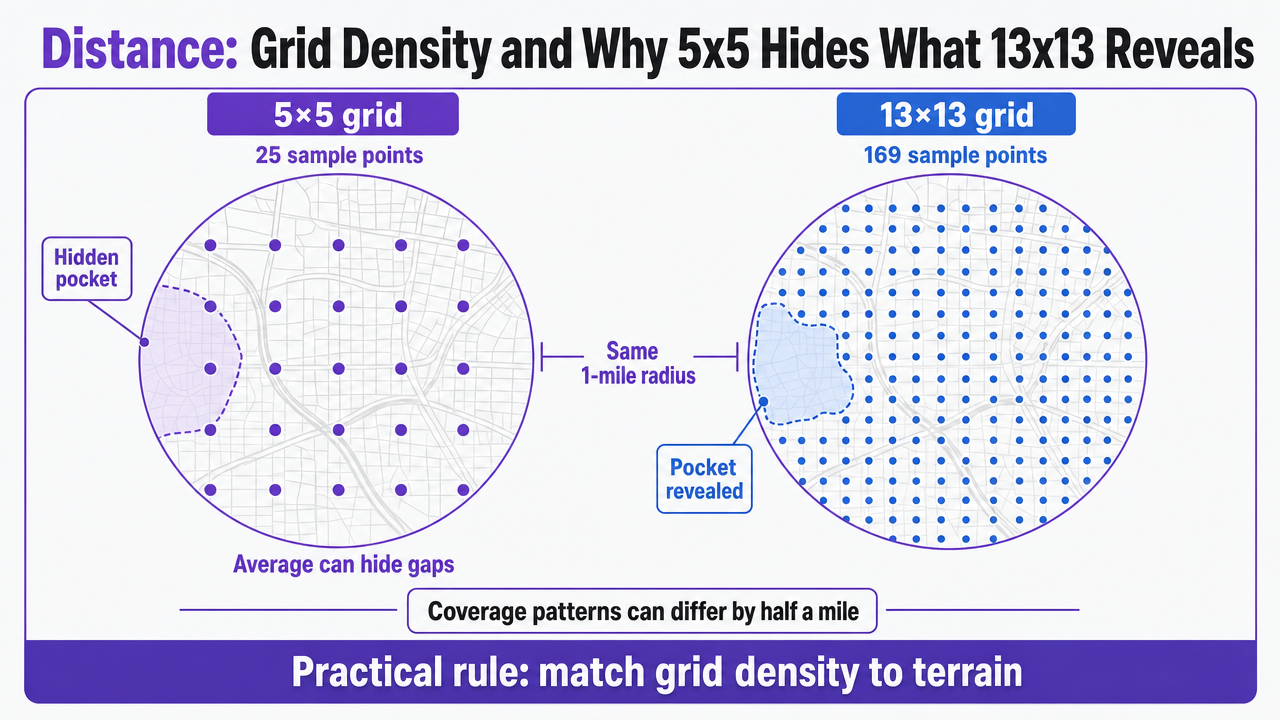 Visualize the section's core comparison between a 5x5 and 13x13 geo-grid, matching the specific point counts cited in the prose (25 vs 169 sample points at 1-mile radius)
Prominence: Review Telemetry, Citations, and Profile Completeness as Tracked Inputs
Prominence is the messiest of the three inputs and the one most trackers reduce to a star average. That reduction discards signal. A dental group evaluating a tracker should ask whether it captures:
- Review volume
- Review recency
- Response cadence
- Response coverage (what percentage of reviews received a reply within a defined window)
- Citation consistency across major aggregators
- Photo counts
- Q&A activity
- Profile completeness scores per location
The reason to track these together is that they behave together. A location with 380 reviews and no reply in six weeks reads differently to a prospective patient than a location with 190 reviews and same-day responses to every one. A systematic review of 63 studies on online patient reviews found that review content clusters around interpersonal behavior, communication, and office processes—signals that a star average erases but a themed review pull surfaces 7. Separate work on dental service selection confirms that patients rely on visibility and reviews together when comparing practices, which means a tracker that isolates rank from review telemetry is measuring half the decision 11.
Prominence data should also be exportable at the practice level with timestamps, so a marketing director can correlate a rank shift with the review event or citation change that preceded it. Anything less makes root cause analysis guesswork.
Which Keywords Belong in the Tracker for a Dental Portfolio
Keyword selection is where most dental portfolios waste tracking budget. Loading a tracker with head terms like "dentist [city]" and calling it complete produces a report that looks clean and predicts almost nothing about inbound calls. The queries that actually move a patient from consideration to phone tap sit in three underweighted classes: symptom-adjacent, near-me, and procedure-specific with a geo modifier.
Search-log research on how people move from self-diagnosis to a local provider makes the case directly. In a study of web sessions containing symptom queries, over 4% escalated into a search for a local healthcare resource, and a behavioral model predicted that transition with 77.7% accuracy using page, session, and user features 1. The scope matters: this is a search-log study of general symptom-to-care transitions, not a dental outcomes study, and the 4% is a session-level rate rather than a per-user conversion. Even with those caveats, the pattern is instructive. Local intent surfaces late, after a patient has already typed "jaw pain when chewing" or "broken molar what to do," and a tracker blind to that vocabulary misses the moment the pin position matters most.
For a dental portfolio, that means four keyword classes belong in the tracker for every location:
- Branded (the practice name and DSO parent)
- Core service ("invisalign," "dental implants," "pediatric dentist")
- Symptom-adjacent ("tooth pain," "chipped tooth," "gums bleeding")
- Geo-modified near-me variants across each
Rank per class should be reported separately, because a location can dominate branded queries while sitting outside the three-pack on the symptom terms that generate emergency calls—two very different operational problems that a blended average would hide.
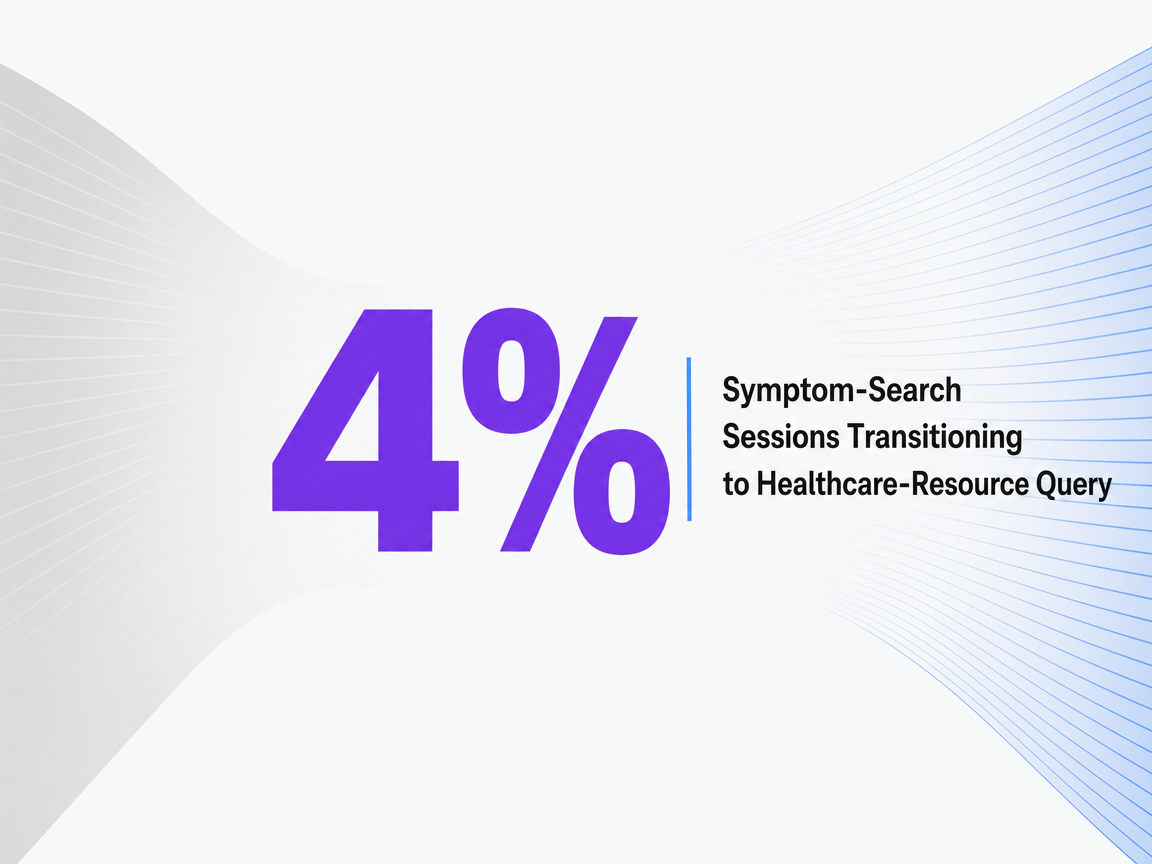 Symptom-Search Sessions Transitioning to Healthcare-Resource Query
Symptom-Search Sessions Transitioning to Healthcare-Resource Query
Test Google Maps rankings in real scenarios
See live, location-based ranking data for your locations before making a commitment.
Joining Rank Data to Review Signals So the Numbers Mean Something
Why Rating Movement Changes Selection Odds
A rank tracker that reports a location's climb from position five to position two, without joining that movement to review data, describes a trend the algorithm caused but cannot explain the response the patient will have. Reviews are what patients actually read once the pin puts a practice in front of them, and the effect on selection is measurable.
A controlled experimental survey published in JMIR tested how much online quality ratings shift provider selection in hypothetical choice scenarios. When government clinical ratings and commercial nonclinical ratings each moved from 2 stars to 4 stars, the relative log odds of a patient choosing that physician increased by 1.31 to 1.32 units 8. The scope note matters: this was a controlled survey using hypothetical primary-care choices, not a live measurement of dental patients booking appointments, and the effect was tested on a bounded set of scenarios. The direction and magnitude still travel. A two-star rating swing on a location's GBP is not a cosmetic change; it reorders how the local competitive set gets picked once the map pack shows up.
For a DSO marketing director, that implies a tracker requirement, not a talking point. Rank movement and review-rating movement need to sit in the same timeline per location so the analyst can see whether a pin gain was reinforced by review gains or whether the practice climbed on distance alone and remains fragile the moment a competitor accumulates fresh reviews. Peer-reviewed work on review volume and rating as predictors of patient choice reinforces the same logic across healthcare more broadly 10.
Tracking Review Themes, Not Just Star Averages
Star averages compress information a patient never reads as a single number. The review text does the persuading. A systematic review of 63 studies on online patient reviews found that review content clusters around interpersonal behavior, communication with the clinician, and interactions with office staff and processes, alongside more clinical mentions 7. Those themes are what a prospective patient scans before dialing.
A useful tracker classifies incoming review text into themes at the location level and reports theme velocity, not just theme presence. A dental practice with a rising volume of reviews mentioning wait times or front-desk friction has an operational signal the marketing team can route to the office manager before the pattern erodes rating trajectory. A location gaining mentions of a specific hygienist or a specific procedure has a positioning signal the content and PPC teams can act on immediately.
The same review synthesis also flags that reviews vary widely in usefulness and are subject to selection effects, so themes should be watched as directional inputs rather than treated as clinical quality proxies 2. What the tracker owes the marketing director is a per-location theme feed with counts, deltas, and links back to the source review, so root cause work takes minutes instead of an afternoon.
Response Cadence and Review Recency as Operational KPIs
Two locations with identical 4.6-star averages can present very differently to a patient reading the profile in the moment. One shows a manager reply on every review from the past 30 days. The other shows the most recent review sitting untouched for weeks and the last owner reply dating to the prior quarter. Recency and response cadence are the operational KPIs a tracker should surface at the practice level.
Three metrics carry the weight:
- Median time-to-first-response per location
- Response coverage as a percentage of reviews receiving a reply within a defined SLA (48 or 72 hours is a defensible bar for a DSO)
- Review recency measured as days since the last new review
Report each per location with portfolio-level distribution, so the tail of underperforming practices is visible without scrolling through every profile.
Systematic evidence on healthcare digital marketing places online reputation management alongside search visibility as a driver of patient acquisition, which puts response SLAs inside the marketing operations remit rather than off to the side as a customer service task 5. A tracker that surfaces cadence gaps is what makes that ownership actionable across hundreds of GBPs.
If You Manage Dozens of Locations: Portfolio Rank-Tracking Economics
The Scan-Volume Equation and Where Costs Actually Sit
The scope shifts here from a single practice to a portfolio. Once a marketing team is responsible for 40, 120, or 300 GBPs, rank-tracking cost stops being a per-seat line item and becomes a function of scan volume. The equation is simple and worth writing down:
L × K × G × S = monthly scans : where L is locations, K is tracked keywords per location, G is grid points per keyword, and S is scan cadence per month.
A 100-location dental group tracking 25 keywords per location on a 13x13 grid scanned weekly produces 100 × 25 × 169 × 4, or roughly 1.69 million grid-point rank pulls per month. Cut the grid to 7x7 and cadence to biweekly and the number drops to about 240,000. Both configurations are defensible for different questions—the first for competitive intelligence in dense metros, the second for portfolio drift monitoring—but they cost meaningfully different amounts and produce meaningfully different signal-to-noise ratios.
The line item most portfolios underestimate is not the scan bill. It is the marketer hours per 100 GBPs required to triage review themes, response SLA gaps, and category drift that the scans surface. That labor sits inside the marketing team's fixed cost and scales with L, not with S 5.
Portfolio Rank-Tracking Economics for a DSO (Comparison Table)
The table below frames the two operating models a DSO marketing director typically chooses between: a standalone rank tracker paired with an in-house analyst, and a unified execution platform where signals, ranked recommendations, and approved actions sit in one workflow. Only variables and ratios are shown—dollar figures depend on vendor, region, and headcount and should be modeled against a specific portfolio.
| Variable | Standalone Tracker + In-House Analyst | Unified Execution Platform with Approval Workflow |
|---|---|---|
| Monthly scan volume formula | L × K × G × S | L × K × G × S |
| Locations covered (L) | Analyst capacity gates L | L scales without added headcount |
| Keywords per location (K) | Typically capped at 15–20 to control review load | 25–40 feasible with automated theme classification |
| Grid density (G) | Often 7x7 for cost control | 13x13 sustainable across portfolio |
| Marketer hours per 100 GBPs / month | High: rank review, review triage, response drafting handled manually | Lower: triage and drafts pre-ranked, human approves before publish |
| Time-to-signal (days from rank shift to routed action) | 7–14 days typical, gated by analyst cycle | 1–3 days, gated by approval SLA |
| Attribution to qualified calls per location | Manual join across tools | Native join with call intelligence |
| Reporting cadence | Monthly rollups | Weekly per-location, monthly executive rollup |
The variable that most reliably separates the two models is marketer hours per 100 GBPs, because it compounds with L. A tracker that produces a clean heatmap but leaves review triage and response drafting to a human analyst caps portfolio growth at the analyst's throughput. Systematic evidence on healthcare digital marketing places reputation management and search visibility as coupled drivers of patient acquisition, which means the labor of joining them is not optional—it either lives inside the tool or it lives on a payroll line 5.
Cross-Region Consideration for High-Value Procedures
Most DSO locations serve a neighborhood catchment, and grid density set to that catchment is the right instrument. High-value procedures behave differently. Full-arch implants, sedation cases, and complex orthodontic work pull patients across longer distances, which means the tracked geography for those keyword classes should extend beyond a single practice's immediate radius.
Recent work on internet hospitals in China found that hospital ratings (B = 0.406), review quantity (B = 0.089), and review polarity (B = 0.634) each significantly and positively influenced cross-regional healthcare choices 9. The study is China-based and platform-mediated in ways that do not map cleanly onto US dental care, so the coefficients themselves should not be imported. The directional point that online reputation signals shape willingness to travel is what generalizes, and it argues for tracking procedure-specific rank at a metro or multi-metro grid, not just a neighborhood one.
A Governance Model for Hundreds of GBPs Without a Local SEO per Market
Governance is where multi-location marketing teams either scale or stall. A tracker that surfaces 400 rank movements, 1,200 new reviews, and 60 category drift alerts each week produces nothing unless a documented decision path routes each signal to a named owner with an approval SLA. The failure mode is predictable: signals pile up, a regional manager makes an ad hoc GBP edit, and the marketing director learns about it after a rating dip.
A workable model separates four decision types and assigns each an approver:
- Profile edits (category changes, service edits, hours, attributes) sit with the central marketing team, because a category change on one location resets relevance calculations Google has to relearn.
- Review responses sit with a trained response pool working from templates the marketing team owns, with escalation to the practice for clinical specifics.
- Citation and NAP corrections sit with an ops analyst on a monthly cycle.
- Content and photo uploads sit with the central team on a quarterly cadence per location.
What ties the model together is an approval workflow the tracker feeds into, not a spreadsheet a coordinator maintains. Systematic evidence on healthcare digital marketing places reputation management and search visibility as coupled patient-acquisition drivers, which means the governance layer is the mechanism that keeps both moving at portfolio scale without hiring a local SEO in every market 5.
See Real-Time Google Maps Rankings Across All Locations—No Manual Tracking Required
Request a walkthrough of automated, location-level rank tracking designed for multi-location brands. Get actionable, exportable data to benchmark, report, and optimize local search performance at scale.
Attribution: Tying Grid Movement to Qualified Calls and Booked Visits
Attribution is where a rank tracker either earns its place in the marketing stack or gets described as "nice to have" the next time the CFO reviews vendor spend. The join a DSO marketing director needs is straightforward to describe and operationally demanding to build: grid-point rank per keyword per location, timestamped, sitting in the same table as call intelligence tags and booked-visit outcomes from the practice management system.
Three attribution primitives carry most of the analytical weight:
- Qualified calls per location per week, filtered by call intelligence to exclude spam, existing-patient calls, and non-appointment inquiries.
- Booked-visit conversion rate from qualified call, pulled from the PMS.
- The rank state at the time of the call—not the monthly average, but the grid-point position on the query class that plausibly drove the session.
Without the third primitive, correlation between rank and call volume collapses into monthly noise.
Two guardrails keep the analysis honest. Rank shifts should be evaluated against a rolling baseline per location, because a metro-wide algorithm update moves every pin at once and looks like a win or loss that no marketing action caused. And call volume should be normalized against seasonality and paid media spend for that market, because a PPC push in the same week will inflate the apparent rank effect. Peer-reviewed evidence on healthcare digital marketing treats search visibility and reputation as coupled acquisition drivers, which is the reason the join has to include review telemetry alongside rank and calls rather than sitting in a separate report 5.
Buying Criteria and a Closing Note on Execution
Six criteria separate a defensible Google Maps rank tracker from a dashboard that decorates a monthly deck:
- Per-location grid density the marketer controls
- Keyword classes segmented by intent
- Review telemetry joined to rank on a shared timeline
- Response cadence and recency reported against a portfolio SLA
- A governance workflow with named approvers for GBP edits and review replies
- Native attribution from grid movement to qualified calls per location 5
A tracker that satisfies five of the six will still leak signal at the sixth. The one worth buying handles all six inside a single approval-first workflow, which is the model Vectoron was built around.
 Accuracy of Model Predicting Transition to Healthcare Search
Accuracy of Model Predicting Transition to Healthcare Search
Frequently Asked Questions
References
- 1.Web to World: Predicting Transitions from Self-Diagnosis to the Pursuit of Local Medical Assistance in Web Search.
- 2.What Do Patients Say About Doctors Online? A Systematic Review of Studies on Patient Online Reviews.
- 3.How Online Quality Ratings Influence Patients' Choice of Medical Providers: Controlled Experimental Survey Study.
- 4.Patient Mobility in the Digital Era: How Online Service Information from Internet Hospitals Shapes Patients’ Cross-Regional Healthcare Choices.
- 5.Digital Marketing Strategies for Healthcare Organizations: A Systematic Review.
- 6.How Online Quality Ratings Influence Patients' Choice of Medical Providers: Controlled Experimental Survey Study (PMC version).
- 7.What Do Patients Say About Doctors Online? A Systematic Review of Studies on Patient Online Reviews.
- 8.How Online Quality Ratings Influence Patients' Choice of Medical Providers: Controlled Experimental Survey Study - PubMed record.
- 9.Patient Mobility in the Digital Era: How Online Service Information from Internet Hospitals Shapes Patients’ Cross-Regional Healthcare Choices.
- 10.Online Reviews and Patient Choice in Healthcare.
- 11.The Role of Online Search in Choosing Dental Services.