
Key Takeaways
- Marketing-sourced pipeline averaging 42% and a $66 CPL gap between blog and gated whitepaper leads reframe content as a portfolio design problem, not a volume target 9.
- Engagement depth predicts conversion far more reliably than publishing cadence, with webinar engagement scoring as the strongest lead-generation predictor (β=2.127; p<0.001) 1.
- Educational and expert formats lift lead quality by 34% to 47% while lowering CAC, and digital assets outperform in-person events as pipeline instruments 2, 3.
- A 46% brand / 54% activation budget split marks peak efficiency in B2B, and programs skewed toward activation stall once the in-market pool is worked 12.
- Coordination overhead — not writing — caps manager capacity, so approval-first workflows with human sign-off on every asset protect senior hours while holding quality 14, 17.
The Pipeline Math That Reframes the Program
Most content programs are still defended with traffic charts. The programs that survive budget cuts are defended with pipeline math. Across B2B tech benchmarks, marketing-sourced pipeline contribution averages 42%, and content marketing carries a blended cost per lead of $92, with blog leads at $68 and gated whitepaper leads at $134 9. Those three numbers change the conversation a content marketing manager can have with a CFO.
The 42% figure is the anchor. It reframes content from a brand expense into a revenue input that sits next to sales development and paid media in the pipeline mix. A program producing fewer than a third of qualified opportunities is under-indexed against the benchmark. One producing closer to half is a candidate for reinvestment, not cuts.
The CPL spread does harder work. A $66 gap between ungated blog leads and gated whitepaper leads is not an argument for one format over the other. It is an argument for portfolio design. Blog leads are cheap and shallow; whitepaper leads are expensive and pre-qualified. The manager's job is to decide, per demand type and per deal size, which mix pushes marketing-sourced pipeline past 42% at an acceptable blended CAC.
The rest of this guide to content marketing treats content marketing as an operating system built on those three inputs: pipeline contribution as the outcome, CPL as the efficiency constraint, and format mix as the primary lever. Volume is a byproduct, not the goal.
Format-to-Funnel Fit as the Real Lever
Why Engagement Quality Beats Publishing Cadence
Publishing more assets rarely fixes a program that is missing pipeline. The EMAC analysis of 1,478 customer companies found that the average engagement score with webinar content was the strongest and most significant predictor of prospects converting to leads (β=2.127; p<0.001) 1. That effect size dwarfs the marginal impact of adding another post to the calendar. It also names the variable a content marketing manager should optimize for: depth of interaction, not surface count.
The same study reports something inconvenient for volume-first plans. Not every dimension of engagement moves conversion. Form-related and modality-related engagement did not consistently predict short-term lead generation, which means clicks, opens, and session counts are noisy proxies for what actually pushes prospects into the funnel 1. The signal sits in sustained attention to substantive content, not in aggregated micro-interactions.
The buyer-side research reaches the same conclusion from a different angle. When perceived benefit of the information exchange is high — credible sources, buyer-focused framing, emotional resonance — engagement behaviors and disclosure rise, and lead generation follows 16. Firm-centric content underperforms even when it ships on schedule.
The operating implication is direct. A calendar that produces twelve mediocre posts a month will lose to one that produces six posts engineered to earn measurable dwell time and completion. Program owners defending output targets should reframe the KPI around engagement depth per asset and conversion per engaged reader, then let cadence follow from what can be built at that standard.
Educational and Expert Formats Move Lead Quality
Format selection determines whether a program produces cheap volume or qualified opportunities. A 2023–2024 analysis of B2B tech social-media programs found that integrating educational and expert content lifted lead quality by 34% to 47% while simultaneously reducing customer acquisition cost, improving return on marketing investment across the funnel 2. That range is wide because outcomes depend on how tightly the content maps to the buyer's actual decision criteria, but the direction is consistent: expertise pays.
Two format categories drive the lift:
- Educational assets — technical explainers, comparative frameworks, implementation guides — pull in buyers researching a decision rather than browsing a category.
- Expert content — practitioner-authored analysis, benchmarks, and structured teardowns of common failure modes — signals credibility and shifts the reader's evaluation of the source.
Both formats replace promotional posture with usable information, which is the value exchange buyers reward with engagement and, later, disclosure 16.
The economic consequence deserves attention from anyone defending a content budget. A 34%–47% lift in lead quality tightens the CAC calculation on two sides. Sales spends less time disqualifying, and marketing pays less per qualified conversation because the funnel wastes fewer clicks 2. Programs that publish generic thought pieces or product-heavy posts inherit the opposite dynamic.
Practical selection follows from the demand type the program serves. Forrester's demand-type framework treats content themes and formats as variables that must shift with whether the category is new-paradigm, established, or reformed 15. An educational explainer that lands in an established category may need to become an expert benchmark in a new-paradigm category to earn the same lift. The lift range in the research is not a promise; it is a payoff schedule for programs willing to specialize.
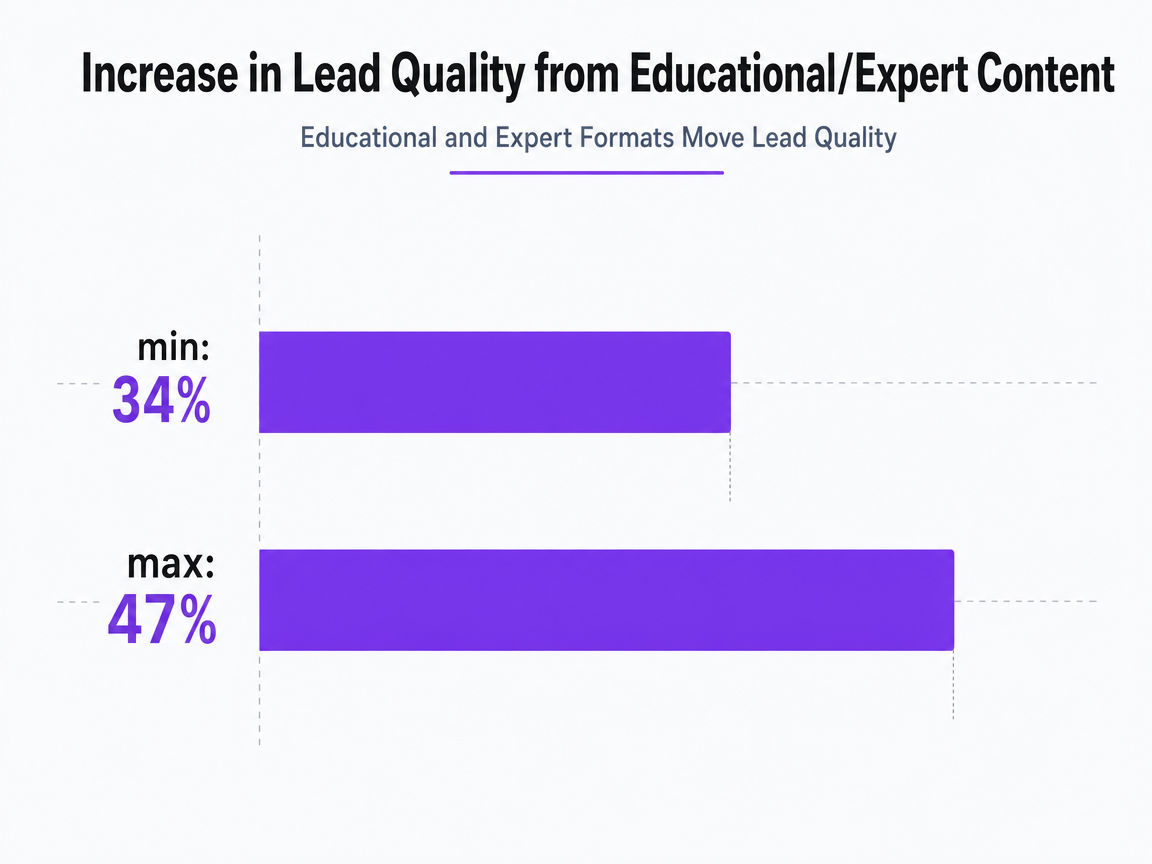 Increase in Lead Quality from Educational/Expert Content
Shows the range of improvement in B2B lead quality when integrating educational and expert content into social media strategies.
Digital Formats vs. Events in a Nonlinear Journey
The format debate that still consumes marketing meetings — events versus digital content — has an empirical answer. Kellogg's research on B2B content marketing found that digital offerings such as webinars, white papers, and branded blogs generated more leads and more sales than in-person events like conferences and workshops 3. Events still serve relationship and account expansion roles, but as pipeline-creation instruments they underperform the digital formats most programs already own.
The reason sits in how buyers actually move. B2B journeys are not linear queues from awareness to purchase. Content Marketing Institute's mapping of nonlinear journeys describes buyers cycling through discover, explore, buy, ask, use, and engage stages, taking actions like research, compare, peer-review, and share in orders that rarely match a marketer's funnel diagram 13. Digital assets are available at every re-entry point. A conference is available once.
For the program owner, this reshapes the content mix. Webinars and on-demand recordings capture both the scheduled attendee and the buyer who arrives three weeks later looking for a specific answer. White papers and expert analyses persist as reference material that circulates inside buying committees the vendor never meets. Branded blogs carry organic search weight that keeps working during the quiet months between campaigns.
Reallocating even a portion of event budget toward on-demand digital versions of the same expertise — recorded sessions, transcribed panels, distilled frameworks — typically raises the number of qualified conversations without adding headcount. The event still happens. The pipeline contribution stops depending on who was in the room that day.
Brand and Activation: A Budget Discipline, Not a Debate
The perennial argument over whether content dollars should build brand or drive activation has an empirical resolution most program owners have not yet operationalized. Synthesis of IPA effectiveness data across B2B campaigns points to peak efficiency at roughly a 46% brand / 54% activation split, with material drop-offs on either side of that band 12. That ratio is a planning heuristic, not a law, but it gives a content marketing manager something more useful than instinct when defending upstream investment in a quarterly review.
What the split actually means for a content calendar is concrete. Brand-side spend funds the assets that create mental availability before a buyer has a project — practitioner-authored analysis, category-defining frameworks, executive commentary, and the recurring thought leadership programs that shape preference well before any form fill. Activation-side spend funds the assets that convert an active evaluator — comparison pages, implementation guides, ROI calculators, gated benchmarks, and the paid distribution that gets those assets in front of in-market accounts. Programs skewed heavily toward activation tend to hit near-term CPL targets and then stall, because the pool of already-in-market buyers is finite and shrinks as competitors work the same list.
The IPA-derived split lines up with adjacent evidence on why brand-weighted content pays back. Campaigns engineered to build trust and earn coverage outperform on sales, profit, loyalty, and brand strength over multi-year windows, particularly in B2B where deal cycles outrun any single quarter's attribution report 11. The five principles that frame that body of work — invest in share of voice, balance brand and activation, expand the customer base, maximize mental availability, harness emotion — treat brand content as a compounding asset rather than a soft expense 10.
For the manager holding the calendar, the practical move is to audit the current split by dollar, not by asset count. A program that publishes ten activation pieces for every brand piece is almost certainly under-invested upstream regardless of what the mix looks like on paper. Rebalancing toward the 46/54 band, then holding it through a full planning cycle, is the discipline that keeps pipeline contribution from decaying once the easiest activation gains have been harvested.
Accelerate content output with full platform access
Test real-world publishing workflows and measure impact on your pipeline before committing to a subscription.
Thought Leadership and the Hidden Buyer Problem
The 2025 Edelman-LinkedIn analysis reframes what thought leadership is actually paid to do. It shapes preference among buyers the vendor cannot see — committee members reading anonymously, procurement leads building shortlists in private, executives forming an opinion months before a project is chartered 7. Traditional marketing materials underperform against this audience because they assume the buyer has raised a hand. Thought leadership assumes the opposite.
That upstream influence is what makes attribution reports understate the format's contribution. The 2024 edition of the same research quantifies the downstream effect: strong thought leadership makes buyers more willing to seek out a provider and pay a premium for that provider's expertise, which shows up later as inbound RFPs and shortlist inclusion rather than as a tracked click 6. A program owner who only measures form fills will consistently under-credit the assets doing the most preference-setting work.
The catch is quality. A significant share of buyers in the 2024 study rate most thought leadership as mediocre or worse, which means the category is oversupplied at the low end and undersupplied at the top 6. Practitioner-authored analysis, original data, and specific point-of-view pieces earn the effect. Recycled trend commentary does not. The operational move for the manager is to publish fewer thought leadership pieces per quarter and route each one through a named expert who can defend the argument in a customer conversation.
Distribution Choices When Half of Programmatic Spend Misses
Distribution decides whether the content ever meets the buyer. The ANA's 2024 programmatic benchmark reports a 7.9% year-over-year improvement in ad spend efficiency, and yet more than half of programmatic spend still fails to reach the intended audience before it is lost to fees, made-for-advertising sites, and low-quality inventory 8. For a content marketing manager routing budget through open-web display to promote a whitepaper or webinar, that number sets the ceiling on what paid distribution can realistically contribute.
The implication is not to abandon paid channels. It is to weight distribution toward placements where the buyer's attention is already concentrated and measurable. Owned search real estate, curated newsletter sponsorships, professional social feeds, and syndication into publications the target buying committee already reads consistently outperform blind programmatic buys for content assets built around expertise and educational depth 2. These placements survive the waste rate because they are transacted against verified audiences, not impression pools.
The corollary is that owned distribution — search-driven organic traffic, email lists, and the recurring readers of a branded publication — carries a structural advantage that compounds while paid channels leak. Programs treating owned distribution as the primary channel and paid as an amplifier route around the efficiency problem rather than paying to solve it repeatedly.
Production Economics: Where Manager Capacity Actually Goes
Briefing, Revision, and Vendor Coordination as Hidden Load
The capacity constraint on most content programs is not writing. It is the meta-work around writing. A single mid-funnel asset typically absorbs a briefing document, a subject-matter expert interview, two or three revision passes, an SEO review, a legal or compliance check in regulated categories, and a publishing handoff. The writer touches the file for a fraction of the elapsed time. The manager touches it repeatedly, and every touch is a context switch that erodes the strategic hours the role was built for.
Forrester's guidance on growth-focused content engines lands directly on this point: engines that produce pipeline are engineered around opportunity creation and expansion, not lead volume, which means the operating design has to protect senior capacity for planning, positioning, and expert access rather than routing it into coordination 17. Programs that treat every asset as a bespoke project pay the coordination tax on every unit shipped.
Forrester's parallel research on content engagement solutions frames the response category. B2B marketing decision-makers now prioritize investment in content engagement tooling specifically to support content experience, increase conversions, and contribute to pipeline and closed business 14. The tooling matters because it removes the recurring coordination cost, not because it writes faster. Capacity returns to the manager when the workflow stops requiring them.
Measurement Windows That Match Inbound Reality
Attribution windows set to a single quarter systematically undercount content's contribution. The longitudinal analysis of inbound marketing in B2B funnels was designed to test whether content, anchored in a digital content marketing strategy, influenced the stage change from qualified lead to sales opportunity over time — and confirmed that the effect materializes across extended windows rather than inside a reporting month 4. Programs measured against 30-day conversion will report failure on assets that are actively moving deals two quarters out.
The nonlinear journey research reinforces the measurement mismatch. Buyers cycle through discover, explore, buy, ask, use, and engage stages in orders that ignore any linear funnel, re-entering months after the first touch 13. An attribution model that closes the window at 90 days treats those re-entries as new leads and credits them to whatever channel touched last.
The operational fix is a dual measurement frame:
- Short-window metrics — CPL by format, form-fill conversion, MQL rate — govern activation-side optimization.
- Longer-window metrics — influenced pipeline over six to twelve months, shortlist inclusion rate, inbound RFP volume — govern brand-side investment.
Reporting both prevents the manager from cutting the assets that produce the largest downstream effect because they underperform on the wrong clock.
Streamline Content Marketing to Accelerate Pipeline Impact
Connect with experts to see how leading brands are leveraging AI-powered execution to increase content velocity, reduce overhead, and maintain rigorous quality standards across all channels.
If You Manage Multiple Locations: Portfolio Content Economics
The audience shifts here. Program owners running a single brand can skim; the section speaks to content managers responsible for a portfolio — a DSO with 40 practices, a multi-state law firm network, a home services franchise, a senior living group, a behavioral health operator with regional brands. The unit economics of content change once locations enter the calculation, because every asset has to earn its keep across a variable number of sites without turning the calendar into hundreds of bespoke projects.
The two benchmarks that anchor single-brand programs still apply, but they compound. Blog leads at $68 versus gated whitepaper leads at $134 9 scale linearly with location count if content is duplicated per site, and the 34%–47% lead-quality lift from educational and expert formats 2 only materializes when the local asset carries the same substance as the corporate one. The trap is publishing shallow location pages that inherit neither the CPL advantage of a real blog nor the quality lift of a real explainer.
Three operating models dominate portfolio content. Each has a different marginal cost curve as locations grow:
| Model | Per-location marginal cost | Quality consistency | Local relevance |
|---|---|---|---|
| Shared corporate editorial team | Low; fixed team cost spread across N locations | High | Weak without local input |
| Per-location agency retainer | Linear at retainer R × N locations | Variable by agency | Strong but uncoordinated |
| Approval-first AI-assisted workflow with central governance | Sub-linear; central review scales faster than production | High if governance holds | Strong if local signals feed the workflow |
The portfolio manager's decision is not which model is cheapest at one location. It is which model holds the $68 CPL and the 34%–47% quality lift across all of them without the central team becoming the bottleneck that starves half the sites of publishing capacity.
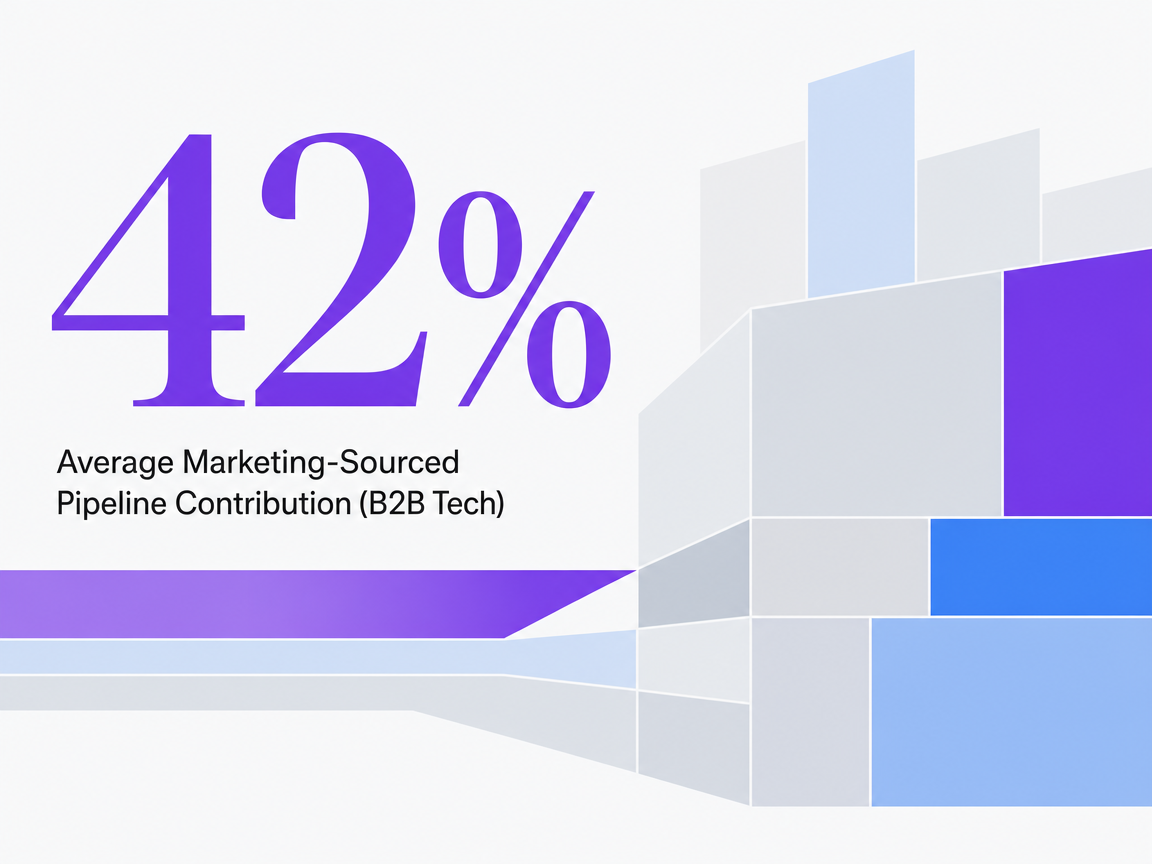 Average Marketing-Sourced Pipeline Contribution (B2B Tech)
Average Marketing-Sourced Pipeline Contribution (B2B Tech)
Choosing an Operating Model: In-House Scale, Agency, or Approval-First AI
The operating model decision is where the pipeline math, format economics, and production load meet the org chart. Three options remain on the table for most program owners, and each fails in a predictable way when pushed past its capacity.
An in-house scale model keeps voice and expertise inside the building, but every unit of additional output requires either a new hire or overtime from the manager. It holds quality until headcount growth stalls, then output collapses. An agency retainer model buys capacity without hiring, but reintroduces the briefing and revision overhead the program was already paying internally, and quality drifts with account team turnover. Both models treat content as a series of bespoke projects, which is the design flaw Forrester names when it argues that growth-focused content engines are engineered around opportunity creation and expansion rather than lead volume 17.
The third option is an approval-first workflow where AI handles signal reading, drafting, and execution while the manager retains sign-off on every asset. It matches the direction Forrester identifies in the content engagement solutions category, where B2B decision-makers now prioritize tooling that supports content experience, increases conversions, and contributes to pipeline and closed business 14. The model works only when governance holds — when nothing ships without human review and every recommendation carries its reasoning. Platforms like Vectoron are built around that constraint, which is what separates approval-first execution from unattended automation.
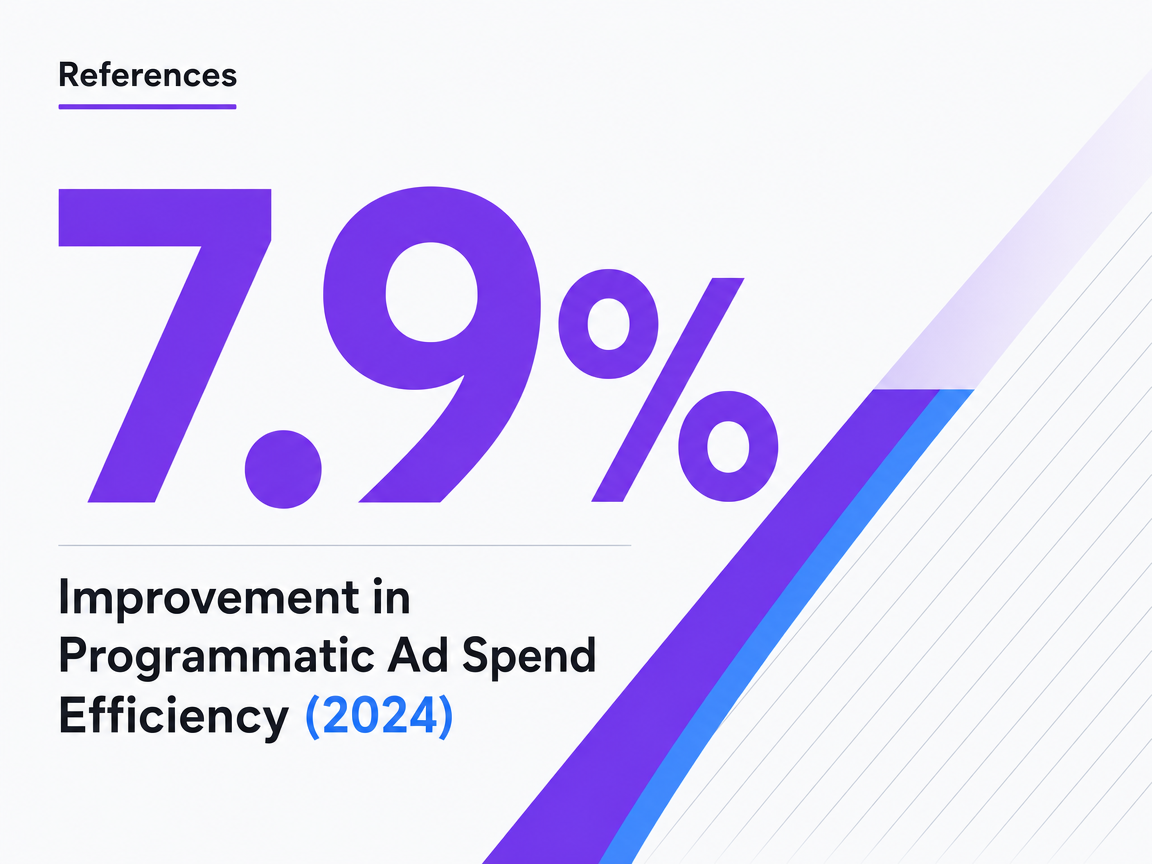 Improvement in Programmatic Ad Spend Efficiency (2024)
Improvement in Programmatic Ad Spend Efficiency (2024)
Frequently Asked Questions
References
- 1.Does engaging content marketing help generate more B2B leads?.
- 2.Social Media Marketing Communications of B2B Technology Companies: Content Strategies, Lead Generation Funnel, and CPL/CAC/ROMI Performance Evaluation.
- 3.How Businesses Can Best Use Content Marketing to Generate Leads.
- 4.The impact of Inbound Marketing on converting leads into sales opportunities in a B2B funnel over time.
- 5.An Annual Report on B2B Thought Leadership by Edelman Business Marketing and LinkedIn (Global 2020 Study).
- 6.2024 B2B Thought Leadership Impact Report.
- 7.2025 B2B Thought Leadership Impact Report: Invisible Influence.
- 8.ANA's 2024 programmatic benchmark study: progress but challenges remain.
- 9.B2B Marketing ROI Benchmarks: 2024 KPIs.
- 10.Five Principles of Growth in B2B Marketing.
- 11.Earned Effect Study.
- 12.Empirical observations on the effectiveness of B2B marketing (LinkedIn Business report based on IPA data).
- 13.How To Plan a Fresh Content Mix for Nonlinear Buyer Journeys.
- 14.One Destination, Many Paths: The Content Engagement Solutions Landscape.
- 15.How To Identify B2B Demand Types.
- 16.CONTENT MARKETING AND PERCEIVED BENEFITS OF INFORMATION EXCHANGE ON B2B LEAD GENERATION: THE ROLE OF CUSTOMER ENGAGEMENT.
- 17.Building a B2B Content Engine That Drives Growth.