
Key Takeaways
- Ranking is a funnel input, not a client outcome — position governs visibility, while clicks, qualified visits, and booked revenue each fail for their own reasons and need separate diagnosis.
- Average position hides the click distribution that drives revenue; report click share by tier because position one alone captured 51.3% of Google clicks in observed 2023 data 1.
- Portfolio economics compound: a 10.07% per-position CTR lift 8applied across a book of accounts turns individual ranking moves into quantifiable revenue models using client-supplied close rate and AOV.
- Rebuild the client dashboard around four rows — tiered click share, engine-segmented impressions, separately labeled organic and paid conversions 6, and quality-adjusted revenue with a substantiation file 4.
Rank Is a Funnel Input, Not a Client Outcome
The question how does my website rank arrives in agency inboxes several times a week, usually from clients who have already seen the number and want an interpretation. Position 3 for a commercial term reads well on a monthly report. It rarely settles the follow-up: why calls, form fills, and booked revenue did not move in the same direction.
That gap is not a measurement failure. It reflects what ranking actually is. Position data marks where a page is eligible to be seen inside the ten-blue-link stack, adjusted for whatever SERP features Google chose to render for that query on that day. It does not describe click share, session quality, lead disposition, or close rate. A peer-reviewed 2023 analysis of observed Google and Bing clicks found that 97.11% of Google clicks landed on the first page, with position one alone capturing 51.3% of clicks across the study's sample 1. The distribution is steep enough that a two-position shift changes the economics of a keyword more than most on-page changes ever will — and yet position, by itself, still explains only the visibility step.
For agency SEO leads defending retainers across a portfolio, that distinction matters commercially. Reporting ranking as the outcome collapses the funnel into a single number and hands clients the wrong debate. Reporting ranking as a funnel input — visibility feeding clicks, clicks feeding qualified visits, qualified visits feeding pipeline — reframes the conversation around where revenue is actually gained or lost. The rest of this piece works through that funnel and the reporting decisions each stage forces.
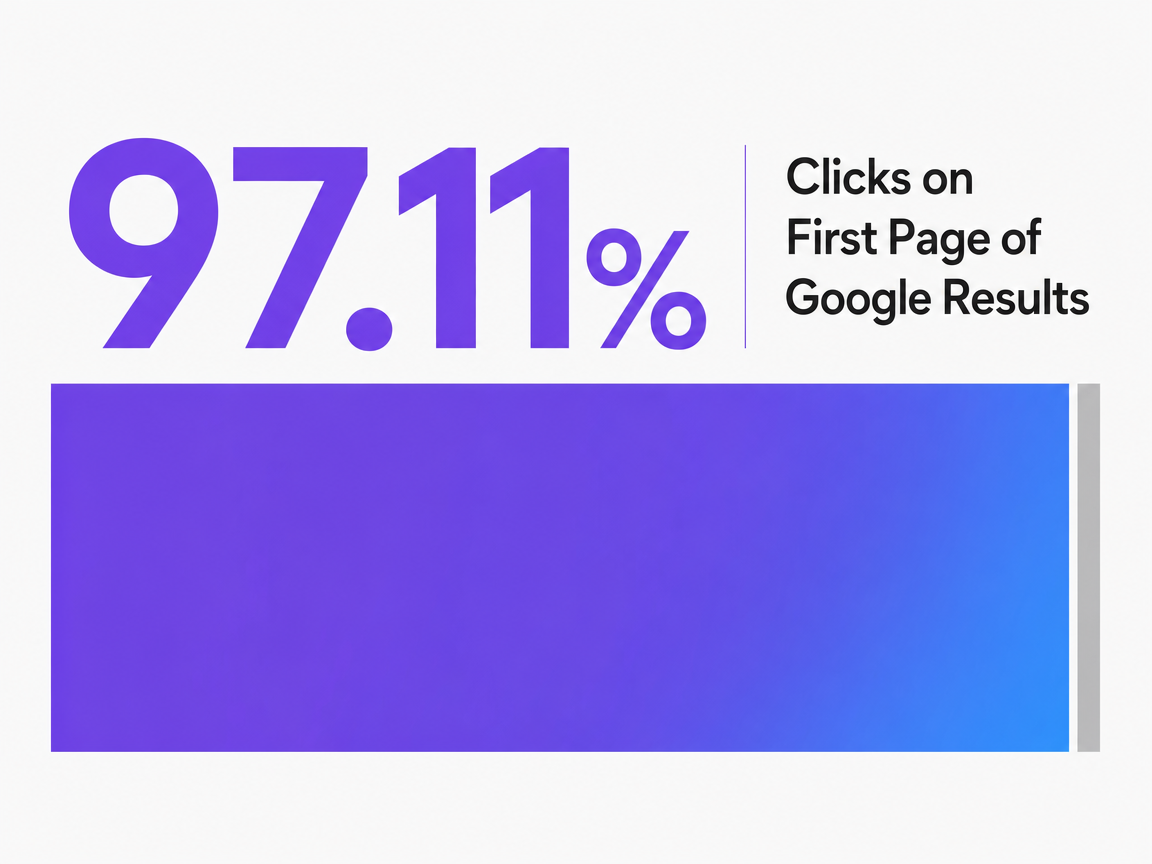 Clicks on First Page of Google Results
Clicks on First Page of Google Results
The Position-to-Revenue Funnel: Where Ranking Data Actually Lives
Eligibility, Visibility, Clicks, Qualified Visits, Booked Revenue
Rank is one variable inside a five-stage chain, and each stage has its own failure mode.
- Eligibility is the first: a URL has to be crawlable and indexed before a position exists at all.
- Visibility follows — the indexed page has to be ranked for the query and rendered inside whatever SERP layout Google chose that day, whether that includes AI overviews, local packs, product carousels, or a plain ten-blue-link stack.
- Clicks come next, governed heavily by position within that layout.
- Then qualified visits, filtered by intent match, page experience, and offer relevance.
- Booked revenue sits at the far end, gated by lead disposition, sales follow-up, and close rate.
The click stage is where most of the funnel drops, and the drop is not subtle. In a peer-reviewed 2023 analysis of observed Google and Bing user behavior, 97.11% of Google clicks landed on first-page results 1. Everything ranked on page two or beyond competed for the remaining 2.89% of click volume in that sample. That single figure reframes the funnel diagram: eligibility and visibility on page two are essentially eligibility to receive almost no clicks, regardless of how clean the technical SEO looks in an audit.
For agency SEO leads, the operational consequence is that each stage needs its own metric, its own owner on the account team, and its own remediation playbook. A ranking gain that stalls at the click stage points to a title, meta, or SERP-feature problem. Clicks that stall at qualified visits point to intent mismatch or landing-page friction. Qualified visits that stall at booked revenue point to sales operations, not SEO. Reporting that collapses all five stages into average position gives the account team no way to diagnose which stage is actually leaking, and no way to defend the retainer when a client asks.
Why Average Position Misreports What Clients Are Buying
Average position is a weighted mean across every impression a property received in a reporting window, which means it flattens the distribution that actually drives revenue. A site ranking position 1 for a low-volume brand term and position 14 for a high-volume commercial term can post an average position of 7.5 — a number that looks like steady mid-page performance and describes neither keyword accurately. The client sees a rounded figure. The account team sees a metric that hides both the win and the loss.
The distribution problem compounds when SERP features enter the picture. A page holding organic position 3 underneath an AI summary, a local pack, and four ads is not the same asset as a page holding organic position 3 on a clean ten-link SERP. Google Search Console will report the same position for both, but the visible pixel real estate, and therefore the click share, differs by an order of magnitude. Average position treats those situations as identical.
Reporting that shows click share by position tier — page one versus page two, top three versus positions four through ten — restores the information average position throws away. It also aligns the metric with the commercial reality the client is buying: not a number on a scale of one to one hundred, but a share of the clicks available for a query. That reframing is what lets an account team explain, without hedging, why a two-position gain on a commercial term matters more than a five-position gain on a term the client asked about but no one searches for commercially.
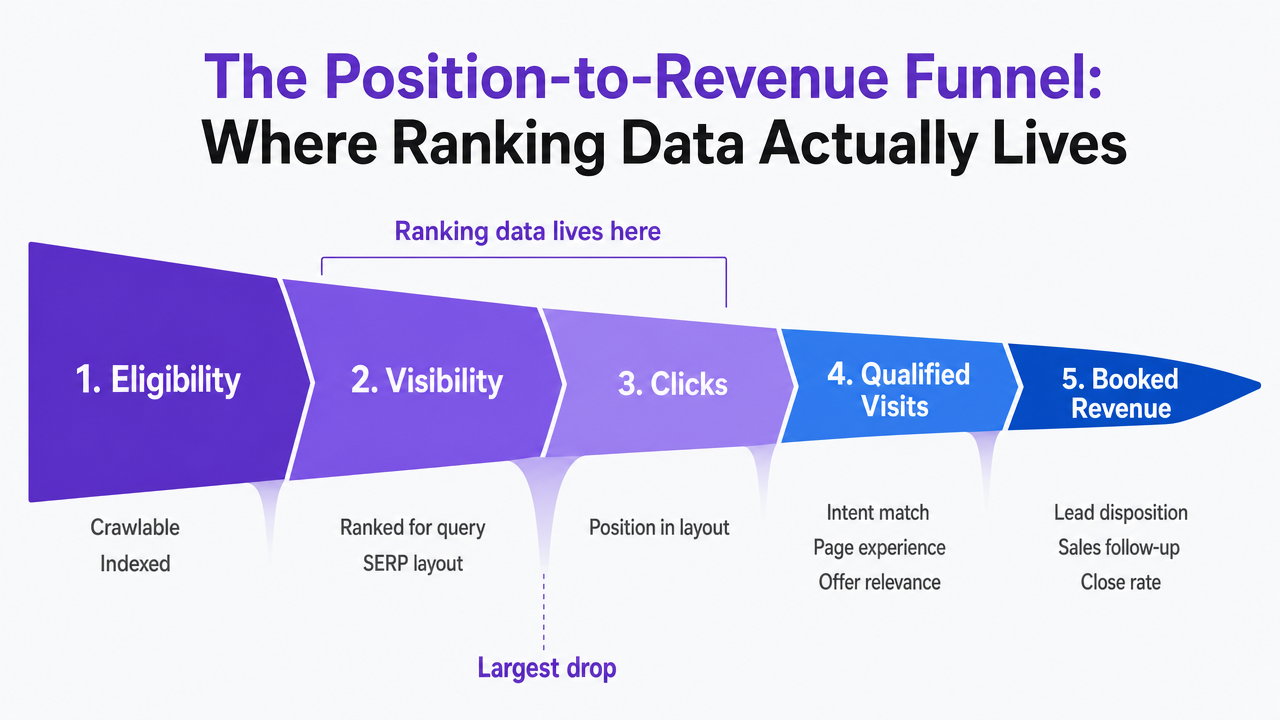 Visualize the five-stage funnel described in this section so readers see where ranking sits relative to revenue and where each stage can leak
Position-Tier Click Economics: The Distribution Beats the Average
What the Click Distribution Actually Looks Like on Google
The shape of the click curve on Google organic is the single most important number in any ranking-to-revenue argument, and it is not a shape most client dashboards actually draw. A peer-reviewed 2023 comparative analysis of observed Google and Bing user behavior found that position one on Google captured 51.3% of clicks in the study's sample, positions two through five captured another 34.7% (bringing the top five to more than 86% combined), and page one as a whole absorbed 97.11% of clicks — leaving 2.89% for every result on page two and beyond 1. The scope matters: the figures come from observed clickstream data across the study's participants, engines, and measurement window in 2023, not from vendor CTR curves or extrapolated impression models.
Read as a distribution rather than an average, the curve produces conclusions average position cannot. Moving a commercial term from position five to position three roughly doubles addressable click share inside the top-five band. Moving that same term from position three to position one triples it again, because position one alone commands more clicks than positions two through five combined in the study's sample. The gains are not linear, and no monthly report built on average position moved from 5.2 to 3.4 communicates that geometry to a client.
The distribution also reframes what page-two rankings mean commercially. A keyword sitting at position 12 is not almost on page one in any economically meaningful sense — it is competing for a fraction of the 2.89% of clicks the study's users allocated to page two and beyond. Agency SEO leads presenting a portfolio should show click share by tier — position 1, positions 2–5, positions 6–10, page 2+ — and let clients see where their keywords actually sit on the curve. The tier view converts a metric clients often misread into a distribution they can price.
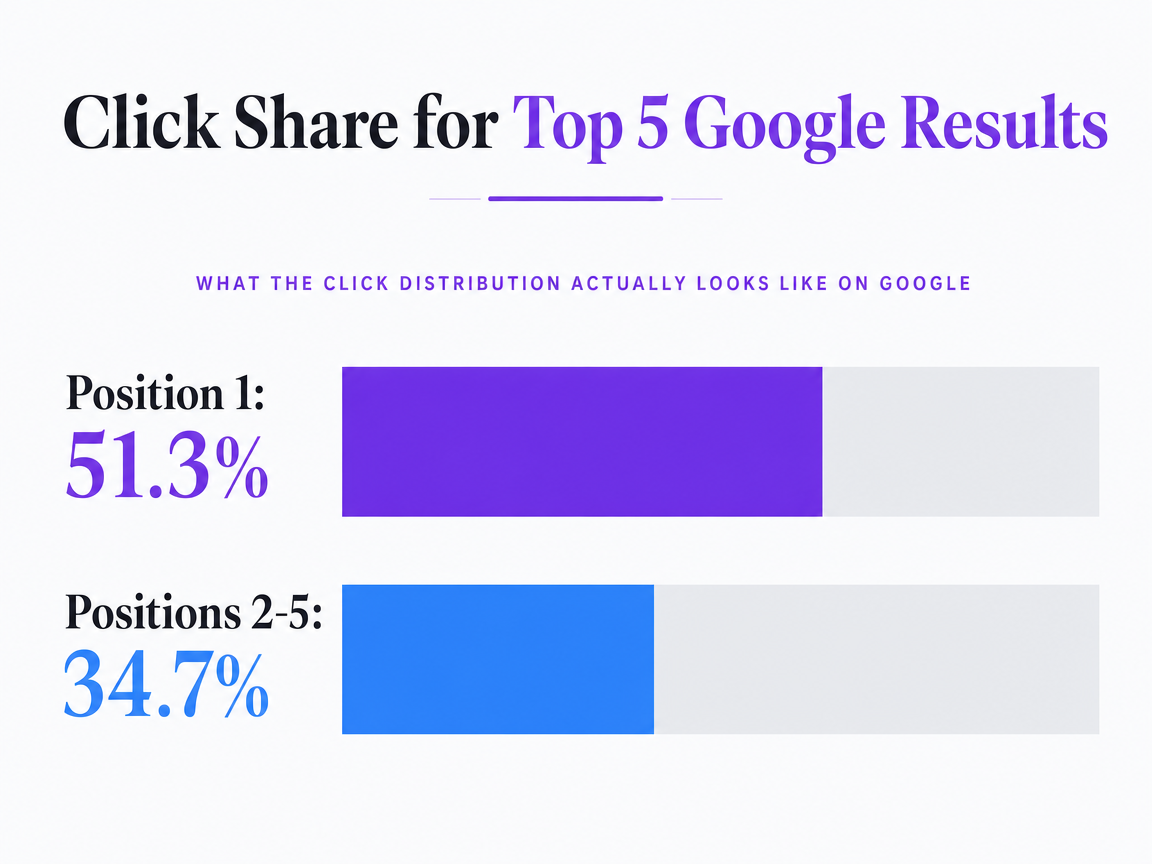 Click Share for Top 5 Google Results
The percentage of total Google clicks received by the top five organic search results, based on a 2023 study. The top 5 results received over 86% of clicks in total.
Reading CTR Without Confusing Position Bias for Content Quality
CTR looks like a clean quality signal until the mechanics of how it is generated get unpacked. A peer-reviewed information-retrieval study on implicit click feedback in web search demonstrated that clicks on ranked Google results are heavily shaped by position and presentation, not solely by relevance — users cannot click results they never scroll to examine, and higher-ranked results receive attention before lower ones regardless of underlying quality 7. Raw CTR, in other words, is a joint function of what the page offers and where Google chose to place it.
The reporting consequence is specific. When a page moves from position six to position three and CTR rises, the lift is largely a position effect, not evidence that the title tag rewrite worked. When two pages hold the same position for similar queries and one materially outperforms the other on CTR, that comparison is closer to a quality signal — because position is held roughly constant. Account teams that read CTR without controlling for position end up crediting content changes for gains driven by rank, and crediting content problems for CTR floors that are structural to the position.
Practically, that means CTR belongs in client reports as a position-normalized metric, not a raw one. A page holding position 4 with a 6% CTR is telling a different story than a page holding position 8 with the same 6% CTR — the second is materially outperforming its position, the first is materially underperforming. Segmenting CTR by position tier before drawing quality conclusions keeps the account team from writing optimization briefs against a metric artifact.
Validate SEO impact with live ranking data
Measure actual ranking shifts and ROI signals using published content in your own environment during the free trial.
Portfolio Economics: What One Position Is Worth Across a Book of Clients
If the Account Team Manages Multiple Client Sites
The analysis so far has stayed inside a single property. The economics change once the same lens is applied across a book of fifteen, thirty, or sixty client accounts — the reader shifts from ranking analyst to portfolio operator, and the value of a single position gain compounds in ways single-site reporting cannot show.
The multiplier that makes portfolio math tractable comes from a peer-reviewed Management Science study on ranking and consumer behavior. Using empirical ranking data, the paper reports that a one-position increase in rank produced a 10.07% average lift in click-throughs, with results appearing earlier on the page receiving more clicks than results appearing later 8. The scope matters: the figure is an average across the study's ranking experiments and product-search context, not a universal constant for every query, vertical, or SERP layout. It is best treated as a directional coefficient for portfolio planning, not a promise for any single keyword.
Applied across a portfolio, the coefficient compounds. A move from position 10 to position 1 is nine one-position gains stacked, and 1.1007 raised to the ninth power lands above 2.3x — meaning the same impression volume can produce more than double the clicks by the time a term reaches position 1, before the steeper position-1 premium in the observed click distribution is even layered on. Across thirty client sites each with ten commercial keywords in the top twenty, the coefficient turns individual ranking moves into a portfolio-level revenue argument the account team can quantify rather than assert.
The operational takeaway for portfolio leads: model incremental clicks as a function of position deltas across the full book, not as isolated wins in individual account reviews. That framing is what supports the revenue table in the next subsection.
A Portfolio Ranking-to-Revenue Table (Variables, Not Invented Dollars)
The table below models incremental monthly revenue from moving ten commercial keywords across a portfolio from position 5 to position 3, and again from position 3 to position 1. It uses only two quantitative inputs: the click-share tiers from the 2023 observed-behavior study on Google 1and the 10.07% per-position CTR coefficient from the Management Science ranking study 8. Every commercial variable — impression volume per keyword, close rate, average order value — is left as an agency-supplied input. No dollar figures are invented.
Impression volume is held constant at I per keyword per month. Click share is applied at the tier level: positions 2–5 sit inside the 34.7% band that covers four positions, position 3 is approximated at roughly 10% of clicks for a query, and position 1 lands at 51.3% of clicks in the study's sample 1. Close rate (C) and average order value (AOV) are the account team's numbers, populated per client from CRM data.
| Move (10 keywords) | Click share, current | Click share, target | Incremental clicks / keyword | Incremental monthly revenue (portfolio) |
|---|---|---|---|---|
| Position 5 → Position 3 | ~7% of query clicks | ~10% of query clicks | ≈ 0.03 × I | 10 × 0.03 × I × C × AOV |
| Position 3 → Position 1 | ~10% of query clicks | 51.3% of query clicks | ≈ 0.413 × I | 10 × 0.413 × I × C × AOV |
| Position 5 → Position 1 (combined) | ~7% | 51.3% | ≈ 0.443 × I | 10 × 0.443 × I × C × AOV |
Two operator notes. First, the delta between the two moves is not linear — position 3 to position 1 is worth roughly fourteen times the click delta of position 5 to position 3 in the study's distribution, which is why concentrating optimization effort on terms already inside the top five typically outperforms chasing page-two rankings across a wider term set. Second, the model assumes stable impression volume; SERP feature changes, seasonality, and AI-summary rendering can move I independent of position, and the account team should segment impression trends before attributing revenue lift to rank alone.
Reporting Integrity: Keeping Organic and Paid Attribution Honest
Blending organic and paid search into a single search performance line is the fastest way for an agency to lose credibility when a client's procurement team starts asking sourced questions. The two channels interact — they are not independent — but the interaction is a reason to report them separately with the relationship annotated, not a reason to merge them.
Academic work on the interplay between organic and sponsored listings found positive interdependence between clicks on the two result types, and separately identified rank as negatively related to CTR within the studied listings 5. A related study on how users distribute attention between organic and sponsored results defined click rate as clicks divided by impressions and examined how the two result formats compete for the same attention on the same SERP 11. Read together, the two papers say something specific: when a brand holds both a paid and an organic position for the same query, click volume on each is partially a function of the other's presence, and neither channel's CTR can be interpreted in isolation.
The reporting consequence is that pausing a paid campaign to see what SEO is really doing does not produce a clean read on organic value — it produces an organic CTR measured in a different SERP, one where the brand's paid slot is no longer competing for or reinforcing the click. Incremental value has to be estimated from held-out geographies, query segments, or scheduled paid-pause windows, not from a monthly delta in blended traffic.
The disclosure layer sits on top of the measurement layer. The FTC's guidance to the search industry is explicit that failing to clearly and prominently distinguish advertising from natural search results could be deceptive 6, and truth-in-advertising standards apply to online advertising generally, including the performance claims an agency puts in dashboards and case studies 4. For agency SEO leads, that translates into two dashboard rules: label paid and organic rows separately, and do not attribute revenue to SEO when the underlying conversion path included a paid click the report has quietly folded in.
Forward-Looking Measurement Risk: SERP Distribution After the 2025 Remedies
The click-distribution figures the earlier sections leaned on describe a SERP that may not sit still for the next reporting cycle. On September 2, 2025, the U.S. Department of Justice announced remedies in its search monopolization case against Google, including restrictions on certain exclusive distribution contracts and requirements that Google make specified search-index and user-interaction data available to eligible competitors 2. The underlying court memorandum ties those remedies to findings that Google maintained monopolies in general search services and general search text advertising through exclusive distribution agreements 3.
Neither document establishes what happens next to organic click share, default-engine exposure, or publisher traffic. That uncertainty is the point. If default placement on browsers and devices shifts, if syndication opens to rivals, or if query volume redistributes across engines during implementation and any appeals, the impression baseline that anchors every ranking-to-revenue model above can move independent of anything an agency changes on a client site. A drop in impressions on a term holding position 3 could reflect a distribution change, not a ranking loss — and the reverse is equally possible.
The operational response for portfolio leads is measurement continuity, not prediction. Baseline impression volume by query and by engine now, before any remedy-driven redistribution shows up in the data. Segment year-over-year comparisons by engine source rather than reporting a blended organic line. When a client asks why traffic moved, the account team should be able to separate a rank change from a distribution change on the same dashboard, using data captured before the shift began.
See How Your Search Rankings Directly Impact ROI—With Benchmark Data
Request a custom analysis linking your website’s current ranking data to industry-specific ROI benchmarks, and discover actionable ways to scale performance across multiple client sites.
Quality-Adjusted Conversions and the Substantiation Layer Under ROI Claims
A conversion that closes on the dashboard and refunds, cancels, or complains a week later is not the same asset as a conversion that stays. Quality-adjusted reporting takes the raw conversion count from analytics, subtracts the ones that fail downstream — bad-fit leads flagged by intake, refunds, chargebacks, cancellations inside a defined window — and reports what remains against acquisition cost. That number is the one that survives client scrutiny when procurement asks why paid pipeline and booked revenue diverge.
The design of the conversion path itself feeds directly into that adjustment. An international review coordinated by the FTC examined 642 subscription websites and apps and found that nearly 76% used at least one possible dark pattern and nearly 67% used multiple 9. The FTC's separate report on the same category catalogs disguised advertising, buried terms, difficult cancellation flows, and privacy-steering interfaces as recurring practices that inflate short-term conversions while creating retention, trust, and enforcement exposure downstream 10. Neither document sets a quantitative discount for those effects, but both mark them as conversion quality risks that a raw dashboard number will not surface.
The substantiation layer sits above the measurement layer. Truth-in-advertising standards apply to online advertising, including the performance figures agencies publish in case studies, decks, and client-facing dashboards 4. A ROI claim of X% revenue lift from SEO has to be supported by the same evidence the account team would show a regulator: the attribution model, the measurement window, the exclusions, and the base rate. For agency SEO leads, the practical rule is to report quality-adjusted conversions and net revenue against source, keep the substantiation file for every published outcome, and stop shipping headline percentages that the underlying data cannot defend under questioning.
Rebuilding the Client Conversation: From 'Where Do We Rank' to 'Where Does the Funnel Leak'
The client question that opens this piece — how does my website rank — is almost always a proxy for a different question the client has not yet articulated: whether the retainer is producing revenue that would not otherwise exist. Answering the literal question with a position number closes the meeting and reopens the doubt. Answering the underlying question requires a different dashboard.
The reporting shape that survives quarterly business reviews has four rows, not one.
- Click share by position tier replaces average position, so the client sees where their keywords sit on the distribution curve rather than a flattened mean.
- Impressions segmented by engine and SERP layout replace blended organic totals, so a distribution shift can be separated from a ranking loss when the account team is asked why traffic moved.
- Organic and paid conversions sit on labeled rows rather than a combined search line, consistent with the FTC's standard that paid and natural results be distinguishable in the environments where users encounter them 6.
- Quality-adjusted conversions and net revenue against source replace the raw dashboard count, keeping the substantiation file behind every published ROI figure defensible.
For agency SEO leads running fifteen to sixty accounts, the operational shift is upstream of the dashboard. It sits in how account reviews are structured: diagnose which stage of the funnel actually leaked this month, price the fix against portfolio-level position economics, and route the recommendation through an approval workflow the client can see. Platforms like Vectoron are built around that approval-first loop precisely because scale reporting fails when every account review reinvents the framework. The account team that ships the same defensible funnel view across the book — with the leak identified and the next move quantified — is the one that keeps the retainer when a competitor shows up with a prettier ranking chart.
Frequently Asked Questions
References
- 1.You are how (and where) you search? Comparative analysis of search engine use and user behavior.
- 2.Department of Justice Wins Significant Remedies Against Google.
- 3.Memorandum Opinion: U.S. and Plaintiff States v. Google LLC.
- 4.Advertising FAQ's: A Guide for Small Business.
- 5.Analyzing the Relationship Between Organic and Sponsored Search Advertising.
- 6.FTC Consumer Protection Staff Updates Agency's Guidance to Search Engine Industry on the Need to Distinguish.
- 7.Evaluating the Accuracy of Implicit Feedback from Clicks and Query Reformulations in Web Search.
- 8.Examining the Impact of Ranking on Consumer Behavior and Search Engine Revenue.
- 9.FTC, ICPEN, GPEN Announce Results of Review of Use of Dark Patterns Affecting Subscription Services and Privacy.
- 10.Bringing Dark Patterns to Light.
- 11.Competing for Users' Attention: On the Interplay between Organic and Sponsored Search Results.
- 12.Modeling and Predicting User Behavior in Sponsored Search.