
Key Takeaways
- Rank position is a derived signal, not an outcome; report impressions, clicks, CTR, search appearance, and conversions with position as one dimension among several 16.
- For portfolios above a dozen properties, use BigQuery bulk export as the collection layer and the Search Analytics API for backfills, since bulk export removes the daily row cap 3.
- Standardize one API connector with fixed dimensions, per-search-type requests, and consistent pagination, so every client property lands in the warehouse with the same schema 9.
- Enforce six segmentation dimensions across the portfolio—client, search type, country, device, query, page, and search appearance—so client comparisons measure the same thing 16.
- Join Search Console to GA4 on normalized landing page, country, and device, then surface both click and session totals side by side as a data-quality signal 5.
- Disclose personalization and anonymized-query gaps once, using the property-level total as the authoritative visibility number rather than attempting to back-fill missing queries 3, 8.
- Track AI Overview and AI Mode visibility as a separate series filtered by searchAppearance, paired with the Gen AI performance report, never blended into a combined position average 15, 6.
- During core updates, wait a full week after completion, compare equal-length windows anchored to Search Status Dashboard dates, and report correlation rather than causation 11, 12.
Why rank position stopped being the KPI
Position is a derived number, not an outcome. Google Search Console reports average position based on the topmost result for a property across actual impressions, aggregated across users, locations, and devices 16. That definition alone should end the internal debate about whether a single scraped SERP screenshot represents a client's ranking. It does not.
Ranking systems are a stack, not a formula. Google describes many automated systems interacting across hundreds of billions of pages 7, which means a two-position slip on a head term almost never has a single cause an account manager can name in a Monday email. Rank movement is a signal to investigate, not a verdict to report.
There is also a composition problem. AI Overviews and AI Mode are now counted inside the existing Performance report using the same clicks, impressions, and position methodology 15, so the same numeric position covers a materially different result page than it did eighteen months ago. Longitudinal comparisons at the keyword level quietly break unless the reporting layer accounts for that shift.
Agency SEO leads managing 15 to 100+ client properties need a measurement system built on impressions, clicks, CTR, search appearance, and downstream conversions, with rank as one dimension among several. The rest of this article specifies that system: the collection paths, the joins, the segmentation, and the guardrails that survive a client call during an algorithm update.
The portfolio measurement stack: three viable data paths
Search Console UI, API, and BigQuery bulk export compared
Three collection paths dominate agency practice. The Search Console UI is the default per-property view, the Search Analytics API supports programmatic pulls, and the BigQuery bulk export delivers a daily dump of the underlying dataset. Each carries different ceilings, and those ceilings decide what a portfolio dashboard can actually show.
The UI is a viewing surface, not a collection layer. It exposes filtered totals to whoever is logged in, and it does not scale to fifty properties without an account manager clicking through fifty tabs. There is no aggregation across clients, no historical retention beyond Google's rolling window, and no way to attach the numbers to a warehouse.
The Search Analytics API is where most agencies start. It exposes a maximum of 50,000 rows per day per site per search type, with Google recommending single-day queries to avoid quota issues 1. Result sets above 25,000 rows can be paginated by incrementing startRow with rowLimit until the response empties 2. That is enough for standardized daily pulls across a portfolio, but the daily row ceiling caps how deep the long tail can go for any single high-volume property, and filtering or grouping choices materially change what the API returns 16.
The BigQuery bulk export removes the daily row cap. Google's ongoing export writes a daily data dump to BigQuery that is not subject to the API's daily data-row limit, splitting the payload into site-impression and URL-impression tables 3. That is the collection path built for portfolio scale: raw rows, indefinite retention by default, and native SQL joins across every connected property in a single warehouse. The unavoidable gap is that bulk export still filters out anonymized queries 3, so query-level totals will always sit below chart-level impressions in the UI 16.
| Path | Row ceiling | Historical retention | Cross-client aggregation | Known gap ||---|---|---|---|---|| Search Console UI | UI-filtered totals only | Google's rolling window | None; per-property clicks | Anonymized queries hidden; no export path || Search Analytics API | 50,000 rows/day/site/search type 1; paginate above 25,000 2| Whatever the pipeline stores | Available if the pipeline writes to a warehouse | Daily row cap; filter/grouping changes affect totals 16|| BigQuery bulk export | Not subject to daily row limit 3| Indefinite by default 4| Native SQL across all connected properties | Anonymized queries filtered out 3|
For a portfolio above roughly a dozen properties, bulk export is the collection layer and the API is the surgical instrument for backfills, ad-hoc segments, or newly onboarded clients waiting on their first export cycle.
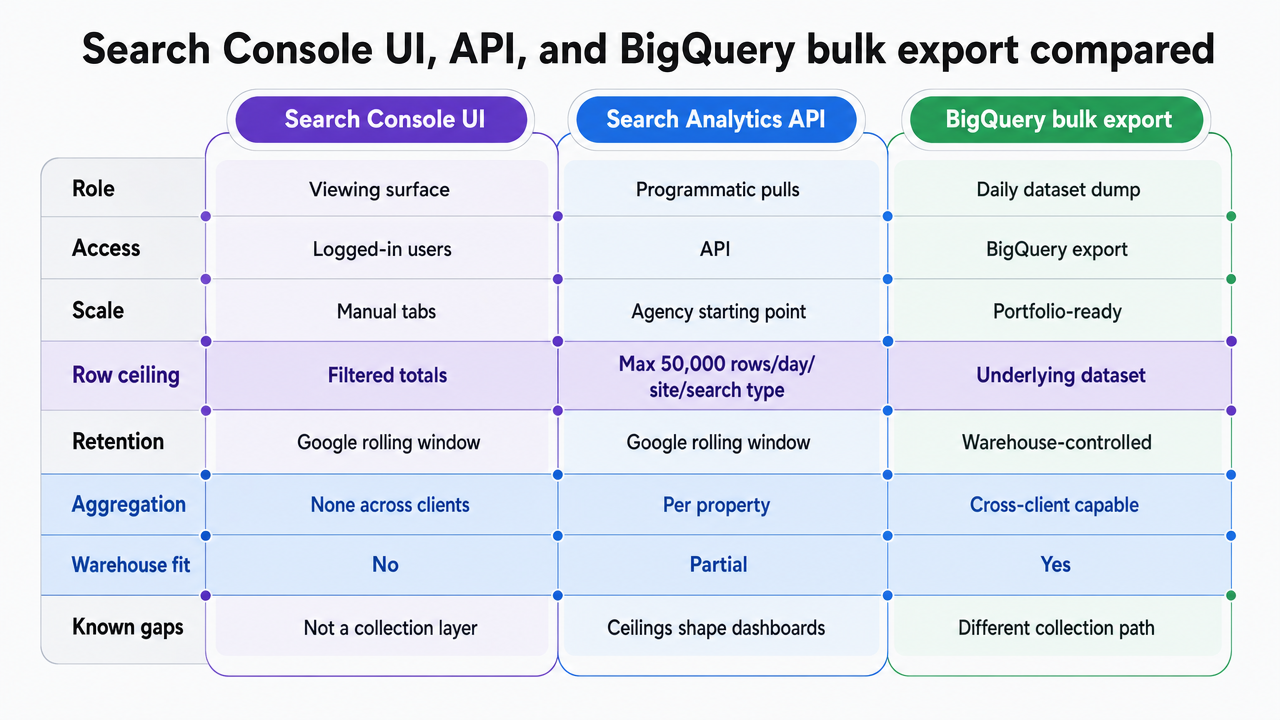 Compare the three collection paths side by side, matching the article's comparison table so readers can quickly grasp row ceilings, retention, aggregation, and known gaps
Standardizing the connector across N client properties
One connector, one schema, one client dimension. That is the design constraint that prevents a portfolio from becoming fifty bespoke pipelines that each break in a different way.
Build the API connector against the Search Analytics query endpoint with a fixed request shape: date range of one day, dimensions of query, page, country, device, and searchAppearance, and the same aggregation type across every property 9. Vary only the site URL and the search type parameter. Sorting, row limits, and aggregation choices materially change the returned rows 9, so those parameters belong in a config file, not in each account manager's script.
Handle pagination the same way everywhere. Any property with more than 25,000 rows for a given day needs incremented startRow calls until the response returns zero rows 2. Loop that logic once, apply it to every client, and log the row count per pull so backfills can be verified rather than assumed.
Separate search types at the request level rather than in post-processing. Web, image, video, news, and Discover each carry their own 50,000-row daily ceiling 1, and combining them in a single query loses that headroom. The output schema should carry client_id, property_url, search_type, and pull_date as required columns on every row, which is what makes downstream segmentation trivial and audit trails defensible.
BigQuery partition and retention decisions
Bulk export is cheap to turn on and expensive to leave unattended. Google keeps exported data indefinitely by default and recommends setting partition expiration based on analytical needs and storage considerations 4. That default is where warehouse bills grow quietly across a portfolio.
Set partition expiration at 16 months on the URL-impression and site-impression tables if year-over-year comparison is part of the client reporting rhythm. That preserves a full 12-month window plus a four-month buffer for late-arriving analysis and quarter-boundary comparisons. Shorten to 13 months only if year-over-year is genuinely not used, and never shorten below the longest client contract's reporting window.
For clients on retainer with quarterly business reviews, snapshot aggregated monthly summaries into a separate long-retention table before the raw partitions expire. That keeps the warehouse footprint bounded while preserving the trend lines that clients actually see. Storage decisions get made once per property at onboarding, documented in the client's data spec, and revisited only when the contract scope changes.
Segmentation dimensions that make portfolio data usable
A warehouse full of daily exports is not a reporting system. Segmentation is what turns raw rows into answers a client will accept, and the dimensions have to be decided once and enforced across every property.
Six dimensions carry the weight:
- client (property_url)
- search type
- country
- device
- query
- page
- search appearance
Search Console's Performance report exposes each of these as filters or grouping dimensions, and Google is explicit that filter and grouping choices change the returned totals 16. A portfolio dashboard that groups by query for one client and by page for another is not comparing the same thing.
Search type is the dimension most often collapsed by accident. Web, image, video, news, and Discover each have their own row ceiling in the API 1and their own behavior in bulk export. Keep them as separate rows in the warehouse and let the reporting layer aggregate up when a client asks for a single visibility number. Going the other direction, from a blended total back to per-surface detail, is not possible without a re-pull.
Country and device belong on every row because they are the join keys that make Search Console data compatible with GA4 later 5. A client with 60% mobile traffic and a US-heavy audience does not want a global desktop-weighted position average, and the warehouse should never force that calculation.
Search appearance is the newer dimension worth carrying explicitly. It separates rows that appeared in featured snippets, video results, sitelinks, and AI features from ordinary blue-link impressions, which is what makes the AI Overview reporting track in a later section possible without a schema change. Store it once, filter it a hundred ways.
Joining Search Console with GA4 for outcome-linked reporting
Search Console answers what happened on the SERP. GA4 answers what happened after the click. Neither answers the client's actual question, which is whether the SEO retainer is producing pipeline, so the join between them is where portfolio reporting earns its keep.
Google is explicit about how to make the two datasets compatible: apply the same country and device filters on both sides, and use country, device, and landing page as the join keys 5. That last one is the operative constraint. Search Console reports clicks against the landing page Google recorded for the impression, and GA4 reports sessions against the landing page it recorded for the entry, and those two URLs need to be normalized to the same canonical form in the warehouse before any SQL join runs. Strip tracking parameters, unify trailing slashes, and resolve http/https and www variants at ingestion, not at query time.
Expect the totals to disagree. Search Console counts clicks from Google Search using its own methodology, while GA4 counts sessions with a different attribution model and session definition 5. The reporting layer should surface both numbers side by side rather than picking one, with clicks-to-sessions ratio tracked per client as a data-quality signal. Sudden divergence usually points to a tagging problem, not a ranking one.
The join pays off at the conversion column. Once landing page, country, and device align, GA4 conversions can be attributed back to the query and search appearance that produced the impression, which is what turns a rank movement into a revenue conversation.
Track Multi-Client SEO Rankings in Real Time
Monitor and report on live SEO ranking data across your entire client portfolio with full platform access.
The one section on personalization and anonymized queries
Two measurement constraints get restated across every rank-tracking article ever written, and neither belongs in the footnotes. They belong here, once, with scope disclosed.
Personalization is smaller than most client-facing narratives assume. The most rigorous public measurement, Hannak et al., found that on average 11.7% of Google results and 15.8% of Bing results differed across users because of personalization, with top-ranked results showing less variation than lower-ranked results 8. The authors describe that figure as a lower bound, the methodology dates to 2017, and neither number accounts for today's AI features. Use it for what it is: evidence that a single browser screenshot is not a client's ranking, not a precise coefficient to plug into a dashboard. When a client sends a screenshot showing their site in position four while the portfolio report shows an average position of 6.8, personalization is one of several reasons the two numbers legitimately disagree, alongside location, device, session history, and the fact that average position aggregates across every impression rather than one query 16.
Anonymized queries are the second unavoidable gap. Search Console filters rare queries out of query-level reporting to protect user privacy, and the BigQuery bulk export inherits that filter 3. The practical consequence is that summing clicks across the query dimension will always fall short of the property-level total shown in the chart view 16. Reconcile once at ingestion by storing both the property-level daily totals and the query-level rows in separate tables, then reference the property total whenever a client asks for the authoritative visibility number. Do not attempt to back-fill the missing queries. They are not recoverable at any scale, from any vendor, through any tool.
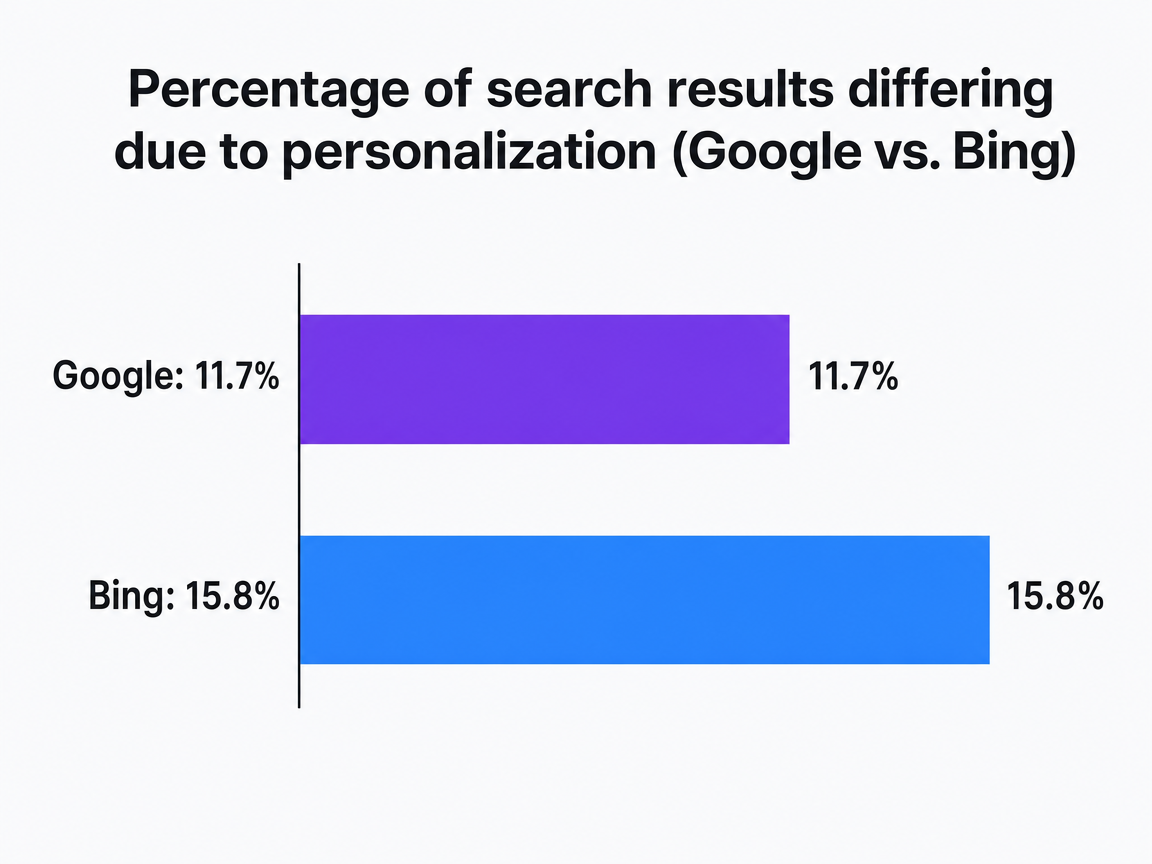 Percentage of search results differing due to personalization (Google vs. Bing)
A 2017 research study found that on average, 11.7% of Google's search results and 15.8% of Bing's search results differed due to personalization.
AI Overview and AI Mode visibility as a separate track
Traditional position metrics were built for a ten-blue-link result page that no longer exists on most commercial queries. AI Overviews and AI Mode are now counted inside the Search Console Performance report using the same clicks, impressions, and position methodology as ordinary results 15, which means the blended number sitting in a client dashboard silently absorbs a fundamentally different surface. That is a reporting hazard, not a feature.
Separate the two tracks at the warehouse layer. The searchAppearance dimension carried on every row from Section 3 is what makes this trivial: filter for AI-feature appearances and report them as a distinct visibility line, then report everything else as conventional Search visibility. Blending them into a single position average obscures the movement that clients actually want explained.
The dedicated Gen AI performance report is the second data source. Google's report exposes impressions, pages, countries, devices, and dates for URLs appearing in generative AI features, with hourly, daily, weekly, and monthly monitoring granularity 6. Pull it on the same cadence as the standard Performance API and land it in a parallel table keyed on the same client_id and property_url. Reporting then presents three lines per client: conventional Search visibility, AI-feature visibility, and combined clicks, with the caveat that combined position is not a meaningful average.
Eligibility governs the whole track. A page must be indexed and eligible to appear in Google Search with a snippet to surface as a supporting link in AI Overviews or AI Mode, and Google states there are no additional technical requirements beyond that 13. When a client asks why a page is not appearing in AI features, the diagnostic starts with indexation and snippet eligibility, not with speculative optimization tactics.
Treat AI-feature clicks as a separate CTR series against AI-feature impressions. Combining them with blue-link CTR produces a number that trends downward for reasons that have nothing to do with performance. Keep the series parallel, annotate the launch dates of AI features from the Search Status Dashboard on both charts 12, and report movement on each track independently.
Reading rank movement during core updates without embarrassing yourself
Core updates are the moments when portfolio measurement discipline either pays off or exposes itself. Every account manager gets pinged the same week, every client wants a same-day answer, and the temptation to open a dashboard on day two of a rolling update and start narrating is what produces the emails that get quoted back six months later.
Google's own protocol is the one to follow: wait at least a full week after a core update completes before analyzing a site, then compare the post-completion period against the period before the update began 11. Update dates come from the Search Status Dashboard, which lists ranking updates with their start and completion timestamps 12. Annotate those dates on every client chart in the warehouse before any analyst touches the data. A vertical line on the impressions and position series turns a noisy conversation into a bounded one.
Build the comparison windows once and reuse them. If a core update ran September 3 through September 17, the analysis window opens September 24, the pre-update baseline covers August 6 through September 2, and the post-update measurement covers September 24 through October 21. Equal-length windows, matched by day-of-week where possible, filtered by the same country and device segments the client actually cares about. Skip the equal-length discipline and the comparison starts absorbing weekly seasonality that has nothing to do with the update.
What gets reported is a delta on clicks, impressions, and query-level winners and losers, segmented by page and search type 10. Position deltas belong in the report but not at the top of it. A page that lost two positions but held its clicks is not the same problem as a page that held its position but lost half its impressions, and the debugging framework Google publishes distinguishes those cases by asking whether affected pages and queries share a pattern before assuming the update is the cause 10. Seasonality gets ruled in or out with Google Trends on the head queries, not with intuition.
Causation is the trap. Ranking systems are a stack of interacting signals across hundreds of billions of pages 7, and a portfolio report can establish that movement correlated with an annotated update window, but it cannot prove the update caused any specific client's change. Say correlated. Show the annotation. Show the affected-pages pattern. Let the client draw the causal line themselves, and reserve the word "caused" for cases where a site-specific signal, such as a deployment, a redirect, or an indexation change, lines up cleanly with the movement independent of the update window.
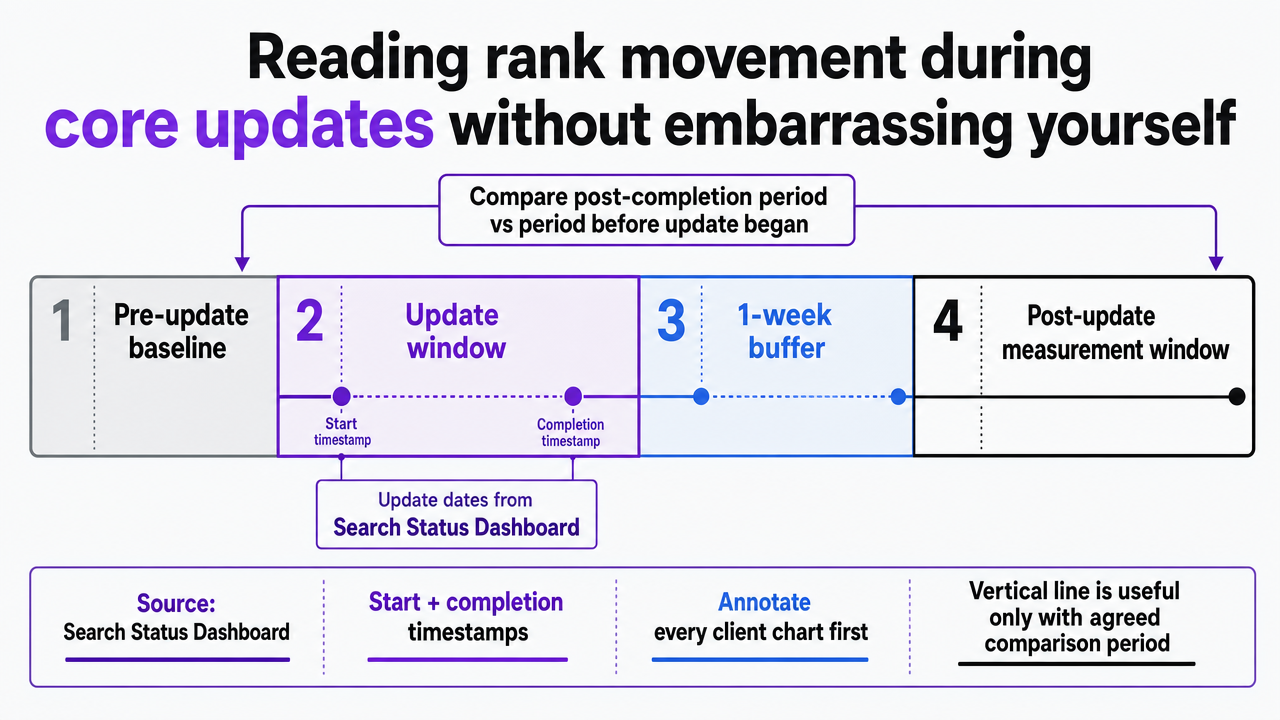 Visualize the exact core-update analysis protocol described in the section: pre-update baseline, update window, one-week buffer, and post-update measurement window, so agencies can adopt the timing discipline
See Portfolio-Wide SEO Ranking Movements in a Single Unified Dashboard
Request a walkthrough of advanced rank tracking solutions designed for agencies managing high-volume client portfolios—compare historical trends, automate reporting, and surface actionable insights across all accounts.
Technical health signals that belong in the same dashboard
Visibility metrics answer whether Google is showing a client's pages. Technical health signals answer whether those pages are worth showing. Both belong on the same portfolio dashboard, on the same row, keyed to the same client_id, because a client asking why impressions dropped rarely wants to hear that the answer required opening a second tool.
Core Web Vitals are the minimum technical row. Google defines the field thresholds at the 75th percentile: LCP of 2.5 seconds or less, INP of 200 milliseconds or less, and CLS of 0.1 or less 14. Pull those from the CrUX API per property, segment by device the same way the visibility rows are segmented, and render pass/fail against the three thresholds rather than a single composite score. A property passing LCP and CLS while failing INP is a specific engineering conversation, not a generic performance flag.
Segment CWV by device on every property. Mobile and desktop routinely land on opposite sides of the INP threshold, and a site-wide average hides which surface the client should prioritize 14. Report the 75th-percentile value alongside the pass/fail, so a 2.7-second LCP reads differently than a 6.1-second LCP even though both fail the same threshold.
Escalation logic: what reaches the client, what stays internal
Not every portfolio movement is a client conversation. The escalation rule that scales across 50-plus properties is simple: correlate first, escalate second, and only surface what changes the client's next action.
Use a two-axis test. Axis one is whether the movement aligns with an annotated ranking update from the Search Status Dashboard 12. Axis two is whether the affected pages and queries share a site-specific pattern, such as a template, a redirect group, or a recent deployment 10. Movement that lines up with an update window and shows no site-specific pattern stays internal as a monitoring note until the one-week post-completion window closes 11. Movement that shows a site-specific pattern, with or without an update overlay, escalates immediately because the client controls the fix.
Three events always reach the client the same day:
- an indexation drop on revenue pages,
- a CWV threshold flip on a template that carries meaningful traffic 14,
- and a click decline that outpaces the impression decline by more than a standard portfolio band.
Two events stay internal:
- personalization-explained screenshot disputes,
- and query-level noise inside the anonymized-query gap 3.
Document the rule once, apply it uniformly, and the same movement never gets narrated three different ways by three account managers.
Operating the stack without adding analyst headcount
The stack described so far, bulk export into BigQuery, standardized API connector for backfills, GA4 join on normalized landing pages, parallel AI-feature series, CWV rows, and Search Status Dashboard annotations, does not require a bigger analyst team. It requires that the analyst work stop being manual.
Automate the three things account managers currently do by hand:
- The daily pull runs on a scheduler against the standardized connector 9,
- the annotation layer subscribes to the Search Status Dashboard so update windows appear on every client chart without human intervention 12,
- and the escalation logic from the previous section runs as a rules engine against the warehouse: correlate the movement, check for a site-specific pattern 10, and route only what changes the client's next action into a review queue.
What remains for the humans is judgment. An SEO strategist reviews the queued events, approves the client-facing narrative, and signs off on the recommended action before anything ships. That is the model Vectoron is built around, an approval-first execution layer over the measurement stack, and it is what lets a portfolio grow past 100 properties without the reporting cadence growing with it.
Frequently Asked Questions
References
- 1.Getting your performance data | Search Console API.
- 2.Query your Google Search analytics data | Search Console API.
- 3.Bulk data export: a new and powerful way to access your Search Console data.
- 4.BigQuery efficiency tips for Search Console bulk data exports.
- 5.Using Search Console and Google Analytics Data for SEO.
- 6.Introducing Search Generative AI performance reports in Search ....
- 7.A Guide to Google Search Ranking Systems | Documentation.
- 8.Measuring Personalization of Web Search.
- 9.Search Analytics: query | Search Console API - Google for Developers.
- 10.Debugging Google Search traffic drops.
- 11.Google Search’s Core Updates.
- 12.How to Use the Google Search Status Dashboard.
- 13.AI Features and Your Website | Google Search Central.
- 14.How the Core Web Vitals metrics thresholds were defined.
- 15.Google Search documentation updates.
- 16.A deep dive into Search Console performance data filtering and limits.