
Key Takeaways
- Rank data alone cannot answer the CFO's revenue question at a QBR; a keyword monitor produces visibility signals that must connect to engagement and booked outcomes to defend retainers.
- The three-layer stack pairs visibility as an early-warning signal with engagement as a content-quality check and revenue attribution tied to CRM outcomes through a query-analytics-CRM handshake.
- Query tiering separates money queries (treatment plus geo with a named landing page, conversion event, and CRM record) from assist, defensive, and discovery queries that get reported differently.
- Standardizing the five-beat QBR narrative and the join between monitor, analytics, and CRM compresses reporting from 4–8 hours per client toward 1–2, letting portfolios scale past 75 clients without added analysts.
Why Rank Data Stops Convincing Clients at the QBR
Somewhere around the third slide of the quarterly review, the room goes quiet. The Head of SEO has just walked a 40-location DSO through a clean set of ranking gains — 62 keywords into the top three, a two-position lift on branded plus procedure queries, share-of-voice up against two regional competitors. The client's CFO leans forward and asks the only question that matters: what did that earn us this quarter?
Rank data alone cannot answer that. A keyword monitor produces exactly what it was built to produce — keywords, positions, and visible pages, benchmarked against competing organizations in the same category 3. That output is a visibility signal, not a revenue statement. The gap between the two is where retainers get renegotiated.
The pressure on rank-only reporting has intensified for a specific reason. Web analytics research has long argued that acquisition metrics only become meaningful when linked to engagement and conversion outcomes, because organic traffic can indicate strong SEO while engagement problems point to usability or content issues the monitor cannot see 1. Rank moves. Clicks move differently. Booked appointments move differently again.
Agency leads running books of 20 to 200 clients face the same recurring problem at every QBR: the monitor tells a true story about visibility, and the client wants a true story about revenue. This article lays out the three-layer measurement stack, the query tiers, and the reporting cadence that closes that gap without adding analyst headcount.
The Three-Layer Measurement Stack That Turns Rank Into Revenue
Layer One: Visibility as an Early-Warning Signal
The keyword monitor's job is narrower than most client decks pretend. It measures visibility along three specific axes — the keywords a domain ranks for, the positions those keywords hold, and the visible pages that surface in the results — and it can benchmark those three axes against competing organizations in the same category 3. That is the entire native output. Everything else on a rank-tracking dashboard is either a derivative of those three variables or an integration pulled in from elsewhere.
For a Head of SEO, that scope is a feature, not a limitation. Visibility data moves faster than any downstream metric. A personal injury firm in Phoenix can lose four positions on a money query on a Tuesday and see the intake-line volume dip the following Monday. The monitor catches the shift days before the CRM does, which is why it belongs in the prioritization workflow — not the ROI proof workflow.
Treated as an early-warning signal, the visibility layer answers three operational questions each week:
- Which competing organizations gained or lost share on the tracked query set.
- Which URLs on the client's own domain moved, and in which direction.
- Which query clusters — treatment plus geo for a DSO, practice-area plus city for a legal client — changed enough to warrant an engagement-layer review.
What visibility cannot answer is whether any of that movement earned the client money. A 40-location DSO can gain positions on "same day crown [city]" across 22 markets and still book fewer new patients that month if the landing pages loaded slowly, the click-to-call button broke on mobile, or the scheduling widget mishandled Medicaid filters. Rank is the leading indicator. It is not the outcome.
Layer Two: Engagement as the Content-Quality Check
The engagement layer is where the monitor's blind spots become visible. Web analytics research frames a website's performance across five dimensions — engagement, users, acquisition, content, and platform — and warns that engagement problems often reflect usability or content issues rather than search visibility alone 1. A keyword monitor sees the acquisition side of that chain. It does not see the other four.
For an agency lead, that gap has a direct QBR consequence. A behavioral health intake page can rank second nationally for a residential-treatment query and still convert at a fraction of the expected rate because the page loads a 900-pixel hero image before the phone number renders, or because the intake form asks for insurance details before a prospective patient has decided to call. The rank is real. The engagement is broken. Reporting rank alone in that scenario overstates the win and delays the fix.
The engagement layer is what tells the delivery team which ranking gains are converting attention into consideration. The core signals — scroll depth on money pages, time-on-page for assist content, exits from key landing templates, click-to-call taps on mobile, form-field abandonment — are the diagnostic set that separates a content problem from a targeting problem. If visibility is climbing and engagement is flat, the page is reaching the wrong audience or failing them once they arrive.
Run weekly on the same query-to-URL map the visibility layer already tracks. That alignment is what makes the engagement data actionable rather than decorative — every engagement metric points at a specific ranked page, and every ranked page has an engagement benchmark to defend or improve.
Layer Three: Revenue Attribution to Booked Outcomes
The revenue layer is the one the CFO wants and the one most rank-tracking dashboards cannot produce on their own. Healthcare marketing research points to the specific endpoints that agencies must connect rank data to for defensible ROI: web analytics, campaign tracking, and conversion metrics such as appointment requests and portal registrations 6. Those endpoints are the ROI vocabulary. Positions are not.
Each vertical has its own version of a booked outcome. For a 40-location DSO, it is a scheduled new-patient appointment tagged by procedure and location. For a personal injury firm, it is a qualified case intake that clears a conflict check. For a senior living operator, it is a scheduled tour or a completed assessment. For a home health agency, it is an enrollment or an accepted referral. The monitor's tracked query set has to resolve to one of those endpoints, or the reporting stops at traffic.
The wiring is unglamorous but non-negotiable. Every money-query landing page carries a conversion event. Every conversion event carries the ranked query and URL that produced the session. Every booked outcome in the CRM or intake system carries back the source session ID. That three-way handshake — monitor query, analytics event, CRM record — is what lets the agency lead show a client that 62 new positions in the top three produced, for example, 41 booked consultations, 12 of which converted to closed cases at an average matter value the client already knows.
When the handshake breaks, the ROI story breaks with it. Sessions arrive with query data stripped. Conversion events fire without source attribution. CRMs log intakes without the session that produced them. The agency's job is to audit those breakpoints before the QBR, not during it. A revenue layer that only works 70% of the time will get argued down to zero by any competent client-side finance lead.
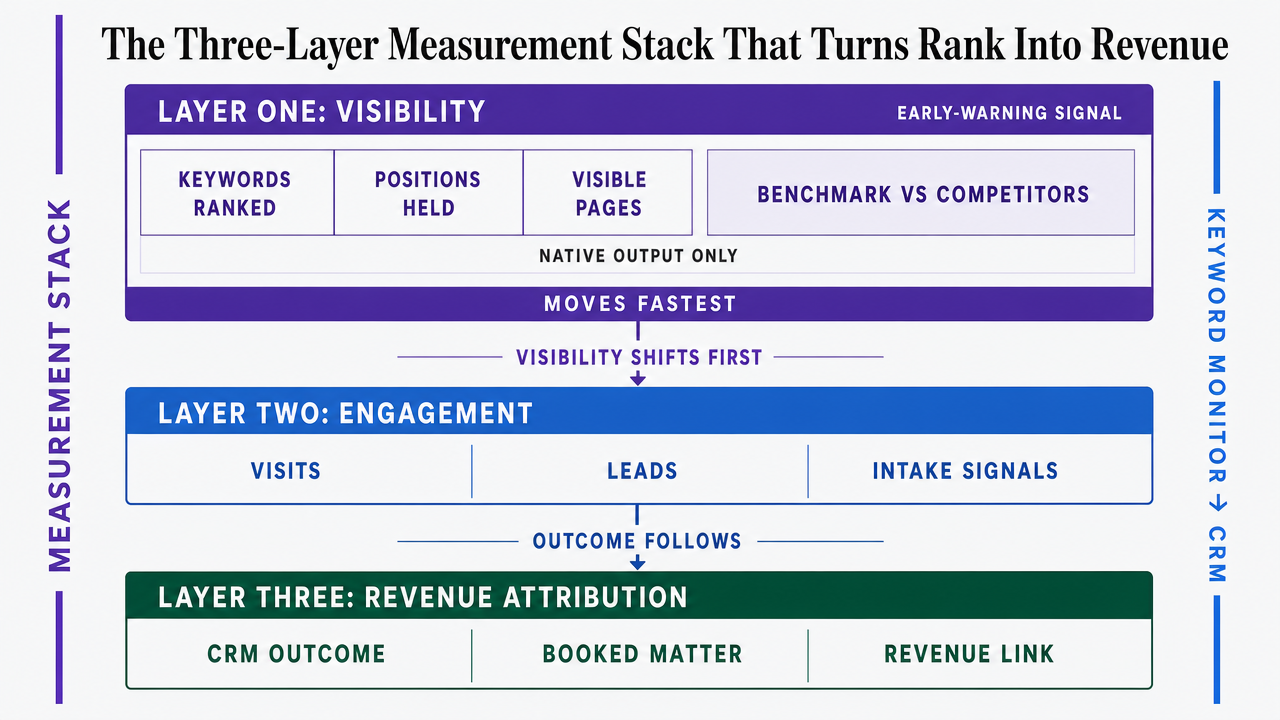 Visualize the three-layer measurement stack (Visibility, Engagement, Revenue Attribution) described in the section, showing how each layer feeds the next from keyword monitor to booked CRM outcome
The Query-Tier Model: Separating Revenue Queries From Noise
Money Queries: Treatment + Geo and Bottom-Funnel Intent
Not every ranked keyword deserves a slide. The money-query tier is the small subset that maps directly to a bookable outcome, and it is the tier that has to survive the CFO's scrutiny at the QBR.
For a dental client, money queries almost always take the shape of treatment plus geography. Dental SEO research is explicit that tracking performance for local and service-specific keywords is essential to understanding whether patients can find a practice when searching for dental care in their area 7. "Emergency dentist [neighborhood]," "dental implants [city]," "invisalign [zip-adjacent term]" — each of these is a discrete revenue vector for a 40-location DSO, and each resolves to a specific location's schedule.
The pattern holds across the reader's verticals with different vocabulary. For a personal injury firm, money queries are practice-area plus city plus qualifier: "truck accident lawyer [city]," "workers comp attorney near me." For a residential behavioral health operator, they are condition plus level-of-care plus geo: "inpatient rehab [state]," "adolescent PHP [metro]." For a home health agency, they are service plus payer or plus geo: "medicare home health [county]."
The operational rule is strict. A query enters the money tier only when the delivery team can name the exact landing page it lands on, the exact conversion event it fires, and the exact CRM record type it produces. Anything that fails those three tests belongs in a different tier and gets reported differently.
Assist, Defensive, and Discovery Queries
The other three tiers do real work, but they do not close the QBR. Reporting them the same way as money queries is what makes agency decks feel padded.
Assist queries are informational searches that a prospective patient or client runs earlier in the decision, then returns from later on a converting session. A "how much does invisalign cost" page or a "what to expect in inpatient treatment" article rarely takes a same-session booking, but it seeds the consideration set. Healthcare SEO research points out that visibility on patient-relevant informational queries drives engagement with reliable resources and shapes downstream behavior 5. The reporting move is to credit assist queries by assisted conversions in the analytics layer, not by direct bookings, and to say so plainly on the slide.
Defensive queries protect what the client already earns. Brand terms, competitor-comparison queries, and reputation searches sit here. A 40-location DSO losing rank on its own brand plus a competing DSO's name is bleeding pipeline before the acquisition side ever swings. Defensive-tier reporting is a floor metric — held or lost — not a growth metric.
Discovery queries are top-of-funnel awareness terms with weak conversion behavior on their own. They earn a place in the monitor for content-strategy signal and share-of-voice benchmarking against competing organizations in the category 3, but they should not appear on a revenue slide. When the delivery team labels each tracked query with one of the four tiers, the QBR narrative writes itself: money queries carry the revenue story, assists carry the pipeline story, defensives carry the retention story, and discovery carries the market-position story.
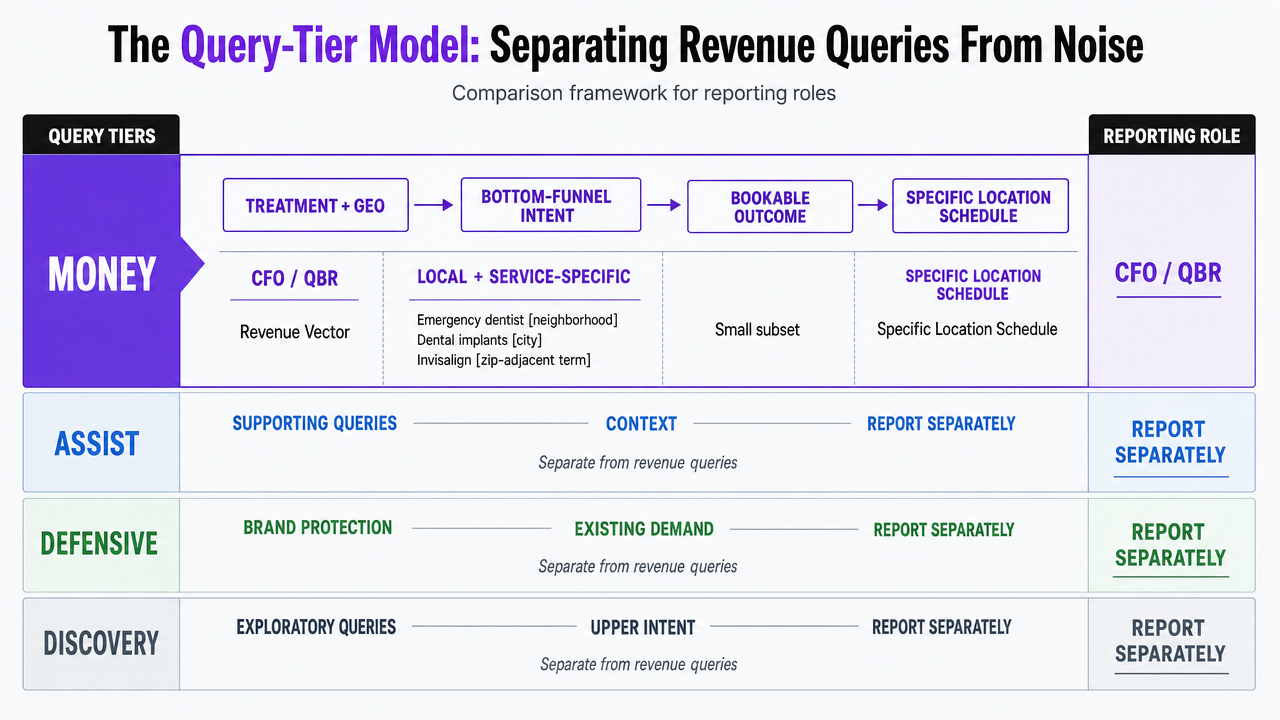 Show the four query tiers (Money, Assist, Defensive, Discovery) as a comparison framework with the reporting role of each, matching the section's tiering model
Track Keyword Movements and Demonstrate Measurable ROI
Monitor real-time keyword shifts and validate campaign impact for your clients during your trial period.
Surviving AI Overviews and the Zero-Click Collapse
The QBR problem gets worse when a top-three ranking no longer produces the click volume it used to. AI-generated summaries at the top of the SERP, expanded knowledge panels, and richer answer modules have decoupled rank from traffic in ways a keyword monitor cannot register on its own. A tracked position of two on a treatment query can now surface below an AI answer that resolves the intent before the user ever scrolls. The monitor reports a win. The analytics package reports a decline. Both are correct.
Search performance research has argued for years that rank is only one dimension of effectiveness, and that user-centric outcomes — whether the user actually got what they came for — have to be measured alongside relevance and position 2. That argument has become operational rather than academic. When the SERP resolves a query above the organic result, the ranked page's value shifts from click-capture to brand exposure and to serving the narrower slice of users who need more than a summary.
The reporting move is a query-level split. Segment the monitored set into queries where AI or feature modules currently appear versus queries where the classic ten blue links still dominate. Report click-through and conversion separately for each segment. On the AI-exposed segment, lead with impression share and share-of-voice against competing organizations in the category 3, then show the smaller click and conversion base honestly. On the classic segment, lead with the rank-to-click-to-conversion chain the client already understands. Splitting the two prevents a zero-click loss on informational queries from contaminating the money-query story, and it gives the delivery team a defensible answer when a CFO asks why traffic fell while positions held.
The Standard QBR Narrative: Visibility Delta to Pipeline Delta
The QBR narrative that survives a CFO's cross-examination follows the same five-beat structure every quarter, for every client in the book. Standardizing it is how a Head of SEO stops rewriting the story from scratch and starts defending retainers on a template.
- Beat one is the visibility delta. Show the change in tracked keywords, positions, and visible pages against the same competing organizations in the category from last quarter 3. Lead with the money-tier query set. Keep discovery and defensive tiers on a separate reference slide.
- Beat two is the engagement delta. For each money-query URL that moved on visibility, show what happened to scroll depth, click-to-call taps, and form starts. This is where the delivery team demonstrates that the ranking gains actually reached the audience they were supposed to reach 1. A visibility win with flat engagement is a targeting problem the agency names before the client does.
- Beat three is the conversion delta. Appointment requests, portal registrations, intake calls, tour bookings — the specific endpoint the vertical uses 6. Every money query resolves to one of these events, and the slide shows the count, the rate, and the URLs that produced them.
- Beat four is the pipeline delta. The client's CRM tells the delivery team how many of those conversions became qualified opportunities and, where the sales cycle is short enough, closed matters or booked revenue. Professional-services measurement research is direct on this: integrated scorecards that align search metrics with client acquisition and revenue outcomes are what let agencies discuss ROI credibly rather than defensively 9.
- Beat five is the next-cycle priority list. Three to five actions, ranked, each tied to a specific query cluster and a specific expected impact on one of the earlier beats. This is where the visibility layer earns its keep as an early-warning input — the queries losing share this month are the ones the delivery team commits to next month.
Run the five beats in the same order, with the same slide titles, for every client. The consistency is the point. It trains client-side finance leads to expect a revenue answer, not a rank answer, and it gives the delivery team a fixed frame to industrialize across the portfolio.
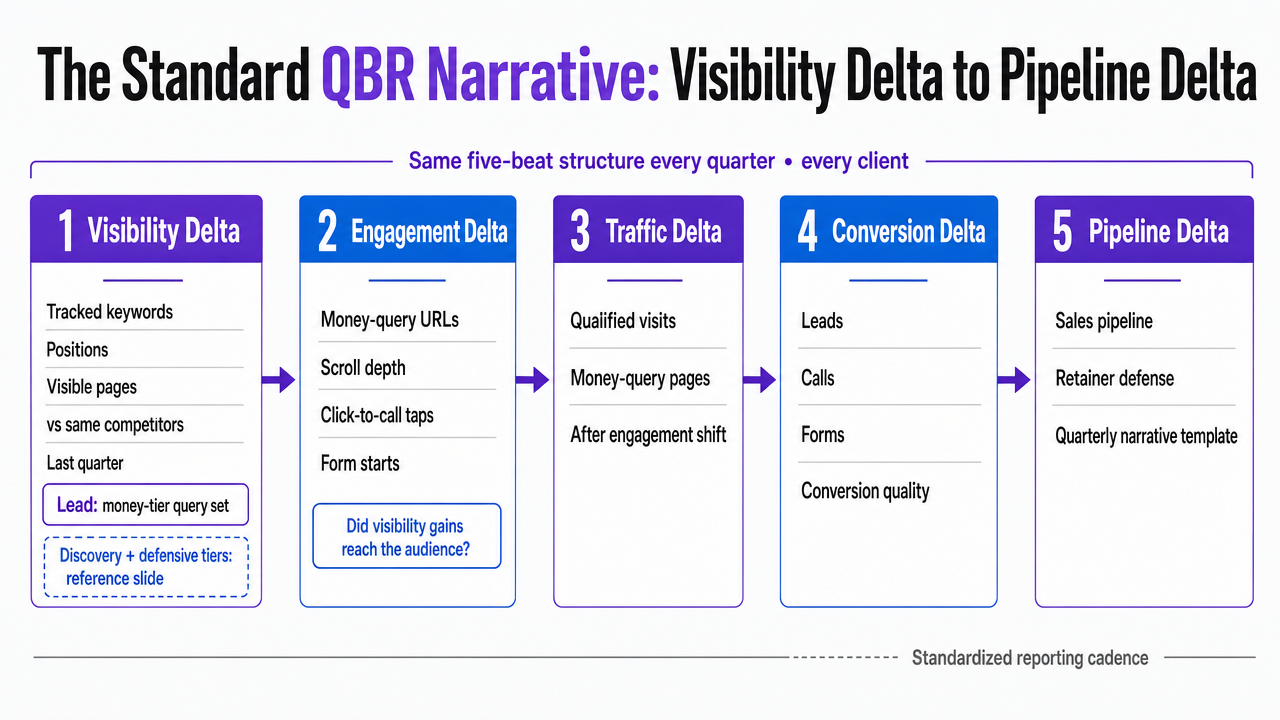 Diagram the five-beat QBR narrative structure as a left-to-right sequence, reinforcing the section's standardized reporting cadence
Reporting in Regulated Verticals: Behavioral Health, Healthcare, and Legal
The measurement stack tightens in verticals where the intake itself is regulated. Behavioral health analytics research is direct about the constraint: prospective patients find and engage with services online, but measurement has to respect privacy and ethical boundaries that consumer verticals never face 10. That is not a footnote for the delivery team. It changes what the monitor is allowed to hand off to analytics, what the analytics package is allowed to send to the CRM, and what the QBR slide is allowed to display.
The practical adjustments are specific. Money-query URLs in behavioral health and healthcare accounts strip PHI from event payloads before conversion data reaches the reporting layer, which means the agency lead reports aggregate booked outcomes — admissions, assessments, appointment requests, portal registrations 6 — rather than individual session traces. Healthcare SEO work carries a second constraint: visibility gains have to be checked against content quality, because optimizing for rank without accuracy can amplify low-quality information on clinical queries 5. The QBR slide names the content-audit cadence alongside the ranking gains.
Legal accounts add attorney-advertising rules that vary by state bar. The reporting stays outcome-oriented — qualified intakes, conflict-cleared matters — with query-level detail withheld from external decks when disclosure would strain compliance review.
See How Real-Time Keyword Monitoring Quantifies Your Agency’s ROI
Request a walkthrough of automated keyword monitoring and reporting workflows proven to demonstrate SEO impact across client portfolios—no additional analyst hours required.
If the Agency Runs a Portfolio: Reporting Economics at 25, 75, and 150 Clients
The single-client reporting model collapses somewhere between the 30th and 40th account. What worked as a bespoke QBR narrative for a boutique roster turns into an analyst-hours problem the moment the delivery team is defending retainers across a portfolio. This section shifts scope from one client to the book.
The economics are governed by three variables:
H : the analyst hours required to produce one client's monthly keyword-to-ROI report
C : the number of clients in the book
R : the fully loaded hourly rate of the analyst producing the report
Monthly reporting cost is H × C × R. Under a manual model — pulling rank exports, joining them by hand to analytics events, reconciling CRM outcomes, and rebuilding slides per client — H tends to sit between 4 and 8 hours per client per month once QA and revision cycles are counted. Under a standardized model where the five-beat QBR narrative, the query-tier tagging, and the visibility-engagement-conversion joins run on a shared reporting layer, H compresses toward 1 to 2 hours per client for review and client-specific commentary.
| Book size (C) | Manual monthly hours (H=6) | Standardized monthly hours (H=1.5) | Hours reclaimed |
|---|---|---|---|
| 25 clients | 150 | 37.5 | 112.5 |
| 75 clients | 450 | 112.5 | 337.5 |
| 150 clients | 900 | 225 | 675 |
Monthly analyst hours to produce keyword-to-ROI reporting across a portfolio, expressed as H × C. Multiply the reclaimed hours by R to size the operational impact against the agency's own loaded rate.
Professional-services measurement research argues that siloed reporting — SEO metrics detached from CRM and financial indicators — drives misguided strategic decisions, and that integrated scorecards aligning visibility with client acquisition and revenue outcomes are what let agencies discuss ROI credibly 9. At 25 clients, a Head of SEO can brute-force integration through discipline and templates. At 75, the manual path starts consuming a full analyst FTE just for reporting production. At 150, the manual path either forces a hire or degrades the reporting itself. Standardizing the join between the monitor, the analytics package, and the CRM is the only path that scales without either outcome.
Wiring the Monitor Into Prioritization, Forecasting, and Client Defense
The keyword monitor stops being a reporting artifact once it feeds three separate workflows, each with its own output and its own audience. Prioritization is the internal one: the visibility layer's weekly deltas rank the delivery team's next sprint, with money-tier losses jumping the queue over discovery-tier gains. The monitor tells the strategist which URLs to touch this week. It does not tell the client anything yet.
Forecasting is where the monitor earns its second job. When the query-tier tags, engagement benchmarks, and conversion rates from the revenue layer are joined on the same query-to-URL map, the delivery team can model expected booked outcomes from a projected position shift on a defined query set. A 40-location DSO chasing three positions on "dental implants [city]" across 12 markets carries a forecastable range of new-patient appointments, not a rank guess. Search performance research is direct that position alone is an incomplete effectiveness signal and that user-centric outcomes have to be layered in for the forecast to hold 2.
Client defense is the third job, and it runs on the five-beat QBR narrative already standardized across the book. The monitor supplies beat one and the raw input to beats four and five 9. That is the wiring an agency lead — and, increasingly, an AI execution layer like Vectoron — industrializes to defend retainers without adding analysts.
Frequently Asked Questions
References
- 1.Methodological Guidelines for Systematic Assessments of Websites: The Role of Web Analytics.
- 2.Search engine Performance optimization: methods and techniques.
- 3.Google Medical Update: Why Is the Search Engine Result Page So Different?.
- 4.Applying Website Rankings to Digital Health Centers in the Czech Republic: An Evaluation of Online Presence.
- 5.Search Engine Optimization in Healthcare: Strategies to Improve Visibility of Health Information.
- 6.Digital Marketing Metrics and Analytics in Healthcare Organizations.
- 7.Search Engine Optimization and Online Visibility for Dental Practices.
- 8.Digital Marketing Effectiveness in Home Healthcare Services.
- 9.Performance Measurement in Digital Marketing for Professional Services.
- 10.Analytics‑Driven Marketing in Behavioral Health Services.