
Key Takeaways
- Position-only tracking misleads because SERP composition, device mix, and branded queries each absorb or inflate clicks in ways a single rank column cannot expose 11.
- A defensible measurement stack layers three joins: intent and feature tagging on each keyword, device- and appearance-segmented CTR, then Search Console linked to Analytics for conversion outcomes 1.
- The November 2025 branded filter and the Search Analytics API's 10-day hourly window let pods separate demand capture from demand creation and diagnose regressions the same day 5, 7.
- Multi-location portfolios need per-location non-branded segmentation before rollup, since local CTR follows a distinct distribution shaped by map pins, reviews, and distance rather than blue-link curves 18.
When Four Positions Gained Meant Eighteen Percent Fewer Calls
A regional personal-injury firm's pod lead opened the Monday dashboard and saw what should have been a good quarter. Average position across the tracked keyword set had improved from 7.2 to 3.1. Non-brand impressions were up. The weekly rank export, screenshotted into the QBR deck, told a clean story of progress.
Qualified inbound calls, measured through the client's intake system, had dropped 18% over the same window.
The mechanism was hiding one layer beneath the ranking column. Three of the firm's highest-intent queries had shifted from a classic ten-blue-link layout to a SERP crowded with an AI Overview, a local pack, and a People Also Ask stack. The firm's page moved up in rank, but the clickable surface above it grew faster than its position gained. Research on SERP features confirms this pattern: ranking position remains the primary predictor of CTR, but rich results and AI-generated features can meaningfully reduce clicks on classic organic listings even when rank holds or improves 11.
This is the failure mode agency heads are asked to explain in front of a client who reads their own call log. Position-only tracking treats the SERP as static and the click as automatic. Neither assumption survives contact with a 2026 result page. What follows is a measurement model built to hold up in that room, not on a slide.
Why Position-Only Tracking Decoupled from Revenue
SERP Composition Now Absorbs the Click Before Rank Matters
A single ranking column implies a single kind of result page. The 2026 SERP rarely cooperates with that assumption. Recent composition research shows that intent class now drives which features dominate the visible surface:
- Informational queries pull in AI Overviews, People Also Ask stacks, and other data-rich elements;
- Navigational queries surface navigation-facilitating modules;
- Transactional queries lean toward commercial and decision-supporting elements like product carousels, local packs, and shopping units 12, 16.
That distribution matters because ranking position remains the primary predictor of CTR, but SERP features can meaningfully reduce clicks to classic organic results even when the underlying rank holds or improves 11. A page can move from position five to position two on a keyword that quietly picked up an AI Overview and a local pack, and the click volume it earns can fall rather than rise.
Pod leads reviewing keyword lists tend to see a column of numbers. What they need instead is a composition tag next to each keyword: which features occupy the top of the page, and which intent class the query falls into. Without that layer, weekly rank changes describe the wrong surface.
The Device-CTR Divergence That Blends Away in Weekly Reports
The industry-standard CTR curve most agencies quote in QBRs was built on desktop-heavy data from an earlier SERP. It no longer describes the click behavior of a client's actual audience.
A 2024 peer-reviewed study estimating CTR by position across devices found position one at 9.28%, position two at 5.82%, and position three at 3.11% in Google organic results 15, 19. Those figures are meaningfully lower than the legacy curves still circulating in agency decks. The study's scope matters: it measured aggregate CTR from clicks and impressions data in Google organic listings, and it found that desktop CTR declines steadily by rank while smartphone CTR drops rapidly through the early positions and then rises again after position 13 15. Tablet behavior sits somewhere between the two.
A weekly rank report blends those devices into one average. A client whose traffic is 78% mobile does not experience the desktop curve, and the same position gain produces a different click yield depending on which device dominates the query.
The operational fix is straightforward. CTR forecasts and traffic projections belong in device-segmented form, pulled from Search Console's device dimension rather than modeled from a single blended curve 4. When a pod lead is asked why a rank improvement did not lift qualified traffic, the device split is usually where the answer sits.
Branded Queries Inflating the Aggregate
The third distortion is more familiar but rarely corrected in reporting. Branded queries carry high CTR at nearly any position because searchers already intend to reach a specific site. When branded and non-branded traffic sit in the same aggregate, average position and average CTR both look healthier than the non-branded work the retainer is actually paying for.
Google's branded queries filter in Search Console, introduced in late 2025, addresses this directly. The filter applies to impressions, clicks, average position, and CTR, and it can isolate branded or non-branded segments across each dimension 7. That splits demand capture from demand creation in the same report clients already recognize.
The reporting consequence is concrete. Non-branded position and CTR describe the work of earning new audiences. Branded position and CTR describe the work of not losing audiences that already know the client. Blending the two into one line hides both. Pod leads who separate the segments in every recurring report stop defending numbers that mix a paid brand campaign's downstream capture with the organic team's actual gains.
A Three-Layer Measurement Stack Pod Leads Can Defend in a QBR
Layer One: SERP Composition and Intent Class Tagging
The first layer sits upstream of any click math. Before a pod lead can forecast traffic from a rank change, the keyword needs two tags: which features occupy the top of its SERP, and which intent class the query belongs to.
Composition research groups SERPs into recognizable patterns by intent. Informational queries pull in AI Overviews and People Also Ask modules and other data-rich elements. Navigational queries surface site links and navigation-facilitating modules. Transactional queries lean toward product carousels, local packs, and other commercial elements 12, 16. Each pattern displaces classic organic listings differently, and rich results can meaningfully reduce clicks on blue links even when rank holds 11.
The tagging work is not exotic. A keyword row gains two columns: intent class and dominant features. A ranking move on an informational query newly crowded by an AI Overview is not the same event as a ranking move on a transactional query with a stable ten-blue-link layout. The tags convert a rank change into a click-yield hypothesis a strategist can test rather than assume.
Layer Two: Device- and Appearance-Segmented CTR
The second layer replaces the blended CTR curve with two segmentations Search Console already supports: device and search appearance.
Device matters because desktop and smartphone click behavior no longer share a curve. The 2024 device-dependent CTR study cited earlier shows desktop CTR declining steadily by rank while smartphone CTR drops sharply through the early positions before recovering after position 13 15, 19. A pod lead forecasting traffic on a client whose query mix is 78% mobile cannot use the desktop curve as a proxy without introducing predictable error.
Search appearance matters because rich results carry their own click distributions. Google's appearance reports break out impressions, clicks, and CTR for review snippets, Special Announcements, and Google News listings, so pages earning those appearances can be measured separately from plain blue-link results 8, 9, 10. The Performance report already supports filtering by query, page, country, device, and search appearance, which lets the strategist build the segmented view without leaving the interface 4.
The output is a matrix, not a curve. Position, device, appearance type, and CTR sit together in one row per keyword, and forecasts stop averaging across categories that behave differently.
Layer Three: Post-Click Conversion Through Search Console and GA Linkage
The third layer is where the QBR argument closes. Rank and clicks describe what happened before the visit. Revenue lives after it.
Google's own documentation on combining Search Console and Google Analytics data connects search impressions and clicks with post-click engagement and conversion analysis on the same visits 1. Search Console supplies impressions, clicks, queries, and CTR, with CTR defined as clicks divided by impressions 1. Analytics supplies the downstream signals: sessions, engagement, form submissions, bookings, and revenue events tied to the same landing pages.
Linked correctly, the two datasets let a pod lead answer the question a client actually asks. Which queries produced clicks that converted, and at what rate. That view separates keywords that gained rank and produced pipeline from keywords that gained rank and produced bounce.
The three layers stack in one direction. Composition and intent set the click-yield expectation. Device- and appearance-segmented CTR translate rank into projected clicks. Search Console plus Analytics translate clicks into conversion outcomes. A pod lead who can walk a client through those three joins in order stops defending average position and starts defending revenue.
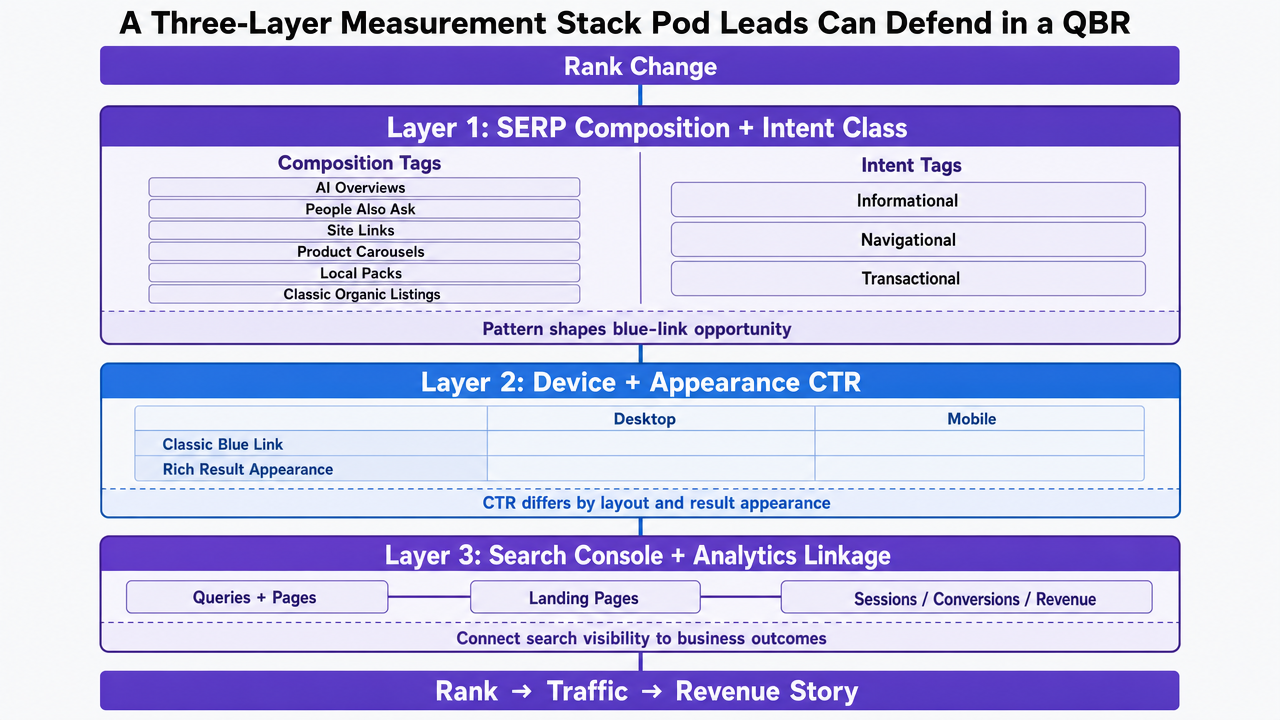 Visualize the three-layer measurement framework described in the section, showing how composition/intent, device/appearance CTR, and Search Console plus Analytics linkage stack to translate rank into revenue
Test enterprise-grade SERP tracking across real campaigns
Experience live keyword ranking insights on active client projects before committing long-term.
Operationalizing the Stack Through the Search Console API
Hourly Data, the 24-Hour View, and Faster Diagnosis Loops
The measurement stack becomes an operating tool only when pod leads can query it faster than clients can email about a ranking change. Two recent Search Console changes shorten that loop meaningfully.
The 24-hour performance view, introduced in late 2024, exposes clicks, impressions, average CTR, and average position at hourly granularity with only a few hours of delay 2. A title tag rewrite pushed on Tuesday morning no longer waits until Friday's data pull to show its click impact. The strategist can watch the hourly curve on the affected pages within the same working day.
The Search Analytics API extended the same capability programmatically in April 2025. The API returns hourly data for up to 10 days, while the product interface caps hourly views at the past 24 hours 5. That 10-day window is where the automation lives. A pod pipeline can pull hourly clicks and impressions by page and query, compare the launch window against the prior week's same-hour baseline, and flag regressions before the weekly report is even scheduled.
Faster feedback loops change what escalates. A rank drop that lasts six hours during a deployment window looks different from one that persists across three days, and the API now separates the two without waiting for daily aggregates to resolve.
The Branded Filter as a Reporting Backbone
The branded queries filter, added to Search Console in November 2025, is small in interface footprint and large in reporting consequence. It applies to impressions, clicks, average position, and CTR, and it lets a pod isolate branded or non-branded segments across each dimension 7.
Built into the recurring report structure, the filter becomes a backbone rather than a one-off view. Every performance table splits into two: one describing demand capture from users who already know the client, one describing demand creation from users who did not. Non-branded position and CTR become the honest measure of what the retainer produced. Branded metrics stay visible but stop inflating the aggregate.
The API supports the same segmentation, which means the split can be enforced automatically. A pod running twenty clients through one pipeline does not need an analyst to remember to apply the filter on each account. The query definition carries the segmentation, and the output arrives pre-separated. That removes a category of reporting error that used to surface only when a client asked why their branded search campaign appeared to be lifting organic performance.
Appearance-Specific Reports: Review Snippets, Special Announcements, News
Search appearance is the dimension most weekly reports flatten. Google's appearance-specific reports give pods a way to unflatten it without leaving the interface.
- Review snippet reporting exposes impressions, clicks, and CTR for pages earning that appearance, filterable by query, page, country, and device 8.
- Special Announcement markup gets its own report with the same metric set, useful for clients running time-sensitive notices where the appearance itself changes click behavior 9.
- Google News reporting isolates impressions, clicks, and CTR for sites surfacing in News, which is a materially different click environment from standard web search 10.
Retrieving these programmatically requires a two-step API pattern: first query to identify which appearance types the property earns, then filter subsequent queries by a specific appearance for detailed analysis 3. Once wired, the pipeline reports rank and CTR for each appearance separately rather than blending them into a single organic average.
The operational payoff is diagnostic. When a page's blended CTR drops, the appearance breakdown shows whether the review snippet lost eligibility, whether a news listing rotated out, or whether the plain organic result is simply competing against a heavier feature stack.
The Weekly Pod Workflow: What Automates, What Escalates
The three-layer stack earns its keep only when it maps to a repeatable weekly rhythm. Pods that try to run it as an ad-hoc analysis effort burn hours reproducing the same joins. Pods that codify the workflow reserve strategist time for judgment calls.
The automated layer runs before the strategist opens anything. A scheduled API job pulls the past seven days of clicks, impressions, average position, and CTR by page, query, device, and search appearance, then repeats the same pull with the branded filter applied and inverted 3, 7. A second job runs the hourly pull for any page shipped in the last ten days, comparing each hour against the same-hour baseline from the prior week 5. Regression thresholds fire alerts before Monday's standup, not during Friday's client call.
The strategist review layer sits on top of the automated output. Three questions structure the hour:
- which non-branded queries moved position without a matching click change,
- which pages lost CTR while holding rank, and
- which appearance types rotated in or out on high-intent keywords 4, 8.
Escalation is reserved for two triggers. A non-branded CTR decline on a converting page that persists beyond seventy-two hours moves to the client owner. A composition shift on a top-ten commercial keyword moves to content strategy for a page-level response.
If Pods Manage Multi-Location Portfolios
Local CTR Behaves Like a Different Curve
The measurement stack shifts when a pod moves from single-brand accounts to portfolios of DSOs, home-services franchises, or senior-living operators with dozens of locations under one parent. Blue-link CTR curves do not describe what those clients experience.
Local search research treats CTR on local results as a distinct instance of the classical CTR used in web search and online advertising, with its own predictors and click distribution 18. A dentist's location page competing inside a local pack faces a click environment shaped by map pins, review counts, and distance ranking, not by the ten-blue-link curve a pod lead might apply to the parent brand's national terms.
The reporting consequence is per-location. A portfolio pod tracking one blended CTR across forty locations loses the signal that matters. Non-branded local performance belongs in its own segment, separated from the parent brand's organic set and reported location by location before it rolls up.
Reporting Effort Per Location Across Three Operating Models
Portfolio economics decide whether the three-layer stack survives contact with forty or eighty locations. The variable that moves is analyst hours per location per reporting cycle, and it moves differently across three common operating models.
| Operating Model | Analyst Hours / Location / Month | Locations / Pod | Reporting Cadence | Diagnosis Speed |
|---|---|---|---|---|
| Manual rank tracker + spreadsheet rollup | High | Low | Weekly, lagged | Days to weeks |
| Rank tracker + BI tool | Moderate | Moderate | Weekly, semi-automated | Days |
| Search Console API pipeline with branded and appearance segmentation | Low | High | Continuous, hourly-capable | Same-day |
The first two rows scale linearly. Each additional location adds pull, clean, and format work an analyst repeats every cycle, and local CTR still gets modeled off a generic curve that does not match how local results behave 18. The API-driven model changes the slope. Once the query definitions include the branded filter and appearance dimensions, adding a location adds a property, not an analyst. Hourly data pulled through the Search Analytics API also compresses diagnosis: a regression on one location's map-pack visibility surfaces in the same ten-day window it happens rather than in next month's rollup 5.
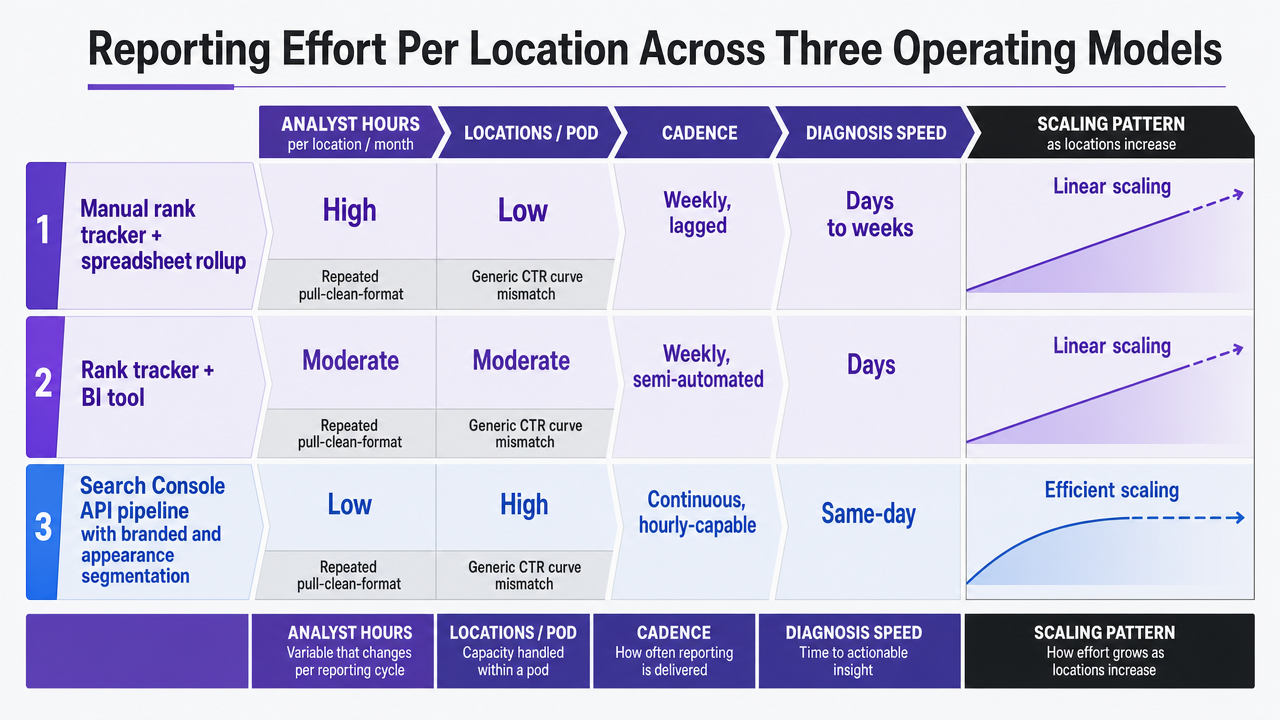 Reinforce the comparison table in the section by visualizing how the three operating models scale across analyst hours, locations per pod, cadence, and diagnosis speed
See How Leading Agencies Use Data-Driven SERP Tracking for Scalable Client ROI
Get a walkthrough of unified keyword SERP tracking solutions that surface real ranking shifts, automate opportunity tagging, and enable high-volume reporting—without adding headcount or sacrificing quality.
What Clients Actually See: The Insights Layer
The stack a pod lead defends internally is not the view a client scrolls through. Clients open one report, scan the top of it, and form a judgment about the retainer within the first minute. That surface is where Search Console Insights, now integrated into the main Search Console interface, becomes useful 6. It shows total clicks and impressions from Google Search against the prior period in a format that reads like an executive summary rather than a diagnostic tool 6.
The reporting pattern that holds up in a QBR treats Insights as the top of the document, not the whole of it. The strategist places the click and impression trend against the prior period at the top, then splits the same window into branded and non-branded segments using the November 2025 filter so the client can see demand capture and demand creation separately 7. Underneath that, the device-segmented CTR view and the appearance breakdown answer the questions that come up when a trend line moves 4, 8.
What the client sees first is the shape of the quarter. What the pod lead brings to the meeting is the mechanism behind it.
Closing the Loop Between Ranked Queries and Qualified Inquiries
The measurement stack ends at conversion events inside Analytics, but the retainer conversation ends somewhere else. Clients judge the quarter by the quality of the calls their intake team fields, not by the count of form fills a landing page recorded. That gap is where most keyword tracking programs still lose the argument, even after they add composition tags, device-segmented CTR, and Search Console plus Analytics linkage 1.
Ranked non-branded queries produce clicks. Clicks produce sessions. Sessions produce inquiries. What separates a qualified inquiry from a wasted one is legible in the call itself: the intent stated in the first thirty seconds, the service requested, the geography, the objection raised. Pods that tag calls against the query set that drove the session close the loop the QBR actually turns on.
Vectoron's call intelligence sits at that join, reading recorded calls against the ranked queries and landing pages that produced them so pod leads can defend not just position and click, but the qualified inquiries a retainer produced.
Frequently Asked Questions
References
- 1.Using Search Console and Google Analytics Data for SEO.
- 2.An improved way to view your recent performance data in Search Console.
- 3.Getting your performance data | Search Console API.
- 4.A deep dive into Search Console performance data filtering and comparison.
- 5.The Search Analytics API now supports hourly data.
- 6.The new Search Console Insights report is here.
- 7.Introducing the branded queries filter in Search Console.
- 8.New reports for review snippets in Search Console.
- 9.New reports for Special Announcements in Search Console.
- 10.Introducing Google News performance report.
- 11.Exploring the Impact of SERP Features on Organic Click-Through Rates.
- 12.A Study of Search Engine Results Pages Composition.
- 13.What Users See - Structures in Search Engine Results Pages.
- 14.Measuring the Utility of Search Engine Result Pages.
- 15.Device-dependent click-through rate estimation in Google organic search results based on clicks and impressions data.
- 16.Different Intents, Different Result Pages: A Study of Search Engine Results Page Composition.
- 17.Identification of Factors Predicting ClickThrough in Web Search.
- 18.Click Through Rate Prediction for Local Search Results.
- 19.Device-dependent click-through rate estimation in Google organic search results.
- 20.Organic Lead Generation Statistics for 2026: SEO, Content & Conversion Benchmarks.
- 21.Organic Traffic Growth Statistics for 2026: Channel Share, Industry Benchmarks & CTR Trends.