
Key Takeaways
- Build a commercial-intent inventory by extracting competitor-ranked queries, classifying them into the five-state taxonomy, and pairing the list with a content audit to expose weak pages worth refreshing before creating new ones.
- Audit every surviving query against the live SERP to catch intent mismatches and intent splits, ensuring content production only targets formats Google already rewards 4.
- Rank remaining gaps with a four-quadrant scorecard—Instant Wins, Strategic Gaps, Brand Defense, and Paid Gaps—so production capacity flows to queries where the SERP is vulnerable and organic ROI is realistic 5.
- Forecast pipeline before publishing using Monthly Search Volume × Conversion Rate × Average Deal Value on a ranked cluster, discounted for ramp-up, so finance can validate assumptions row by row 15.
- Attribute closed revenue with a W-shaped model that credits first touch, lead creation, and last pre-close touch at 30% each, tying closed-won deals back to the specific gap cluster that generated them 8.
Why gap analysis has become a revenue forecasting exercise
The economics of organic search have shifted, transforming keyword gap analysis from a mere SEO tactic into a critical component of demand generation forecasting. Organic search accounts for 44.6% of all revenue attributed to digital channels in B2B, significantly surpassing other channels6. This dominance means that every commercial-intent query a competitor ranks for, but a peer site does not, represents a measurable claim on future pipeline, rather than just a data point.
This reframing changes the nature of a keyword gap. It evolves from a simple list of missing terms into a ranked inventory of revenue-adjacent search demand that competitors are actively monetizing14. Each identified gap implies a potential conversion rate, a deal size, and highlights a competitor already capturing that traffic. Approached this way, gap analysis provides a forecast that finance teams can scrutinize before content creation begins, and a quantifiable contribution to defend after publishing.
The following five steps are designed to achieve this outcome. They progress from inventory creation to intent auditing, then to a four-quadrant prioritization, a revenue forecast, and finally, a W-shaped attribution model that withstands CFO scrutiny. The objective is not merely to produce more content, but to establish a repeatable process that predicts incremental pipeline before publishing and proves closed-revenue contribution afterward.
Reframing the gap: a ranked inventory of revenue-adjacent demand
Keyword gap vs. content gap: drawing the line before the workflow starts
Senior stakeholders often confuse keyword gap analysis with content gap analysis, which can derail scope discussions. A keyword gap analysis is narrowly focused on identifying specific queries competitors rank for that a domain does not3. Its output is a list of queries, rank positions, search volumes, and competitor URLs. In contrast, a content gap analysis is broader, examining topical coverage, entity coverage, search intent alignment, content depth, and how well existing pages address the entire buyer journey3.
This distinction is crucial because each analysis type triggers different work. A keyword gap indicates specific pages that need to be created or improved to rank. A content gap, however, points to the need for developing entire topic clusters, addressing specific journey stages, or building out entity relationships. Treating them interchangeably can lead to content briefs that task writers with solving broad topical authority issues through single blog posts, or forecasts that promise revenue from queries the site is not structurally prepared to win.
This five-step process prioritizes the keyword gap as the primary unit of operation, integrating content-gap findings during the intent audit phase. This sequence maintains a streamlined workflow, allowing for quarterly execution while still addressing the broader topical coverage issues that a pure query list might miss.
The five-state taxonomy that structures the inventory
Before any ranking or forecasting, every query in the competitive set is classified into one of five states1:
- Shared: Queries where both the domain and one or more competitors rank on page one. This is defensive territory.
- Missing: Queries competitors rank for where the domain has no position. This forms the core gap inventory.
- Weak: Queries where the domain ranks on page two or in the bottom half of page one, while competitors rank higher. These are candidates for content refresh.
- Strong: Queries the domain owns and competitors do not rank for. These are assets to protect.
- Unique: Queries the domain ranks for that no competitor in the set touches. This represents category-defining territory ripe for expansion.
This taxonomy is practical, not academic, as it dictates subsequent actions. Missing keywords feed the new-page content pipeline. Weak keywords are added to the refresh backlog, which typically has a different cost structure and a faster payback period. Strong and unique keywords are monitored but not rebuilt. Without this classification, every gap might be perceived as a new content brief, leading to an inflated forecast that exceeds the available production budget.
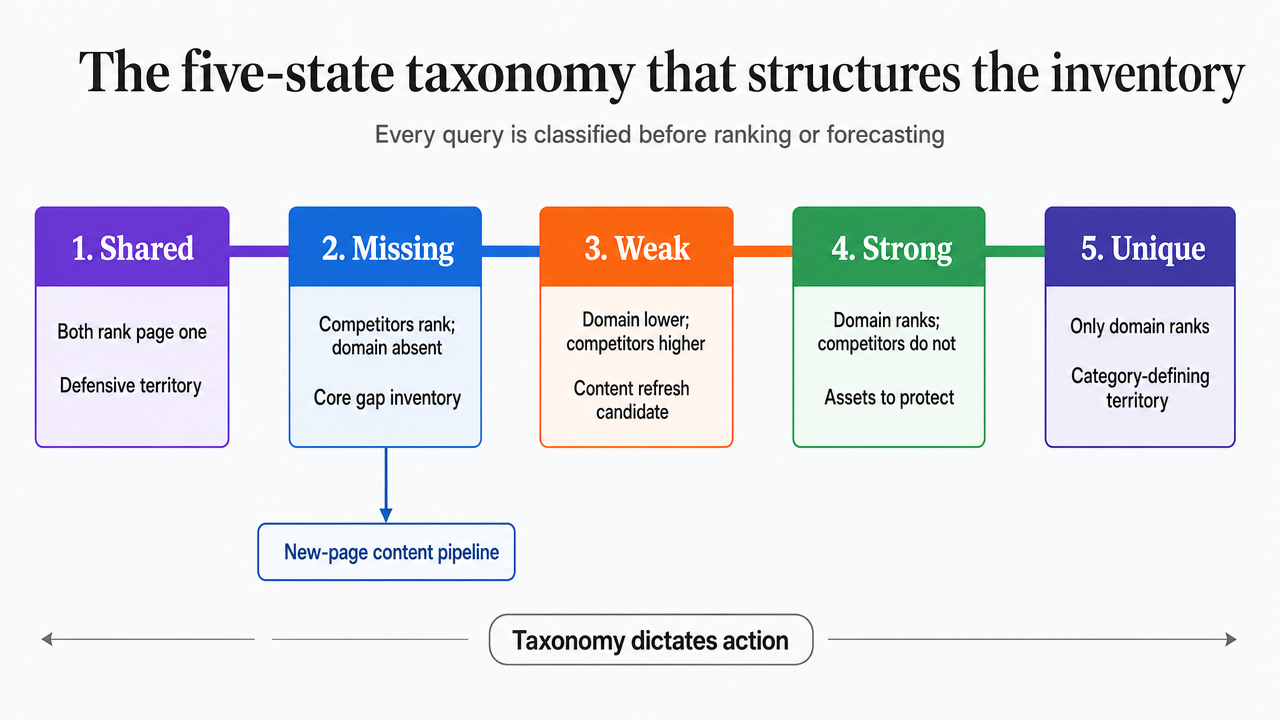 Visualize the five-state keyword taxonomy that structures the entire gap analysis workflow, since this classification system is the foundational framework referenced throughout the article
Step 1: Build the commercial-intent inventory
Extract competitor-ranked terms and classify them by state
The inventory begins with a competitive set that reflects the pipeline, not just the organizational chart. This includes direct product competitors, as well as review sites, comparison pages, and topical publishers that capture commercial queries earlier in the buyer's journey. Typically, three to seven domains are sufficient to identify a meaningful demand pool without diluting the analysis with irrelevant rankings.
From this set, extract every query where at least one competitor ranks within the top 20 positions. Then, apply the five-state taxonomy: shared, missing, weak, strong, unique1. Missing and weak rows are added to the working queue, while shared, strong, and unique rows are logged for monitoring but excluded from the prioritization stack. This step should be mechanical and swift, with interpretation reserved for later stages.
Commercial-intent filtering also begins here. Informational queries that lack a clear path to lead generation should be tagged and set aside, not deleted. They can inform topical authority decisions but are not included in a revenue forecast14. The result is a working inventory of queries competitors monetize, categorized by state, and ready for intent verification and scoring in subsequent steps.
Pair the inventory with a content audit to expose misalignment
A raw query list can overstate the opportunity. Pairing it with a content audit helps correct for existing pages that underperform and for topic clusters where the site has over-invested in queries that no longer generate leads10. For every weak-state row, the audit specifically asks: Is there an existing URL targeting this query, and if so, why is it failing to rank effectively?
Three common patterns emerge:
- pages built for informational intent ranking for commercial queries but failing to convert;
- pages targeting the wrong query variant within a cluster;
- or pages competing with each other for the same term, thereby splitting authority.
Each pattern suggests a different solution, with varying costs and timelines compared to creating net-new content.
The outcome of this pairing is a two-column inventory: missing queries that require new pages, and weak queries mapped to existing URLs that need refreshing, consolidation, or intent realignment. This distinction prepares the ground for the ranking step, where the cost-to-close becomes as important as the demand size.
Pinpoint and Close Your Most Profitable Keyword Gaps
Identify missed keyword opportunities and publish data-backed content that drives measurable pipeline impact in one week.
Step 2: Audit intent against the live SERP
Automated intent labels from keyword tools are merely a starting point. The only reliable indicator of what a query truly rewards is the live Search Engine Results Page (SERP) itself4. Before any missing or weak row from the inventory is included in the forecast, the SERP must be manually reviewed to understand what Google is currently serving.
Two primary failure modes often surface during this audit. The first is an intent mismatch: a query tagged as commercial by a tool, but whose top ten results consist entirely of definitional posts, glossary entries, or vendor-neutral explainers4. Ranking for such a query would require either an informational page that won't convert or a commercial page that won't rank. In either scenario, the query is removed from the revenue forecast and moved to a topical-authority queue.
The second is an intent split, where the SERP displays a mix of two or three formats—for example, a comparison page, a product page, and a forum discussion. This indicates that the query serves multiple purposes. These rows remain in the inventory but are flagged for a decision during the ranking step: either choose one intent to compete for, or skip the query and reallocate resources.
The audit produces a narrower, but more defensible, list. Every surviving row includes a verified intent tag and a format directive that aligns with what the SERP already rewards, ensuring content production is aligned with user behavior measured by Google11.
Step 3: Rank gaps with the four-quadrant scorecard
Sorting by raw volume is a quick way to exhaust a production budget on gaps that won't yield results. A more effective ranking process evaluates the remaining inventory across three dimensions: competitive performance, business value, and technical feasibility5. Each row is then assigned to one of four quadrants, which dictates the work order and expected payback period.
Instant Wins are queries with high commercial intent, low-to-medium keyword difficulty, and weak competitor positions in the top ten5. These are prioritized because the SERP is already vulnerable. They often include product-modifier queries and mid-funnel comparison terms where incumbents have thin or outdated content.
Strategic Gaps are queries with medium-to-high commercial intent and medium difficulty where the domain does not rank at all5. While payback is slower, these queries form the foundation of topical clusters that make Instant Wins sustainable. Neglecting them can lead to short-term ranking spikes that diminish within two quarters.
Brand Defense involves queries where competitors rank for the domain's category terms, product names, or category-plus-alternative constructions. These efforts protect existing pipeline rather than expanding it, so they are scheduled based on production capacity rather than being prioritized ahead of other initiatives.
Paid Gaps are high-intent queries where the SERP is dominated by ads, and organic real estate is limited. These queries are moved out of the content forecast and into a paid media discussion, preventing the SEO backlog from being burdened with work that won't achieve organic ROI thresholds.
Scoring each row on these three axes and assigning it to a quadrant transforms the inventory into a sequenced backlog. Instant Wins are executed first, Strategic Gaps are added to the roadmap, Brand Defense fills capacity gaps, and Paid Gaps are removed from the SEO forecast. This sequencing makes the subsequent revenue forecasting step credible to finance teams.
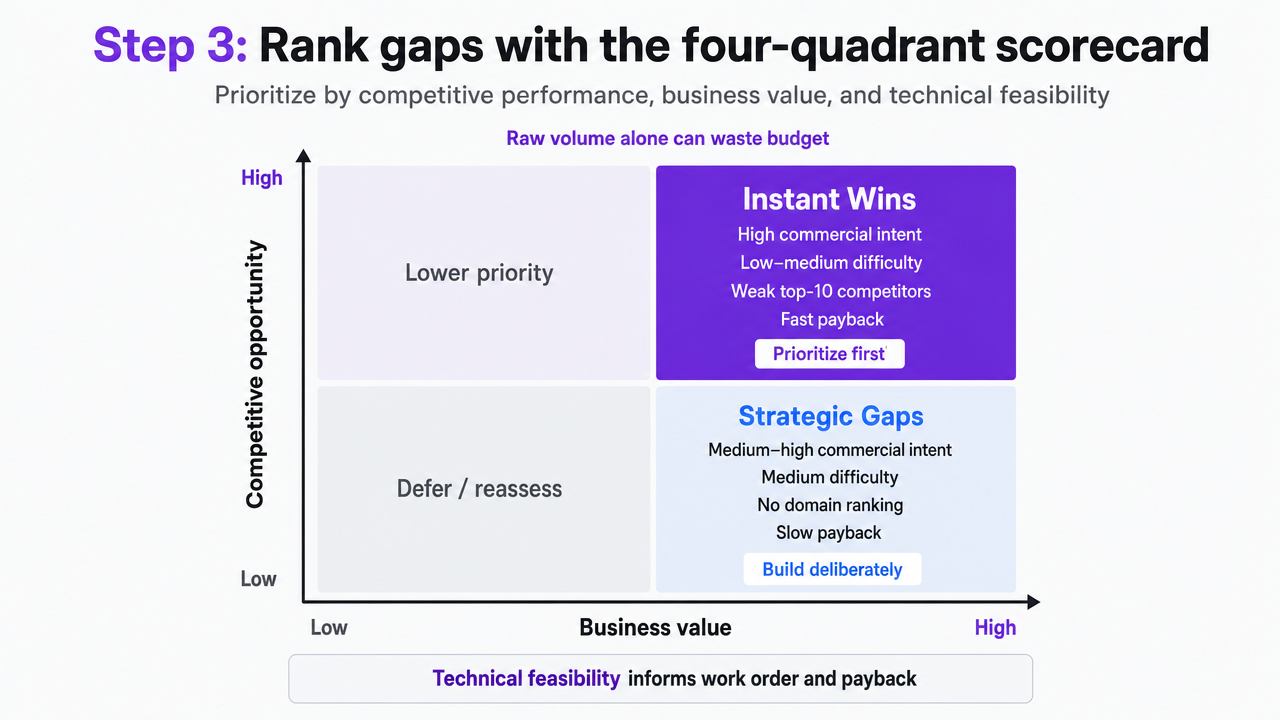 Visualize the four-quadrant prioritization scorecard cited from source 5, which is the central decision framework of Step 3
Step 4: Forecast incremental pipeline before publishing
The MSV × CVR × ADV formula, applied to a ranked cluster
A revenue forecast that withstands finance scrutiny relies on three key variables: Monthly Search Volume (MSV) × Conversion Rate (CVR) × Average Deal Value (ADV) = Monthly Revenue Opportunity15. While the number for a single query might seem speculative, applying this formula to a ranked cluster from the Instant Wins quadrant provides a defensible pipeline estimate before any content brief is written.
Consider a cluster of eight commercial-intent queries identified during the ranking step, with a combined monthly search volume of 4,200. Assuming a page-one click-through rate of 30% for the target position, a landing-page conversion rate of 2.5%, and an average deal value of $12,000, the calculation yields 4,200 × 0.30 × 0.025 × $12,000, resulting in approximately $378,000 in monthly revenue opportunity at maturity. This figure is then discounted for ramp-up: typically, quarter one captures 10-20% of the steady-state as rankings mature, quarter two 40-60%, and quarter three approaches the full run rate.
Two practices enhance the credibility of this forecast. First, the conversion rate should be derived from the actual landing page template being deployed, not a blended site average that combines homepage and blog traffic. Second, the deal value should be segmented by the intent tier of the cluster, as bottom-funnel queries convert to different Average Contract Values (ACV) than top-funnel comparisons. Companies that consistently apply this process report 40-60% organic traffic lift within six months, with conversion rates improving faster than volume due to precise intent alignment9.
Refreshing weak keywords: the underrated forecast input
The refresh backlog often yields better forecast results than the new-page backlog, yet it frequently receives less attention. Weak-state queries already have an existing URL, internal links, and a crawl history. Moving a page from position 14 to position 6 can capture a click-through rate increase that often surpasses what a new page achieves in its first two quarters.
The refresh input also offers a secondary benefit that should be credited in the forecast. Updating underperforming pages to align with current SERP intent can reduce bounce rates by up to 25%, which boosts the CVR variable in the formula even before search volume changes2. This means a refresh cluster with flat Monthly Search Volume can still show significant revenue lift in the forecast, as the conversion rate assumption legitimately increases.
Refresh rows should be forecasted with a shorter ramp-up curve than new pages, typically reaching 60-80% of steady-state within one quarter, and are priced against a lower production cost. This combination makes them the highest-ROI line item in most quarterly plans.
If you manage multiple locations: how a single gap compounds
This section is particularly relevant for operators managing multi-location businesses such as dental DSOs, home services, senior living, or multi-office law firms. For demand generation managers running single-domain B2B programs, this can be skimmed.
A single missing commercial-intent cluster does not remain isolated across a multi-location footprint. The same query pattern, when resolved with a city or neighborhood modifier, repeats across every market served. The forecasting formula expands by one variable: Monthly Search Volume × Conversion Rate × Average Deal Value × Number of Locations = Monthly Revenue Opportunity15. This compounding effect makes local gap work disproportionately valuable relative to production cost, as one content template and one topical model can support the entire footprint.
An illustrative example, using variables rather than specific benchmarks:
| Input | Assumption |
|---|---|
| MSV per location | 250 |
| Conversion rate | 2% |
| Average deal value | $3,500 |
| Locations | 20 |
| Monthly revenue opportunity | $350,000 |
It is crucial to substitute the operator's actual CVR from booking data and ADV from closed-won reporting before presenting these numbers. The key structural point is that a gap appearing marginal at one location becomes a headline forecast item once the footprint multiplier is applied, and the production cost per location decreases with each market added to the template.
Pinpoint Keyword Gaps That Directly Impact Pipeline Performance
Request a keyword gap analysis mapped to actual revenue data—see which missed opportunities could be driving higher-quality leads for your agency or enterprise brand.
Step 5: Attribute closed revenue with a W-shaped model
Last-click attribution often undermines the value of gap analysis in the eyes of a CFO. When a commercial-intent page ranks, a visitor lands, and converts three quarters later after a sales cycle involving demo requests, nurture emails, and partner referrals, the organic touchpoint often disappears from the report. This discrepancy causes the forecast from Step 4 to diverge from the actual revenue report, eroding the credibility of the entire process.
W-shaped attribution corrects this mismatch. In B2B SaaS environments with extended sales cycles, this model allocates 30% credit to the first touch, 30% to the lead creation touch, 30% to the last pre-close touch, and the remaining 10% is distributed across intermediate touchpoints8. Organic search resulting from a closed keyword gap almost always functions as a first touch or a lead creation touch, sometimes both, and the W-shaped model highlights this contribution instead of obscuring it.
The 30/30/30/10 split is defensible in financial discussions. Sales leaders acknowledge the significant credit due to the last pre-close touch (e.g., a demo request or direct sales conversation). Marketing leaders receive credit for initiating the account's journey. The 10% residual acknowledges the role of nurturing, retargeting, and dark social without overstating their primary impact on the pipeline.
Two operational disciplines ensure the model's integrity. First, the scope must be clearly stated whenever the numbers are presented. W-shaped attribution is suitable for multi-touch B2B journeys with defined lead creation events; applying it to short-cycle transactional traffic would overstate organic's share8. Second, the reporting cadence should link each closed-won deal to the specific gap cluster that generated the first or lead creation touch, rather than attributing it to organic search in aggregate. This granularity allows a demand generation manager to report contribution at the cluster level and directly tie it back to the Step 4 forecast, row by row.
Real-world validation underscores the value of this effort. In one 2025 marketing program, organic search contributed 58% of closed revenue under a structured attribution model16. Such significant figures are credible only when the underlying attribution logic is transparent, which is precisely what W-shaped modeling provides to a skeptical finance team. Structured gap analysis combined with multi-touch attribution is also recognized by analyst frameworks as a hallmark of mature B2B SEO programs13.
Making the loop quarterly: governance, ownership, and cadence
The five steps only yield compounding benefits if executed on a consistent schedule. A one-off gap analysis produces a spreadsheet that quickly becomes outdated within a quarter, as competitor rankings shift, new SERP features emerge, and the intent behind commercial queries evolves with buyer behavior. Every keyword a competitor ranks for that a peer domain does not represents a lost customer acquisition opportunity, underscoring why this discipline should be part of every quarterly SEO cycle, not just an annual planning exercise14.
A quarterly cadence also aligns with the operational practices of advanced B2B SEO teams. Forrester's maturity framework identifies structured opportunity identification paired with incremental pipeline attribution as the differentiator between basic keyword targeting and mature, performance-driven programs13. Running this loop four times a year is what enables a team to cross that threshold.
Ownership must be clearly defined at each stage to prevent the loop from stalling. The inventory and intent audit are typically managed by an SEO analyst capable of interpreting SERPs at scale. The four-quadrant ranking is handled by the demand generation manager, as business value scoring requires pipeline context that an analyst may lack. The revenue forecast necessitates a finance partner to approve the CVR and ADV assumptions before they are presented to leadership. Attribution reporting falls to marketing operations, which manages the CRM fields essential for reconciling W-shaped credit to closed-won deals.
A practical cadence might involve: week one for inventory refresh and intent audit; week two for ranking and forecasting; weeks three through eleven for production and publishing against the Instant Wins queue; and week twelve for attribution reporting and next-quarter forecast reconciliation. Coordinating this schedule across SEO, content, operations, and finance is often where in-house teams encounter delays. This is where AI-coordinated execution platforms like Vectoron become invaluable, routing approvals, tracking ownership at each stage, and maintaining the quarterly cadence without requiring additional headcount.
What changes when the five steps run together
Executed in isolation, each step produces a familiar output: a keyword list, a SERP audit, a priority matrix, a forecast, or an attribution dashboard. However, when run as a continuous loop, they create a distinct demand generation operating model. In this model, every commercial-intent query enters the system with a projected pipeline number and exits with a quantifiable closed-revenue contribution that the finance team has already agreed to acknowledge.
The compounding effect of these steps is more significant than any single step. Instant Wins delivered in quarter one validate the forecasting methodology. Strategic Gaps built beneath them in quarter two transform these wins into durable clusters. By quarter three, the attribution model has enough closed-won data to refine the CVR and ADV assumptions in the Step 4 formula, moving them from estimates to observed values, thereby enhancing the accuracy of all subsequent forecasts.
This represents the shift that analyst frameworks describe when distinguishing mature B2B SEO programs from tactical ones13. The operational challenge lies in coordinating this loop across SEO analysis, content production, finance sign-off, and attribution reporting. This is precisely where platforms like Vectoron streamline approvals and ownership handoffs, ensuring the quarterly cadence is maintained without increasing headcount.
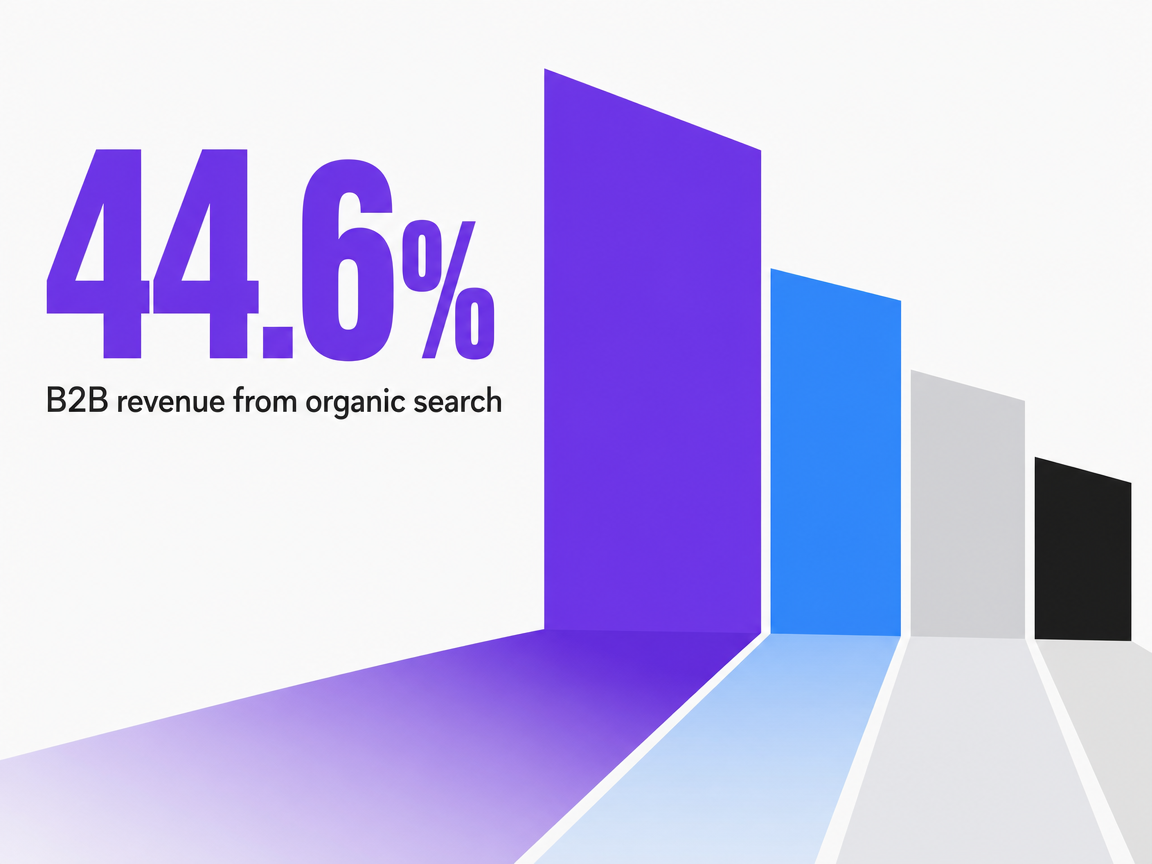 B2B revenue from organic search
B2B revenue from organic search
Frequently Asked Questions
References
- 1.Content Gap Analysis: Benefits and How to Get It Done.
- 2.Master Content Gap Analysis & Boost Traffic Now - Netco Design LLC.
- 3.Content Gap Analysis: Identify and Close High-Impact SEO Gaps.
- 4.Keyword Intent Mapping Simplified: A Strategic Framework.
- 5.Intent-Based Content Mapping.
- 6.B2B SEO Statistics: Data that is Shaping Industries.
- 7.38 Organic Growth and SEO Statistics for B2B Brands.
- 8.SaaS SEO ROI: How to Measure, Attribute, and Justify Investment to Your Board.
- 9.Content Gap Analysis: The Strategic Advantage B2B SaaS.
- 10.How to Use a Content Audit and Gap Analysis to Drive Results.
- 11.Understanding Search Intent to Drive Growth.
- 12.How Organic Search Impacts Business Performance.
- 13.The B2B SEO Maturity Model.
- 14.Keyword Gap Analysis: Definition, How to Run One 2026 ....
- 15.Content Gaps SEO Impact: Quantify Lost Lead Volume - PublishPuffin.
- 16.9.32x Marketing ROI Case Study | VTNH.