
Key Takeaways
- Revenue prediction requires three connected layers: lead scoring to filter quality, attribution to assign credit across touchpoints, and sales-marketing alignment to convert scored leads into worked opportunities.
- Grade techniques by both revenue contribution and attribution difficulty—paid search and gated content trace cleanly, while backlinks, SEO content, and direct mail need measurement investment, not budget cuts 6.
- Channel mix shifts force attribution model updates; a rule that worked when paid search dominated will misallocate credit once outbound, backlinks, or direct mail grow in share 15.
- Focus next on building a four-layer measurement spine—revenue, opportunity creation, scored leads, raw counts—so every channel-level metric ties back to pipeline a CFO can verify 9.
Why Lead Volume Stopped Predicting Revenue
Lead volume and revenue used to be closely correlated, but this is no longer the case. SaaS marketing teams often see MQL counts rise while pipeline contribution stagnates and customer acquisition cost (CAC) increases. This disconnect stems from a definition problem: counting leads measures activity, not the economic outcome that justifies marketing spend.
The U.S. Small Business Administration suggests a straightforward test: compare marketing and sales costs against the revenue generated by those activities 1. This ratio reveals a critical flaw in dashboards focused solely on lead volume. When both spend and revenue are dynamic, raw lead counts provide little insight into program effectiveness.
Three key factors have widened the gap between lead volume and revenue:
- First, lead quality has become highly variable due to diverse sources like gated content, intent platforms, and outbound lists.
- Second, attribution has become fragmented across multiple channels, making it difficult to pinpoint which touchpoints truly drive closed-won deals 6.
- Third, sales-marketing handoffs often result in conversion leaks as scored leads transition into opportunities 3.
This article examines lead generation techniques as inputs to a revenue equation, rather than a mere list of tactics. The focus shifts from generating the most leads to identifying techniques that, through effective scoring, attribution, and sales alignment, can be reliably converted into revenue.
The Revenue Connection System: Three Load-Bearing Components
Lead Scoring as the Filter Layer
Lead scoring is the initial critical point where a lead generation program either contributes to or detracts from revenue. Without it, all leads—from form fills to content downloads and outbound replies—are treated equally. This leads to sales teams wasting time on unqualified prospects and marketing teams optimizing for volume over value.
Research indicates that companies utilizing lead scoring can achieve up to a 70% increase in lead generation ROI 2. This figure represents an upper bound from academic literature, highlighting the theoretical potential rather than a guaranteed outcome. The authors emphasize that actual performance depends heavily on model quality and execution, not just the presence of a scoring field in a CRM 2. This suggests that the filter layer offers significant opportunities for ROI improvement.
The mechanism is simple: a scoring model ranks leads based on predicted fit and intent. This directs sales efforts toward prospects with the highest expected value and allows marketing to attribute revenue to the specific segments and techniques that generate these high-quality leads. Programs that neglect scoring often resort to measuring lead volume because it's the only readily available metric. In contrast, programs that invest in robust scoring can measure revenue per scored lead by source, technique, and campaign—a metric far more relevant for CFO reviews.
A common pitfall, as documented in the literature, is building scoring models on easily accessible rather than predictive data, and then failing to update them as the customer base evolves 2. A scoring layer requires continuous refinement, not a static setup.
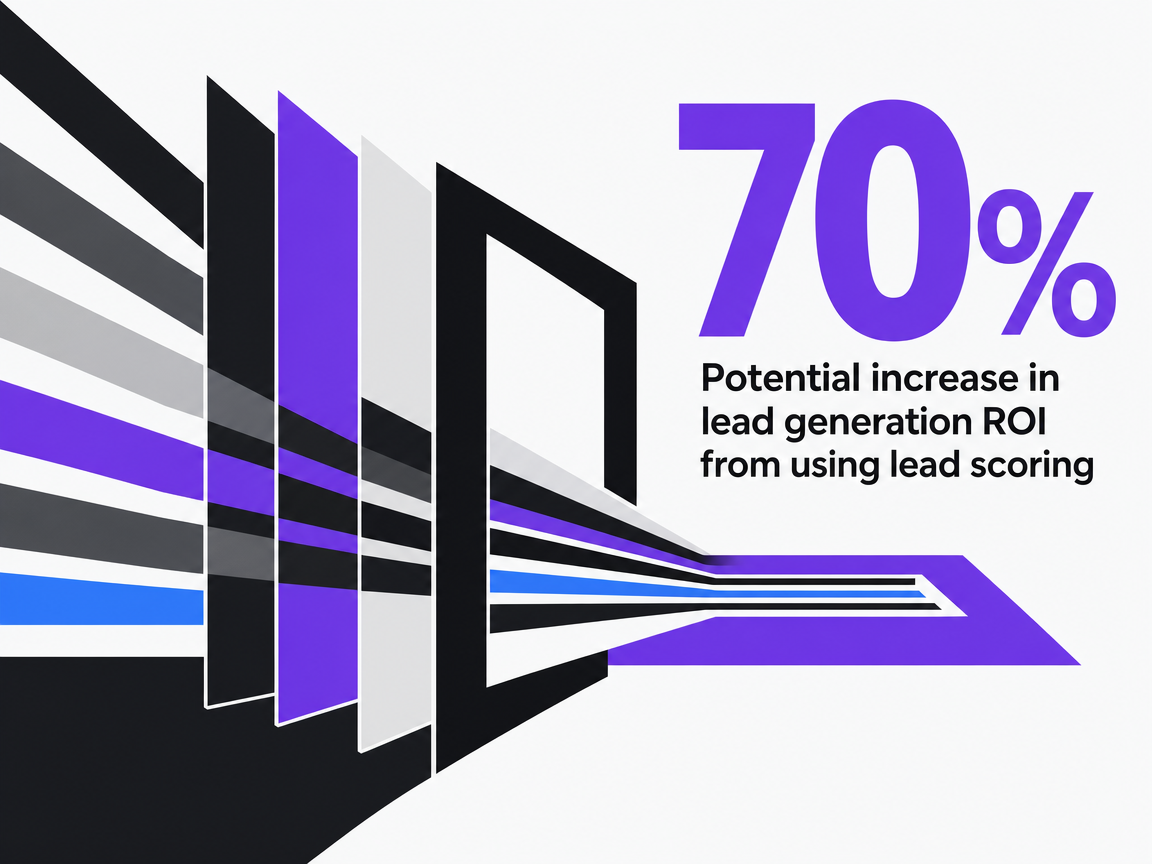 Potential increase in lead generation ROI from using lead scoring
Potential increase in lead generation ROI from using lead scoring
Attribution as the Credit Assignment Layer
Once leads are filtered, the next challenge is determining which marketing techniques contributed to closed deals. This is where many lead generation programs falter.
Attribution is a complex field. A Stanford analysis on pay-per-conversion advertising highlights that current attribution methods can lead to inefficient resource allocation, with simplistic rules like last-touch or first-touch systematically misrepresenting the credit due to each touchpoint 6. Similarly, a large-scale display advertising study from NYU Stern found that display advertising influences consumer behavior in ways not captured by single-touch attribution, suggesting that channels often categorized as brand spend can significantly contribute to acquisition 5.
For a SaaS marketing program employing paid search, SEO content, backlinks, and outbound efforts, the choice of attribution model directly impacts how revenue-accretive each technique appears. Last-touch models tend to favor paid and brand search, while first-touch models benefit top-of-funnel content. Linear models distribute credit more evenly but can obscure the true impact of specific touchpoints. No single model is universally correct, and the Stanford paper emphasizes that assuming otherwise leads to significant budget misallocation 6.
The practical approach is not to seek a perfect model, but to acknowledge the chosen attribution rule as a source of bias. Marketers should periodically compare results across multiple models to identify techniques whose perceived contribution varies significantly. A channel that ranks highly under one model but poorly under another warrants further investigation, often through holdout tests or geo-experiments. Attribution serves as the credit assignment layer because it involves assigning credit, and absolute exactness is unattainable.
Sales-Marketing Alignment as the Handoff Layer
Effective filtering and attribution are meaningless if the handoff between marketing and sales is inefficient. The third crucial component is the alignment between these two functions on lead definitions, follow-up protocols, and shared accountability for revenue.
A study in the Journal of Selling revealed that sales and marketing alignment correlates with improvements in lead conversion, customer retention, average account billing size, and overall revenue growth 3. This broad impact demonstrates that alignment is not merely a soft cultural factor but a structural element that directly influences key business metrics. The same study notes that disagreements over revenue credit often undermine this essential handoff 3.
Practical alignment involves concrete steps:
- A shared definition of Marketing Qualified Leads (MQLs) and Sales Qualified Leads (SQLs).
- Documented service level agreements for follow-up times.
- Regular reviews of qualified leads that were not pursued or pursued leads that were not properly scored.
- Both teams should also share a common revenue target, rather than separate lead and pipeline goals that can be met independently while overall revenue suffers.
This layer specifically ensures that a scored, attributed lead is converted into a worked opportunity at a predictable rate. This conversion factor allows marketing teams to forecast revenue from lead volume with credibility. Without it, the outputs of scoring and attribution models lose trust downstream, forcing the program to revert to reporting lead counts—the only metric both teams can agree on without extensive negotiation.
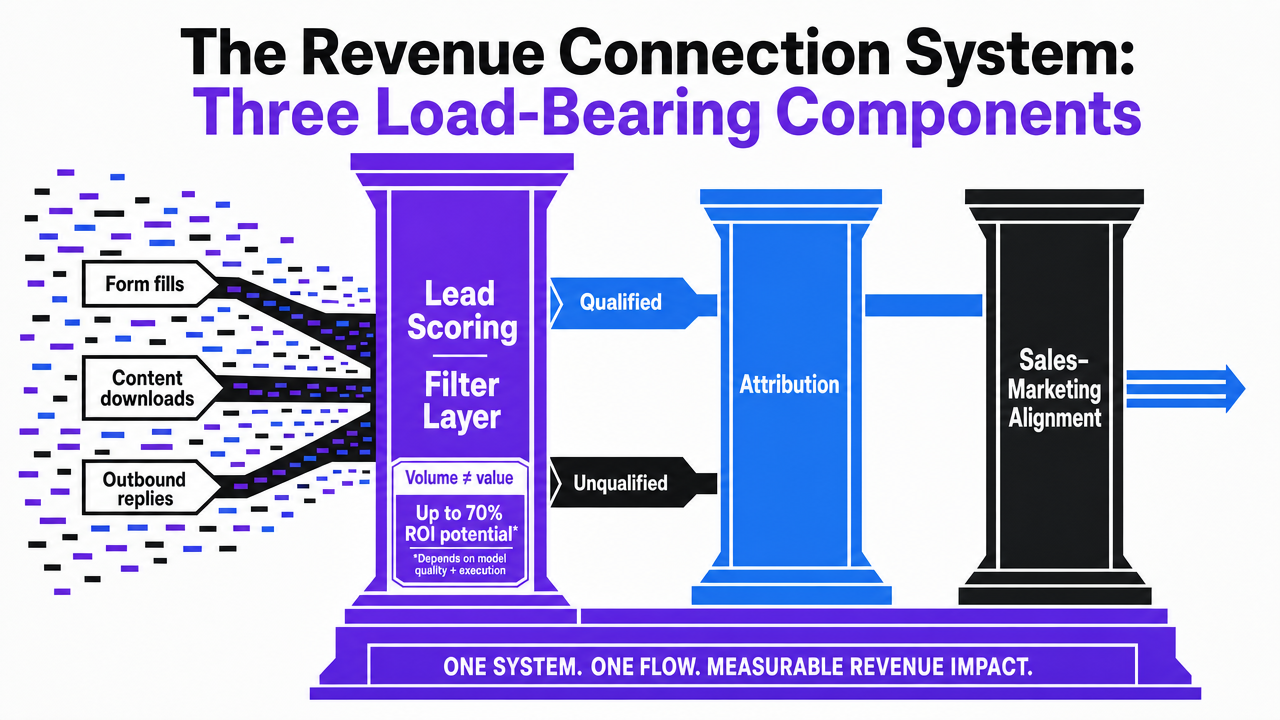 Process infographic showing the three load-bearing components (lead scoring, attribution, sales-marketing alignment) as a connected system, directly mirroring the section's structure
Grading Techniques by Revenue Attribution Difficulty
Lead generation techniques should be evaluated not just by popularity, but by their attribution difficulty. Some techniques yield leads whose path to revenue is relatively clear, while others contribute significantly but resist precise credit assignment. A sound budget allocation strategy must consider both the potential revenue a technique can generate and the ease with which that revenue can be traced.
Techniques with low attribution difficulty typically involve a discrete capture event and a short attribution window. Paid search, for example, generates a click, landing page visit, and form submission within a single session, which most analytics systems can easily track. Gated content with form capture creates a named record at the point of interest, allowing for measurable downstream conversion even with long sales cycles. Outbound replies and demo requests also provide clear initial identifiers that can be linked to subsequent touchpoints. While these techniques may not always be the most revenue-accretive in absolute terms, their data traceability makes them easier to justify in a CFO review.
Conversely, high-difficulty techniques have contributions dispersed across many touchpoints or lack clear initial identifiers. Backlinks, for instance, influence organic rankings, which then drive traffic that eventually converts through other mechanisms. SEO content designed for top-of-funnel queries often receives credit only at the final conversion, despite influencing consideration much earlier. Direct mail, despite being effective in digital environments as documented by MIT Sloan 7, presents attribution challenges due to the need to match offline sends with online conversions, a step often overlooked by SaaS teams.
The Stanford analysis on pay-per-conversion advertising explicitly states that current attribution methods can lead to inefficient allocation by overcrediting easily measurable channels and undercrediting harder ones 6. In a SaaS budget meeting, this means a VP who prioritizes techniques solely by reported revenue per lead risks defunding channels that quietly contribute to the pipeline. The optimal grading considers both revenue contribution potential and attribution difficulty. Techniques in the high-contribution, low-difficulty quadrant should be prioritized operationally. Those in the high-contribution, high-difficulty quadrant require investment in measurement, not budget cuts.
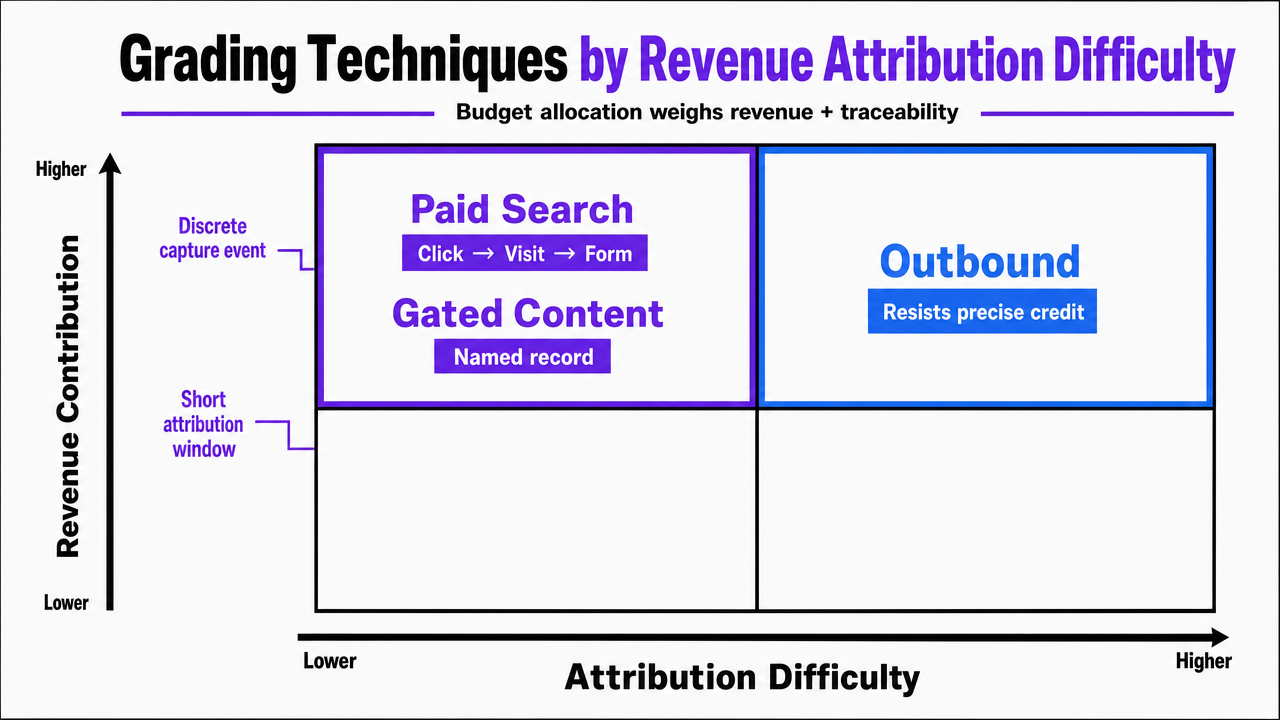 Two-by-two matrix infographic visualizing the section's explicit framework of revenue contribution versus attribution difficulty across lead generation techniques
Test Data-Driven Lead Generation in Real Time
Experience measurable lead generation outcomes with live campaigns and full reporting during your trial period.
Channel Mix Shifts and the Attribution Model They Force
Channel mix is dynamic, and the appropriate attribution model must evolve with it. When the primary lead source changes, the measurement system must adapt to ensure revenue numbers accurately reflect reality.
The pandemic provided a clear example of this on a large scale. A publicly traded lead generation company reported in its SEC filing that customers shifted marketing budgets from face-to-face events to online lead generation 15. This was more than a simple tactical swap. Events generated relationship-driven leads with minimal digital footprints, whereas online lead generation produced records with timestamps, sources, and trackable downstream behavior. A team using last-touch attribution would perceive online channels as dramatically more productive post-shift, even if total pipeline contribution remained constant, simply because the new channel mix was more amenable to digital attribution.
Similar dynamics occur with smaller, ongoing shifts. A SaaS team increasing investment in backlinks, launching a new outbound initiative, or reintroducing direct mail to enterprise accounts is altering the proportion of pipeline generated through attribution-friendly versus attribution-resistant channels. MIT Sloan confirms that direct mail remains effective in digital-heavy environments 7, meaning a budget shift towards it can generate measurable revenue, even if individual touchpoints are harder to track. An attribution rule effective when 90% of leads came from paid search will misallocate credit when that share drops to 60%. The discipline required is to re-evaluate the attribution model whenever the channel mix changes significantly, rather than adhering to an annual review cycle.
Lead Generation Inside the Customer Equity System
Lead generation is only one component of a comprehensive revenue system, not the entirety. Focusing solely on lead generation can lead to strong top-of-funnel metrics but weak overall revenue growth.
A Columbia paper on capturing marketing information for growth identifies three customer equity drivers: acquiring new customers, developing relationships with them, and retaining them over time 4. Lead generation techniques address only the first driver. Even the most efficient acquisition engine has a revenue ceiling if customer development and retention underperform, as new customers must first replace churned ones before contributing to growth. A SaaS program that doubles MQL volume while net revenue retention declines will not see sustainable improvements in pipeline metrics.
This is the strategic reason why lead volume can be misleading. A technique that generates high-fit leads who expand their product usage performs a fundamentally different revenue function than one that produces an equal number of leads who close small and churn quickly, even if both appear identical on an acquisition dashboard. Evaluating techniques against the entire customer equity system, rather than just the acquisition phase, reveals which channels attract customer segments that are likely to develop and be retained. These are the techniques that warrant scaling; others merely create activity without compounding value.
The Coordination Tax on Multi-Vendor Acquisition Programs
Most SaaS acquisition programs are built channel by channel, often involving multiple vendors. An SEO agency handles content and technical aspects, a paid search vendor manages Google Ads and social media, and a backlink firm focuses on link acquisition, with an in-house team coordinating. While each specialist performs competently within their domain, challenges arise in attribution and revenue traceability when these workstreams operate in separate accounts, with distinct reporting cadences and definitions of success.
Each vendor typically reports metrics that highlight their own contribution. The SEO vendor reports rankings and organic sessions, the paid search vendor reports cost per lead within the ad platform, and the backlink vendor reports referring domains. While these metrics are individually valid, none are directly denominated in revenue. This leaves a VP with multiple reports, each using a different attribution rule, struggling to provide a unified answer to a CFO's revenue-focused questions.
The Stanford analysis of multi-touch attribution is particularly relevant here, noting that current methods can lead to inefficient allocation by systematically distorting credit across touchpoints 6. Fragmentation exacerbates this issue. When each vendor employs its own attribution model, the program faces not one, but several layers of attribution bias, without a shared ledger to reconcile them. A lead that interacted with paid search, an organic blog post, and a backlink-driven referral could credibly appear as a win in all three vendor reports. This can lead to reported pipeline significantly exceeding actual pipeline without any intentional misrepresentation.
The structural comparison is stark: a fragmented program juggles three to five vendors, reporting interfaces, and attribution models, often requiring manual monthly reconciliation or none at all. In contrast, a unified, account-level program operates with a single execution surface, reporting cadence, and a consistent attribution model across all channels. The difference in revenue traceability is substantial, distinguishing between budget discussions based on a single source of truth and those mired in negotiations over conflicting numbers.
See How Unified Lead Generation Directly Impacts Revenue Growth
Request a walkthrough of data-backed frameworks that connect SEO, PPC, and backlinks to measurable pipeline gains—built for agencies and enterprise teams managing complex lead gen at scale.
Building the Measurement Spine: From Output Metrics to Revenue Outcomes
A revenue-connected lead generation program requires a logical framework that seamlessly links output metrics to outcome metrics. The U.S. Office of Management and Budget's approach to performance measurement is instructive: first define long-term outcome goals, then specify meaningful, measurable, output-oriented short- and medium-term steps explicitly tied to those outcomes 9. For a SaaS pipeline, this means starting with the revenue target and working backward to identify lead metrics with a defensible logical connection, rather than simply reporting whatever channel data is available.
Federal benchmarking on performance measurement emphasizes focusing on a critical few, narrowly chosen measures that track progress toward strategic goals 10. Most SaaS marketing dashboards fail this test, reporting dozens of channel-level metrics that often move independently of revenue. This can result in a quarter appearing successful across many metrics while pipeline contribution actually declines.
A functional measurement spine comprises four layers:
- At the top are revenue and net new pipeline by source.
- Below that, opportunity creation rate and SQL conversion rate, which highlight the efficiency of the sales-marketing handoff 3.
- The next layer is scored lead volume by segment, where the filter layer demonstrates its value.
- At the base are raw lead and traffic counts by channel, used for diagnostics but not as headline metrics.
Each lower layer feeds the one above it through a defined conversion rate, allowing changes at any level to be traced throughout the stack.
The discipline recommended by digital outreach guidance applies directly: establish KPIs early, maintain simple and consistent reporting, and continuously test rather than redesigning the dashboard every quarter 11. A measurement spine that withstands CFO scrutiny is one that remains stable, even as the channel mix fluctuates.
What Changes When the Connection Holds
When lead scoring, attribution, and sales-marketing alignment function cohesively, the marketing conversation fundamentally shifts. The primary metric moves from lead volume to revenue per scored lead by source, measured against spend, as advised by the SBA 1. Budget meetings transition from arbitrating conflicting vendor reports to working from a single, unified ledger. Techniques previously justified by volume metrics must now demonstrate their contribution to revenue or face reallocation.
The customer equity framework from Columbia clarifies the ultimate purpose of this connection: acquisition supports development and retention. A technique that generates leads who expand their usage and remain customers performs a different revenue function than one producing leads who churn quickly 4. A VP equipped with this measurement spine can confidently answer the CFO's crucial question that often ends lead generation debates: which dollar generated which deal, and which deal resulted in which customer. While attribution bias will still exist, vendor bias, definitional ambiguity, and volume-focused reporting will be eliminated. This represents a durable change and is a prerequisite for any further discussion about scaling the program effectively.
Frequently Asked Questions
References
- 1.Marketing and sales | U.S. Small Business Administration.
- 2.The state of lead scoring models and their impact on sales and marketing.
- 3.When Sales and Marketing Align: Impact on Performance.
- 4.Capturing Marketing Information to Fuel Growth.
- 5.Toward a Digital Attribution Model: Measuring the Impact of Display Advertising.
- 6.The Multiple Attribution Problem in Pay-Per-Conversion Advertising.
- 7.How Direct Mail Delivers in the Age of Digital Marketing.
- 8.GAO Testimony: Measuring Performance and ROI of Federal Advertising and Outreach.
- 9.Performance Measurement Challenges and Strategies.
- 10.Serving the American Public: Best Practices in Performance Measurement.
- 11.Webinar Recap: How to Measure Effectiveness of Your Digital Outreach and Communications.
- 12.Measuring Return on Investment in Health Communication Campaigns.
- 13.The development of the concept of return-on-investment from large ....
- 14.A Review of the Effectiveness of the Mississippi Development Authority.
- 15.Annual Report / 10-K.