
Key Takeaways
- Striking-distance pages in positions 4–20 behave like fixed-income assets because impression volume and CTR deltas are already visible in Search Console, making pipeline forecasts defensible with arithmetic rather than optimism.
- Sequence the backlog by page-two-to-page-one leverage first, since combined page-two clicks capture only about 0.78% while top-three positions concentrate the meaningful share 3.
- Build every client forecast as three parallel CTR scenarios—aggressive clean-SERP 1, current-benchmark working 2, and conservative device-adjusted floor 7—with the floor anchoring retainer commitments.
- Protect margin by holding the editorial line at intent validation and Needs Met checks 5, letting automation compress mechanical production while strategists govern prioritization and final sign-off.
Why Striking-Distance Rankings Are the Most Forecastable Asset in an Agency's SEO Portfolio
Every agency SEO director has stared at the same dashboard problem: a client wants to know what next quarter's organic pipeline will look like, and the honest answer for most of the keyword portfolio is a shrug. New content bets carry rank timing risk. Authority plays take quarters to compound. But pages already sitting in positions 4 through 20 behave differently. They have crawl history, existing intent signals, and a measurable CTR ceiling above them. That combination makes striking-distance rankings the closest thing an SEO portfolio has to a fixed-income asset.
The forecastability comes from arithmetic, not optimism. When a page is holding position 8, the cost to model its upside is a known impression volume multiplied by the CTR delta between its current slot and positions 1 through 3. Historical benchmarks put that top-three concentration at 28.5%, 15%, and 11% respectively 2, and current 2026 measurements place position 1 even higher on clean SERPs 1. The exact curve is a separate argument, addressed later. The point here is that the input variables are already sitting in Search Console.
For agency leadership, this reframes the strategy entirely. Low-hanging fruit SEO is not a beginner tactic or a monthly report filler. It is the segment of the portfolio where expected value can be defended with math a CFO will accept, which makes it the segment where production capacity should be concentrated first.
The Position Economics That Make the Strategy Work
Where the Clicks Actually Live in a 2026 SERP
The first argument to settle before any forecast leaves the agency is where clicks are actually landing on a modern results page. The 2026 benchmark data puts position 1 at roughly 39.8% CTR on a clean SERP, with steep declines beyond position 3 and CTR falling below 2% from position 6 onward 1. That curve is the reason striking-distance economics function at all. A page moving from position 8 into position 3 is not gaining a few percentage points of CTR—it is crossing the threshold where the SERP starts distributing meaningful click volume in the first place.
The complication is that the clean-SERP number no longer describes every query in a client portfolio. When an AI Overview is present, that same position 1 CTR collapses to about 19% 1. Roughly half the click share disappears above the fold before an organic link is ever considered. For an agency SEO director building a client-ready forecast, this is not a footnote. It is a required variable that has to be checked at the query level before an expected-value calculation is even attempted.
The practical workflow shift is straightforward. Any striking-distance list pulled from Search Console needs a second column indicating whether the target SERP currently shows an AI Overview, a featured snippet stack, or a clean ten-blue-links layout. Each of those layouts implies a different top-position CTR ceiling, and each of those ceilings drives a different pipeline number. A forecast that averages the two is a forecast that will miss in both directions—overstating pipeline on AI-Overview SERPs and understating it on clean ones. The layout audit is cheap. Skipping it is what makes striking-distance programs miss their number in the second quarter.
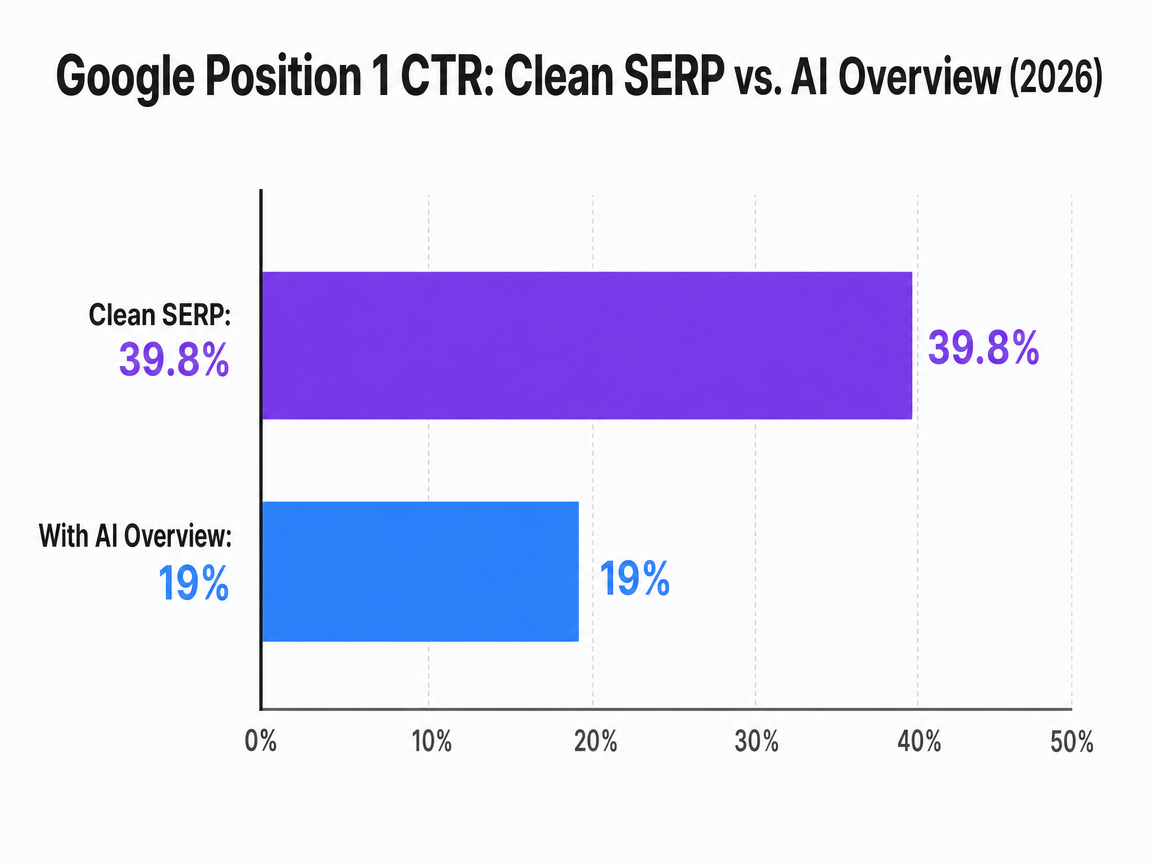 Google Position 1 CTR: Clean SERP vs. AI Overview (2026)
Compares the click-through rate for the first organic Google result on a standard Search Engine Results Page (SERP) versus one that includes an AI-generated overview. Useful for a bar chart.
The Page-Two-to-Page-One Leverage Argument
Not every position gain is a real gain. Aggregated 2026 CTR data places position 1 in the 39.8–43.3% range while all of Google page 2 combined captures approximately 0.78% of clicks 3. That single comparison rewrites how a striking-distance backlog should be sequenced. A page holding position 14 that moves to position 9 has technically improved by five slots, but it has moved from a fraction of a percent of clicks into another fraction of a percent. The client dashboard shows progress. The pipeline does not.
The leverage sits at the page-two-to-page-one boundary. Pages ranking in positions 11 through 20 are where the largest CTR delta per unit of production effort exists, because the receiving end of the move is the part of the SERP that actually distributes traffic. This inverts the instinct many junior analysts bring to a striking-distance report, which is to prioritize the highest current positions first because they look closest to a win.
For agency portfolio planning, the sequencing rule is more useful than the number itself:
- Pages holding positions 11–15 with clear commercial intent get worked first, because the CTR ceiling above them is the steepest gradient available in the entire portfolio.
- Pages holding positions 4–7 come next, where the move from mid-page-one into the top three still carries meaningful CTR gains but on a shallower curve.
- Position 2 to position 1 moves get worked last unless the query volume is exceptional, because the incremental CTR gain rarely justifies the production hours when other backlogged pages are still stranded on page two.
Three CTR Curves for Client Forecasts: Aggressive, Current, Conservative
The methodological disagreement between CTR studies is not a problem to solve—it is a feature to use. Three distinct curves exist in the peer-reviewed and benchmark literature, and each one has a defensible role in a client-facing forecast.
The aggressive scenario draws on 2026 clean-SERP benchmarks, with position 1 near 39.8% and steep drop-offs below the top three 1. This is the ceiling case, appropriate for queries where the target SERP is confirmed clean and the client's brand carries some recognition boost. The current-benchmark scenario draws on the widely cited historical study reporting 28.5%, 15%, and 11% for positions 1 through 3 2. That curve remains useful precisely because it has been replicated across methodologies for years, giving it defensibility in a stakeholder meeting where a newer number might invite a debate about sourcing.
The conservative scenario draws on the device-dependent study estimating position 1 CTR at 9.28%, position 2 at 5.82%, and position 3 at 3.11% 7. Those numbers are dramatically lower than the industry benchmarks because the methodology captures device-mix realities and blended SERP conditions that the cleaner studies filter out. For a first-year client relationship where the SEO director cannot afford a missed forecast, the conservative curve is the responsible floor.
The operational move is to build every client pipeline model as three parallel scenarios rather than one point estimate. The aggressive number frames the upside conversation. The current-benchmark number anchors the working forecast. The conservative number defines the commitment the agency will actually put in writing. That structure survives quarterly review meetings intact, which is more than most single-curve forecasts manage.
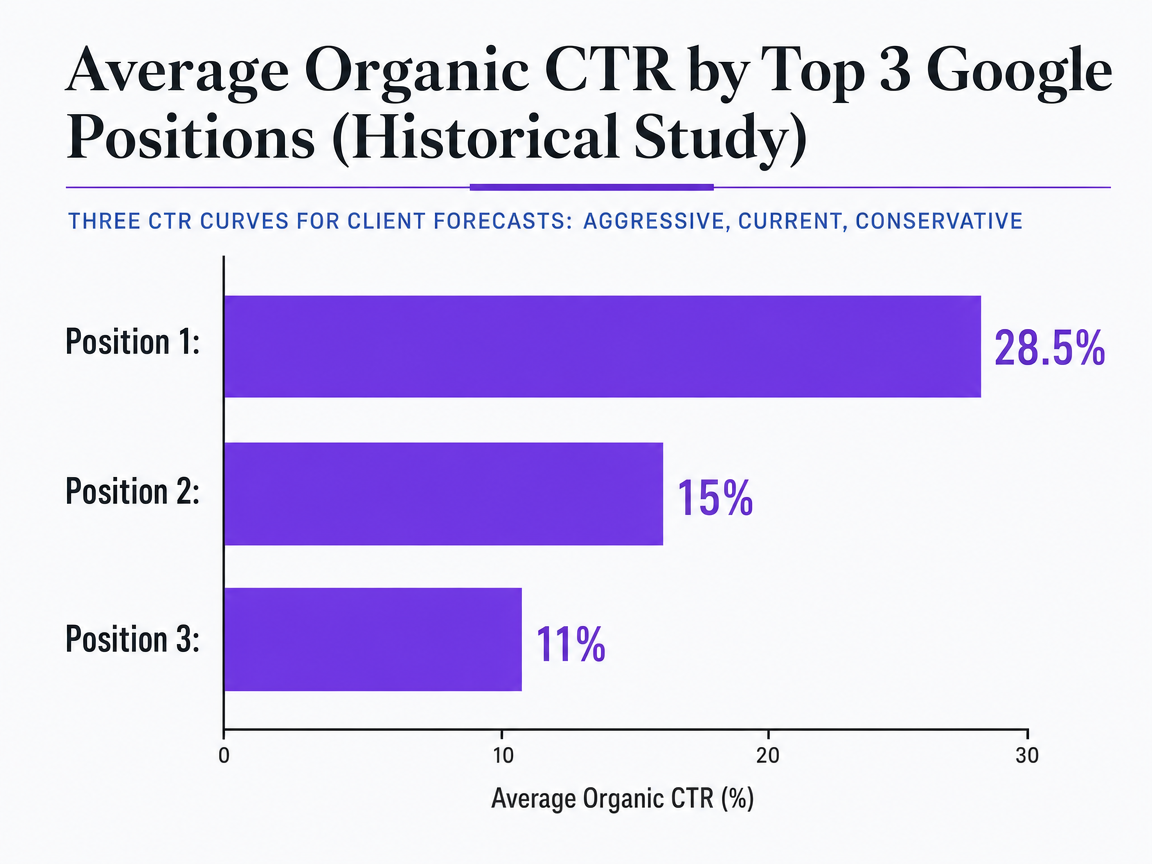 Average Organic CTR by Top 3 Google Positions (Historical Study)
Shows the average click-through rate for the top three organic positions in Google search from a widely cited historical study. Suitable for a bar chart to show the decline.
Identifying Striking-Distance Pages Without Drowning in Keyword Lists
The Position 4–20 Filter and the Revenue Tiebreaker
The mechanical part of striking-distance identification takes about twenty minutes per client account. Pull Search Console query data for the last 28 days, filter to pages ranking between positions 4 and 20, exclude branded queries, and set an impression floor that eliminates noise—typically 50 monthly impressions for a mid-sized service business, higher for national accounts. That produces a working list. It rarely produces a priority list.
The filter output for a typical multi-location service client tends to run somewhere between 200 and 900 URL-query pairs. No agency team is working 900 items. The list has to be cut by roughly an order of magnitude before production capacity gets allocated, and the criterion that does the cutting cleanly is downstream revenue relevance, not difficulty score or impression volume.
Terra HQ's guidance on the point is blunt: chasing rankings that don't tie back to the service or offering is a category of wasted effort no matter how easy the ranking is to earn 11. Applied to an agency backlog, the revenue tiebreaker means every striking-distance candidate gets tagged against a specific conversion pathway before it enters the sprint queue. A law firm page ranking at position 12 for a practice-area query with clear hiring intent goes above a page ranking at position 6 for an educational query that never books consultations, even though the position-6 page looks closer to a win on the dashboard.
The operational habit worth building is a two-column tag applied at filter time: current position and revenue-path relevance scored on a simple three-point scale. Everything scoring the top tier gets worked. Everything scoring the bottom tier gets archived, not deferred, because deferred lists become the graveyard of agency retainers.
Head vs. Tail: When Difficulty Score Is the Wrong Signal
Keyword difficulty is a useful heuristic that fails at the exact moment it matters most. The KD<20 threshold that dominates low-hanging-fruit tutorials will surface a clean list of easy targets, but a substantial fraction of those targets are easy precisely because the commercial intent behind them is thin. High-difficulty queries carry high difficulty because multiple well-funded competitors already recognized the revenue signal in the query and invested against it.
The more useful lens is the head-vs-tail distinction from search behavior research. Tail queries are substantially longer than top queries and carry more semantic information about what the searcher actually wants 9. That semantic density is what makes them convert. A user typing "emergency dental extraction near me open sunday" has resolved almost every ambiguity in the query itself, which is why tail queries often reflect later-stage decision behavior even when overall volume is modest 6.
For an agency backlog, this reshuffles the KD conversation entirely. A moderately competitive commercial-intent tail query in the KD 25–40 band frequently outperforms a low-difficulty informational query in the KD 5–15 band on any downstream metric that matters. The difficulty score is measuring the wrong thing—competitive investment in the ranking—rather than the thing the client actually cares about, which is qualified booking volume.
The working rule that survives portfolio pressure is to treat difficulty as a capacity signal, not a prioritization signal. It tells the strategist how many production hours a candidate is likely to consume. Intent and downstream conversion path determine whether those hours are worth spending. A KD-38 page that funds a consultation intake earns its production budget. A KD-12 page that funds nothing does not, no matter how quickly it would rank.
Intent Match as the Quality Gate
The pages that fail striking-distance programs almost never fail because the keyword research was wrong. They fail because the page in position 9 was built for a different query than the one the searcher is issuing, and no amount of on-page optimization closes that gap.
Google's Search Quality Rater framework treats Needs Met as an assessment of whether the result satisfies the intent behind the query as interpreted from the query and location 5. That framing maps directly onto how a striking-distance audit should run. Before a page is queued for optimization, the strategist confirms three things:
- the dominant intent of the target query,
- the intent the current page actually serves, and
- whether the delta between them can be closed with revision or requires a new asset.
Google's helpful-content guidance reinforces the same point from the production side—automated ranking systems prioritize content created to benefit people, not content engineered to manipulate rankings 4. A page holding position 11 for a transactional query while offering informational content is not a striking-distance opportunity. It is an intent mismatch that will cap out below the top three regardless of how much link equity or on-page tuning gets applied to it.
The gate is binary: matched intent or documented rebuild. Everything else is production hours spent buying a slightly better ranking on a page that was never going to convert.
Test low-hanging fruit SEO in live environments
Validate pipeline impact by publishing real SEO content and tracking keyword movement during your trial.
Modeling the Pipeline: Turning Position Deltas into Client-Ready Forecasts
The forecast that survives a client QBR is not the one with the most precise CTR curve. It is the one built from variables the client can see in their own Search Console. The working formula is deliberately plain: monthly impressions at current position, multiplied by the CTR delta between current position and the target position, multiplied by the page's historical conversion rate to a defined pipeline event. Three inputs, all defensible, all traceable to a data source the client already trusts.
The CTR delta is where the modeling discipline matters. A page at position 11 targeting position 3 does not gain 3% CTR—it gains something closer to the difference between page-two obscurity, where combined page-two clicks sit near 0.78% 3, and a top-three slot where meaningful click share begins. Using the current-benchmark curve as the working number, that delta lands in the double digits for most commercial queries. Using the conservative device-adjusted curve, the same move produces a smaller but still material gain. The strategist populates both.
Conversion rate is the input agencies get wrong most often. The temptation is to apply a site-wide average, which flattens the forecast into fiction. Striking-distance pages tend to sit on service or category templates with conversion rates that diverge sharply from blog averages. The defensible move is to pull the page's own trailing 90-day conversion rate for the specific pipeline event—consultation request, appointment book, quote submission—rather than borrowing a portfolio number. When the page has insufficient conversion history, the strategist uses the template average from comparable pages on the same site, not an industry benchmark.
The final output is a three-line forecast per candidate page: aggressive scenario, working forecast, conservative floor. The working forecast goes into the client dashboard. The conservative floor goes into the retainer commitment language. The aggressive number stays internal, used only when a stakeholder asks what upside looks like if the SERP layout holds clean and the page overperforms its template. That separation is what keeps striking-distance programs from becoming the source of the next uncomfortable renewal conversation.
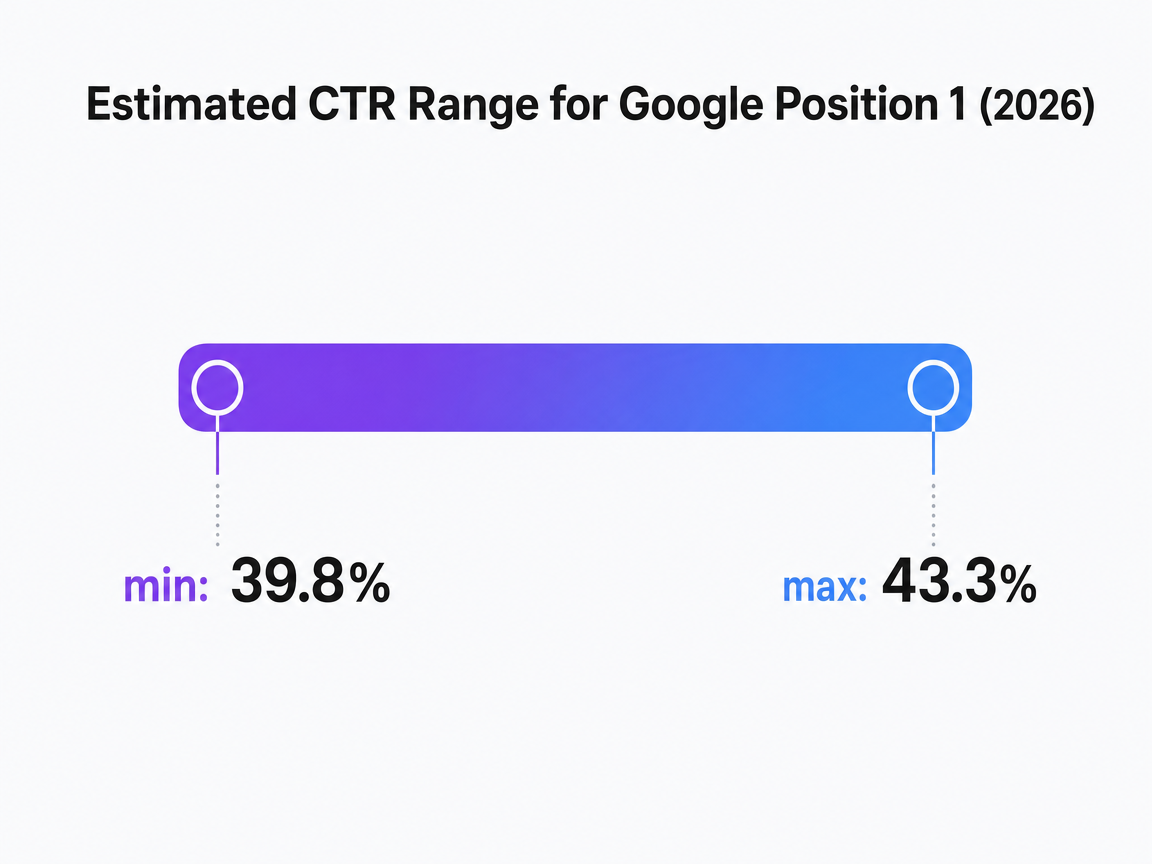 Estimated CTR Range for Google Position 1 (2026)
Provides the estimated range for the average click-through rate for the first organic position in Google, based on 2026 aggregated data.
Portfolio Execution Economics for Agencies Running Striking-Distance Programs at Scale
For agencies managing striking-distance programs across a book of accounts, the analytical framework that governs a single client stops being the bottleneck. Production throughput does. The question shifts from "which pages get worked" to "how many pages per strategist per month, across how many accounts, without editorial quality collapsing." That is a capacity math problem, and it deserves the same rigor applied to the CTR curves.
The unit of measurement worth tracking is candidate pages shipped per strategist per month, not hours logged. A traditional agency workflow—brief, draft, review, revise, publish—typically consumes 6–10 hours per striking-distance page when the strategist personally touches every step. A systematized workflow, where the strategist governs prioritization, intent validation, and final editorial approval while production execution runs on templated assist, tends to compress that to 1.5–3 hours per page. The delta is what determines whether a single strategist governs 8 accounts or 30.
The table below is a working model, not a claim about market averages. Agency leaders should populate it with their own throughput data and the sourced CTR ranges already established.
| Variable | Traditional Workflow | Systematized Workflow |
|---|---|---|
| Strategist hours per striking-distance page | 6–10 | 1.5–3 |
| Pages shipped per strategist per month (at 120 billable hours) | 12–20 | 40–80 |
| Client accounts governed per strategist | 6–10 | 20–40 |
| Position 11–20 candidates per mid-sized account (28-day pull) | 200–900 URL-query pairs | 200–900 URL-query pairs |
| Post-filter priority queue per account per month | 4–8 pages | 4–8 pages |
| Working-forecast CTR delta (page 2 → top 3), current benchmark | ~28% 2 | ~28% 2 |
| Conservative floor CTR delta (page 2 → top 3), device-adjusted | ~9% 7 | ~9% 7 |
The candidate volume and the CTR economics do not change between workflows. The strategist coverage ratio does. That is where portfolio margin is made or lost.
The second execution variable is queue discipline. A backlog of 4–8 pages per account per month is a defensible commitment across a 20-account book. A backlog of 15 pages per account is a promise that produces missed sprints and eroded margin by the second quarter. The temptation to overpromise scales with account count, which is why the prioritization filters from earlier sections—revenue tiebreaker, intent gate, page-two-first sequencing—function as capacity governors, not just quality filters. They keep the queue honest.
See How Top Agencies Automate Low Hanging Fruit SEO for Consistent Pipeline Gains
Connect with our team to review data-backed methods for rapidly surfacing and executing quick-win SEO opportunities across multiple client accounts—without increasing headcount or losing oversight.
Production Systems: Where AI Assistance Ends and Editorial Judgment Begins
The compression from 6–10 hours per page to 1.5–3 hours does not come from typing faster. It comes from moving specific tasks off the strategist and onto templated production assist:
- draft generation against approved briefs,
- on-page schema updates,
- internal linking suggestions against an established topic map, and
- meta-title variant generation for CTR testing.
Query reformulation research shows that behavior patterns from popular queries can inform how lower-volume queries get handled at scale 10, and the same principle applies to internal production—repeatable pattern work compounds cleanly across a portfolio while judgment work does not.
Where the line has to hold is intent validation, editorial approval, and the Needs Met check against the target query. Those are the tasks that determine whether the page actually earns the top-three slot the forecast promised, and they are the tasks Google's guidance treats as non-negotiable. Automation used primarily to manipulate rankings violates Google's spam policies 8; automation used to accelerate production against strategist-approved briefs does not. The distinction is who owns the intent decision and the final read.
Agency leaders governing striking-distance programs across 20 or more accounts should treat AI assistance as a throughput multiplier on the mechanical layer and a firewall against the strategic layer. Every page still gets a human sign-off before it ships. That approval discipline is what keeps the forecast honest and the retainer intact.
Common Failure Modes That Break the Forecast
Four failure modes account for most striking-distance programs that miss their number, and none of them are analytical. They are operational.
- The first is layout drift. A forecast built on clean-SERP CTR assumptions ages badly when AI Overviews expand into new query classes mid-quarter. The fix is a monthly SERP layout re-audit on every active candidate, not a one-time check at intake.
- The second is queue inflation. Client success managers promise 12 pages a month against a strategist backlog that supports 6. The revenue tiebreaker and intent gate get skipped to hit volume, and the pages that ship rank without converting.
- The third is conversion rate laundering. Applying a site-wide average to a service-template page inflates every forecast in the portfolio. The discipline is per-template conversion data or an explicit note that the number is provisional.
- The fourth is intent-match decay. A page optimized for a query 18 months ago drifts as the SERP rewards a different interpretation. Quarterly Needs Met re-checks against the current top three 5 catch this before the ranking slips back below the fold.
Frequently Asked Questions
References
- 1.SEO CTR Benchmarks 2026: Organic Click-Through Rates by Position.
- 2.Over 25% of People Click the First Google Search Result.
- 3.CTR Statistics 2026: Average CTR by All Marketing Channels.
- 4.Creating Helpful, Reliable, People-First Content.
- 5.Search Quality Rater Guidelines: An Overview - Google.
- 6.Heads and Tails: [SIGIR paper on head vs tail queries].
- 7.Device-dependent click-through rate estimation in Google organic search results.
- 8.Google Search's guidance about AI-generated content.
- 9.Ranking Relevance in Yahoo Search.
- 10.Towards scalability and extensibility of query reformulation modeling in e-commerce search.
- 11.How to Find Low-Hanging Fruit Keywords for Your SEO Strategy.