Key Takeaways
- Multi-location healthcare marketing fails when each acquired site keeps its own vendors; centralize strategy, compliance, and measurement while passing local details as structured variables.
- Brand intelligence belongs in a single canonical schema, like a clinical data warehouse, so provider credentials, payers, and languages render locally without duplicating agency briefs across sites.
- Post-2023 OCR guidance turned GA4 and Meta Pixel into an architectural decision; server-side tagging, consent management, and a documented data flow map should be network-wide defaults 1.
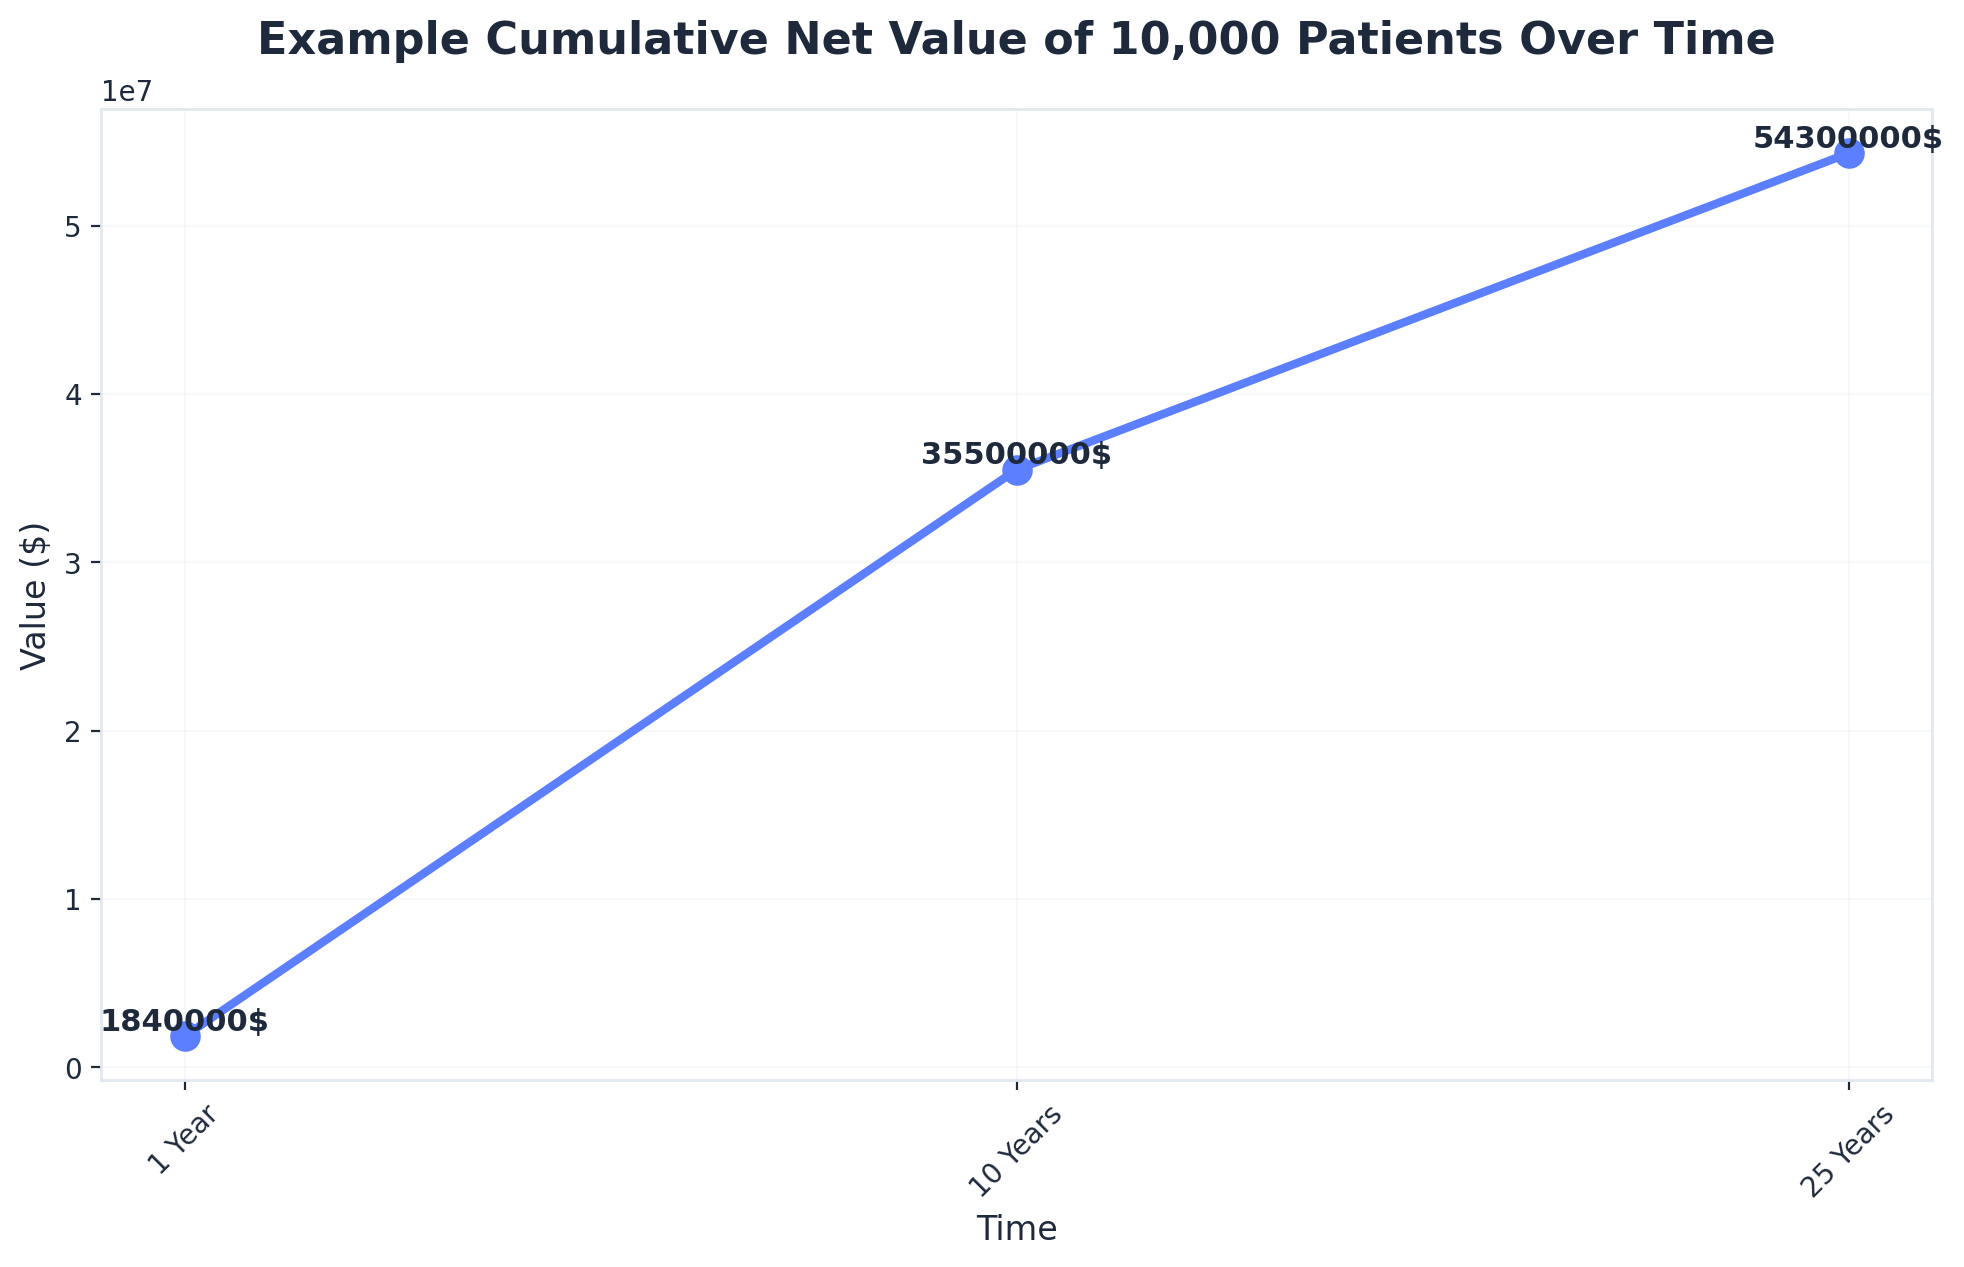
- Set the marketing investment ceiling against patient lifetime value, not first-visit revenue—a 10,000-patient panel can reach roughly $35.5 million in cumulative net value over ten years 9.
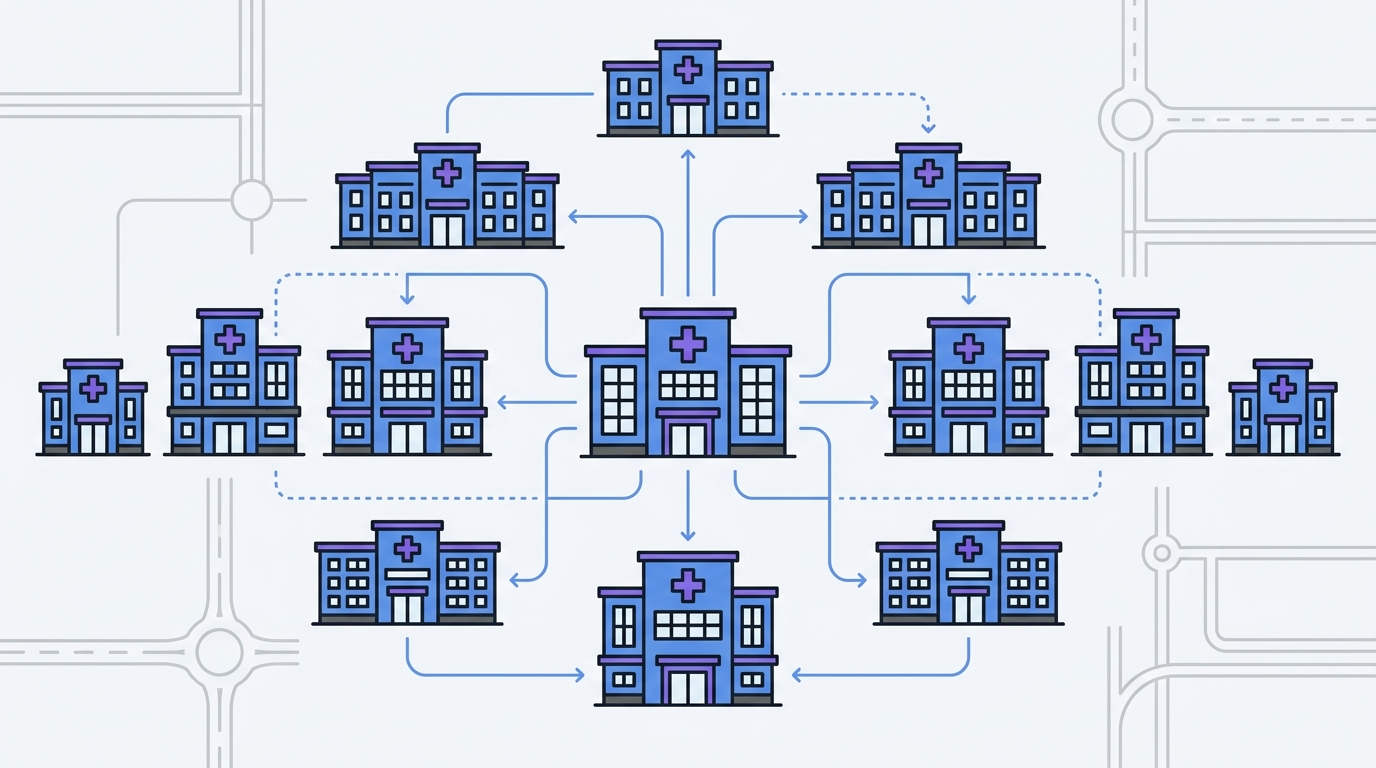
The Consolidation Math Behind Why Per-Location Marketing No Longer Works
The economics of patient acquisition changed when ownership structures changed. Roughly half of primary care physicians now work inside hospital-affiliated entities, a sharp departure from the independent-practice model that defined the field a generation ago 6. Specialty groups, DSOs, MSOs, and ambulatory networks have followed a similar arc. The marketing function inherited from those acquisitions, however, did not consolidate. It accumulated.
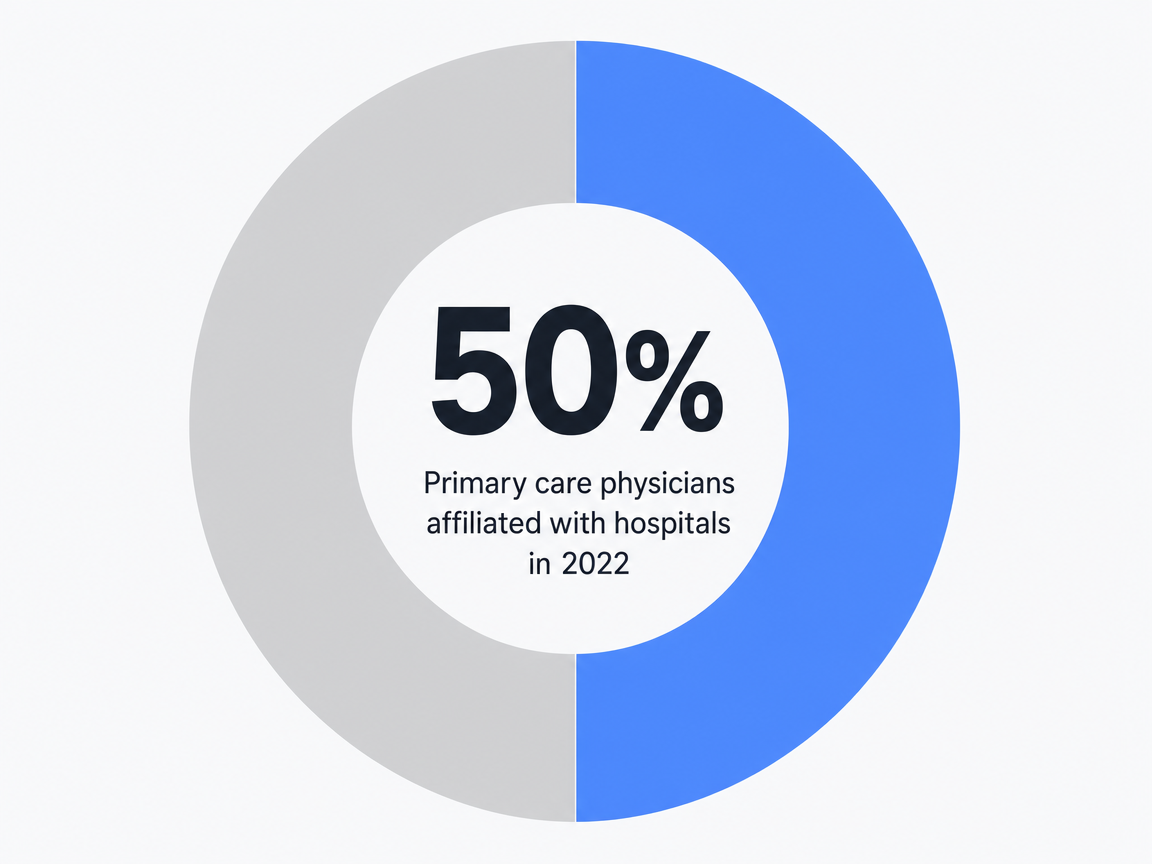 Primary care physicians affiliated with hospitals in 2022: 50%
A regional medical group with 25 sites typically carries 25 versions of the same marketing relationship: a local agency on retainer, a freelance SEO contractor, a paid search vendor with its own attribution model, and a content writer chosen by the practice administrator before the acquisition closed. Each contract was rational at signing. Together they produce duplicated spend, fragmented data, and a reporting layer that cannot answer a CFO's basic question about cost per acquired patient at the network level.
The digital share of those budgets is not trivial. U.S. healthcare firms allocate an average of 12.5 percent of marketing spend to paid digital channels, a line item that compounds quickly when multiplied across locations and managed independently at each one 2. Provider network management research has documented the same drag inside operations: data sits in legacy systems from acquired practices, credentialing and directory information drifts out of sync, and marketing teams inherit the downstream mess 7.
The consolidation question is no longer whether to centralize. It is what to centralize first. Strategy, brand intelligence, compliance posture, and measurement architecture belong at the account level. Local relevance belongs in structured variables that feed execution. The sections that follow lay out that operating model in four layers — strategy, execution, compliance, and measurement — with the cost math attached.
The Strategy Layer: Account-Level Brand Intelligence vs. Per-Location Vendors
Centralization as a Data Architecture Problem, Not a Philosophical One
The centralization debate inside multi-location healthcare operators usually gets framed as a culture question: corporate brand control versus local autonomy. That framing produces the wrong answer because it skips the layer that actually matters. Brand intelligence — the structured representation of voice, service lines, provider credentials, payer mix, and patient demographics — is data. Whether it lives in one schema or 25 disconnected agency briefs determines whether execution can scale.
Operations teams already learned this lesson the hard way. Provider network management research documents how acquired practices arrive with legacy systems, inconsistent credentialing records, and directory data that drifts across platforms, producing measurable downstream cost in claims, scheduling, and patient experience 7. The marketing equivalent looks identical: each acquired practice carries its own Google Business Profile owner, a different agency's keyword list, a separate review-response template, and a Facebook page nobody at the network level can access.
A workable strategy layer treats brand assets the way a clinical data warehouse treats encounters. One canonical record per provider, per location, per service line — with structured fields for the variables that legitimately differ across markets (insurance accepted, languages spoken, ADA accessibility, parking, bilingual front desk staff). Industry guidance on scaling multi-location clinics frames the same point from the operations side: standardized structure across sites is what allows local adaptation without losing brand coherence 3.
Once brand intelligence is centralized as data, the question of who executes — agency, in-house team, or platform — becomes a sourcing decision rather than a strategy decision. The strategy already lives in the schema.
Marketing Operating Model Cost Structure for a 25-Location Network
The cost difference between operating models is rarely visible on a single invoice. It surfaces when a CFO asks for total marketing spend across the network and the answer requires three weeks and a spreadsheet pulled from 25 separate agency dashboards. The table below frames the four dominant operating models against the variables that actually drive total cost of ownership at the network level.
Marketing Operating Model Cost Structure for a 25-Location Healthcare Network
| Operating Model | Pricing Basis | Annual Cost (25 Locations) | Coordination Overhead | Compliance Risk Ownership |
|---|---|---|---|---|
| In-house centralized team | Fully-loaded FTE × headcount | (salary load × FTE count); no per-location multiplier | Internal; bounded by team capacity | Operator retains fully |
| Traditional agency, per-location retainer | Monthly retainer × locations × 12 | (retainer × 25 × 12); scales linearly with footprint | High; 25 vendor relationships, fragmented reporting | Shared, often unclear in MSAs |
| Freelance / contractor network | Variable cost per deliverable | (deliverable rate × volume); unpredictable at scale | Highest; no single accountable layer | Operator retains; contractors rarely BAA-eligible |
| Account-level AI marketing platform | Account-level subscription | $599/month post-trial, account-level (Vectoron) | Single plan across all sites and service lines | Platform-supported; operator retains final accountability |
Only the platform figure is a supplied price point. The other rows are deliberately written as variables because retainer ranges, FTE loads, and freelance rates vary by market and specialty, and inventing benchmarks would mislead the reader. The operative point is structural: the first three rows scale cost as a function of location count, while the fourth scales as a function of account complexity. Across a 25-site network, that distinction compounds quickly when the 12.5 percent of marketing budget allocated to paid digital is being managed independently at each site rather than aggregated at the network level 2.
The coordination overhead column is where most CFOs underestimate cost. Vendor management time, duplicated creative production, conflicting attribution models, and the meeting load required to keep 25 retainers aligned are real labor costs that rarely appear in marketing's reported spend. They appear in headcount on the operations side or in opportunity cost when launches slip. Sizing the operating model honestly means pricing those hours, not just the invoiced fees.
Experience Unified Medical Marketing Execution Risk-Free
Test-drive a coordinated, data-driven marketing program and publish real campaigns for all your healthcare locations.
The Execution Layer: Coordinating Content, SEO, PPC, and Backlinks Without Duplicating Spend
Local Relevance Through Structured Variables, Not Separate Agencies
The case for hiring a local agency at every site usually rests on a real observation: patients in Tulsa do not search the same way patients in Tampa do. Insurance networks differ. Spanish-language demand differs. Drive-time radii differ. The mistake is concluding that local variation requires local vendors. Variation is a content problem, not a sourcing problem.
An execution layer built for a multi-location operator treats every local difference as a structured variable inside one production system. City name, ZIP cluster, accepted payers, languages spoken at the front desk, on-site services, parking notes, transit access, and provider-specific credentials become fields, not separately commissioned briefs. A single content template for a service line — say, pediatric urgent care — renders 25 location-specific pages from the same canonical record, each one carrying the local variables that actually matter to a searcher. Industry guidance on scaling multi-location clinics frames the same architectural point: standardization at the structure layer is what allows meaningful local adaptation without losing brand coherence 3.
The same logic applies to paid media. Twenty-five Google Ads accounts managed by 25 vendors produce 25 keyword strategies, 25 negative keyword lists, and a 25-way fight for the same branded terms. One account-level structure with location-targeted campaigns and shared negative lists eliminates the internal bidding war and surfaces budget reallocation decisions the network can actually act on. Connected-care ROI research makes the broader case that fragmented measurement is what blocks operators from seeing where dollars are working 5.
Backlinks follow the same pattern. Local citations, chamber memberships, and community sponsorships are local in content but identical in workflow. Run them through one acquisition pipeline with location as a variable and the per-link cost stops scaling with footprint.
Provider and Service Line Pages as the Unit of E-E-A-T
Search engines evaluate medical content against a higher evidentiary bar than commercial content, and the unit of evaluation is the page, not the domain. For a multi-location operator, that means provider bios and service line pages — not the homepage — are where experience, expertise, authoritativeness, and trust either get demonstrated or get hand-waved.
A provider page that satisfies E-E-A-T carries the artifacts a credentialing committee would expect: medical school, residency, board certifications, hospital affiliations, years in practice, languages, and specific procedures performed. A service line page carries equivalent depth: which clinicians at which locations perform the procedure, what payers cover it, what the recovery looks like, and what the published outcomes are. Healthcare content marketing research grounds the same point from the patient side — depth and clinical specificity are what convert browsing into trust, not generic wellness copy 4. Specialty-level guidance reaches the same conclusion in dermatology, where condition-specific landing pages outperform broad practice pages 10.
The execution challenge is that this depth has to be produced once, governed centrally, and rendered locally. A board-certified dermatologist who practices at three locations should appear on three location pages with shared credential data and location-specific scheduling, not as three independently written bios that drift apart over time. Treating provider records as the canonical source — and pages as views on top of that source — is what makes E-E-A-T scale without hiring a separate writer for every site.
The Compliance Layer: HIPAA Tracking After the 2023 OCR Guidance
Why GA4 and Meta Pixel Became an Architectural Decision
The 2023 guidance from the HHS Office for Civil Rights reclassified a question marketing teams had treated as routine. When a tracking pixel on a hospital appointment page transmits a patient's IP address, device identifier, and the URL of a cardiology scheduling form to a third-party advertising platform, the regulator's position is that this combination can constitute a disclosure of protected health information — and that disclosure requires either patient authorization or a Business Associate Agreement that the major ad platforms generally do not sign for this use case. HIPAA marketing rules already drew a hard line around using PHI for marketing without explicit authorization, and the OCR clarification extended that line to the analytics and retargeting layer most healthcare websites had been running for a decade 1.
For a single-site practice, the response can be a configuration change. For a 25-site network, it is an architectural decision. Each location historically chose its own tag manager, its own GA4 property, its own ad platform pixels, and its own consent banner — or no banner at all. Auditing 25 different tagging implementations to identify which ones expose appointment URLs, condition-specific landing pages, or form-field data to third parties is a project measured in months, not days.
Provider network management research already documented how acquired practices arrive carrying legacy systems and inconsistent data hygiene that creates downstream operational cost 7. The same pattern shows up in the marketing stack. Treating tracking architecture as a network-level decision — one tagging schema, one consent model, one approved set of pixels with documented data flows — is what moves the operator from defending 25 separate exposures to defending one.
Consent and Server-Side Tagging as Network-Wide Defaults
The post-2023 architecture most healthcare operators have converged on has three components. First, server-side tagging: marketing data flows through a server the operator controls, where PHI fields can be stripped or hashed before anything reaches Google or Meta. Second, a consent management platform that gates third-party tags behind explicit opt-in, with consent state propagated to every downstream system. Third, a documented data flow map showing which fields leave the network, where they go, and under what legal basis.
Running those components at the location level produces 25 versions of the same control with 25 different failure modes. Running them at the account level produces one auditable system. The same logic that justified centralizing brand intelligence applies to consent: the cost of a network-wide default is one implementation; the cost of letting each site decide is a perpetual audit.
Connected-care ROI research makes the broader point that fragmented measurement infrastructure is what blocks operators from seeing where dollars work 5. Compliance and measurement collapse into the same architectural problem. A tracking layer that is HIPAA-defensible and a tracking layer that produces clean attribution are the same layer, built once at the network level, with location passed as a variable rather than as a separate vendor relationship.
Unify Medical Marketing Across All Your Healthcare Locations—Effortlessly
Discover how leading healthcare groups and agencies are using AI-powered automation to centralize strategy, streamline multi-site execution, and achieve measurable growth—without increasing headcount or operational costs.
The Measurement Layer: Patient Lifetime Value as the Investment Ceiling
Walking the LTV Math at Network Scale
CAC-only framing is the reason most healthcare marketing budgets get cut in the wrong place. A CFO looking at a $400 cost per acquired primary care patient against a single first-visit reimbursement reaches a different conclusion than the same CFO looking at the same number against a 25-year value curve. The investment ceiling is set by lifetime value, not by first-touch revenue, and at network scale the difference is measured in tens of millions.
The arithmetic is straightforward. Patient lifetime value research walks through a worked example using a 2.92 percent operating margin — net patient revenue minus total operating costs, divided by net patient revenue — applied to a panel of 10,000 patients. The cumulative net value lands at roughly $1.84 million after one year, $35.5 million after ten years, and $54.3 million after twenty-five years 9. The compounding is not magic; it is the predictable result of margin retained across recurring encounters, referrals into specialty service lines, and the family members an established patient brings with them.
 Example Cumulative Net Value of 10,000 Patients Over Time
Example Cumulative Net Value of 10,000 Patients Over Time: 1 Year: $1840000, 10 Years: $35500000, 25 Years: $54300000. An example calculation showing the potential lifetime value of 10,000 patients, demonstrating how value compounds over time. The values are $1.84 million after one year,.
Translating that math to a 25-location operator means treating each site's panel as a node in the same model. A regional medical group adding 10,000 net new patients across the network in a year is not generating $1.84 million in marketing-attributable value — it is opening a position whose ten-year value is $35.5 million if retention holds. The marketing investment ceiling becomes a function of how much margin the operator is willing to deploy against that future value, not how much first-visit revenue covers the campaign that produced the booking.
The practical consequence is that paid digital spend, which sits at roughly 12.5 percent of marketing budget across U.S. healthcare firms 2, gets evaluated against a ten- to twenty-five-year denominator rather than a quarterly one. That single change in the math is what unlocks the case for centralized investment in content depth, technical SEO, and provider page quality — assets that compound the same way patient panels do.
Attribution Across Acquired Practices and Fragmented Source Data
The LTV model only works if the operator can tie an acquired patient back to the channel that produced the first visit and then track that patient's encounters across the network over time. For most multi-location operators, neither half of that sentence is currently true.
Acquired practices arrive with their own EHR instances, their own scheduling systems, and patient records that were never reconciled to a network-level master patient index. Provider network management research documents the same data hygiene problem from the operations side: legacy systems, inconsistent identifiers, and directory drift produce measurable downstream cost across the organization 7. Marketing inherits the consequences. A patient acquired through a paid search campaign at one site and later seen at a sister specialty practice often appears in the data as two separate patients, and the channel that produced the original visit gets no credit for the second encounter.
Connected-care ROI research frames the resolution as a measurement architecture decision rather than a tooling one 5. The components are familiar: a network-level identity resolution layer that reconciles patient records across acquired EHRs, a marketing data warehouse that joins encounter data to first-touch source, and an attribution model that assigns value across the multi-year window LTV actually pays out over.
None of those components scale if they are rebuilt at every site. They scale when the operator owns one warehouse, one identity layer, and one attribution model — with location as a dimension, not as a separate implementation. That is the same architectural pattern the strategy, execution, and compliance layers already required.
Choosing an Operating Model: In-House, Agency, Freelance Network, or Account-Level Platform
The four operating models laid out earlier in this article each solve a different bottleneck. None solves all of them. The right choice for a specific operator depends on which constraint is binding right now — capacity, coordination, compliance, or cost trajectory.
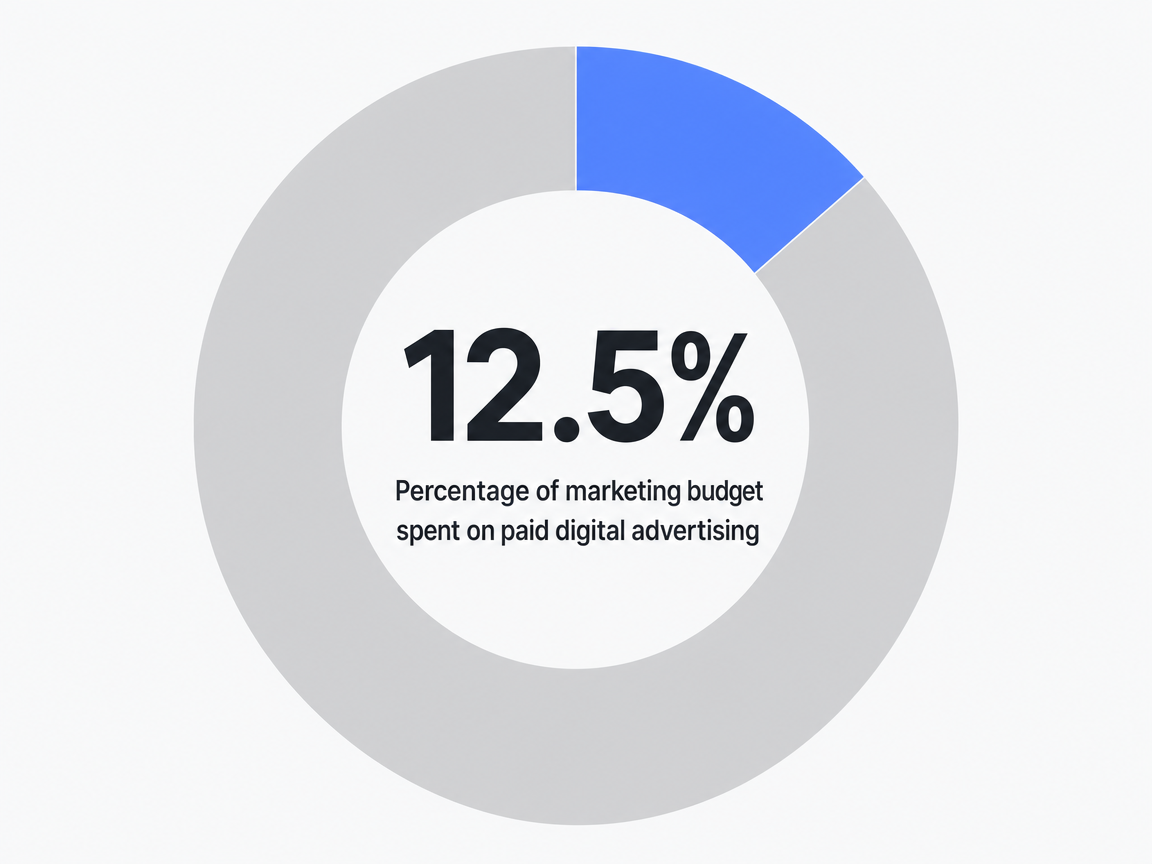 Percentage of marketing budget spent on paid digital advertising: 12.5%
An in-house centralized team produces the cleanest brand governance and the fastest internal feedback loop, but it caps at the headcount the operator is willing to fund. A 15-person growth team can run a 25-site network competently. The same team across 80 sites starts triaging instead of executing, and content depth — the asset that actually compounds patient lifetime value 9 — is the first line item that gets cut.
Traditional agencies on per-location retainers solve capacity by spending money. They do not solve coordination. Twenty-five separate retainers produce 25 separate keyword lists, 25 reporting cadences, and a quarterly review meeting load that consumes the VP's calendar without producing a network-level view. The model also leaves compliance ownership ambiguous in a post-2023 OCR environment where tracking architecture is a network-level decision, not a vendor-level one 1.
Freelance and contractor networks offer flexibility on cost per deliverable and almost nothing else. Few contractors are willing to sign Business Associate Agreements for the data flows healthcare marketing actually requires, and quality variance across a 25-site footprint is the failure mode operators discover after the first content audit.
Account-level marketing platforms — the category Vectoron occupies — collapse the strategy, execution, compliance, and measurement layers into one plan billed at the account level rather than the location level. The model trades some of the bespoke handholding of a senior agency relationship for continuous execution across content, SEO, PPC, and backlinks without the per-location multiplier. For operators whose binding constraint is coordination drag across a growing footprint, that trade is the one the math supports. For operators with five sites and a strong in-house lead, it is not yet.
The decision framework is narrower than the marketing for it suggests. Count the sites, count the service lines, count the FTEs already deployed against the growth program, and count the vendor relationships currently invoicing against location-level budgets. When the second number grows faster than the first, the operating model is the problem.
Frequently Asked Questions
References
- 1.What are the HIPAA Marketing Rules?.
- 2.U.S. healthcare firms' marketing budget share 2025.
- 3.Scaling with Structure: Managing Multi-Location Clinics Efficiently.
- 4.How healthcare content marketing builds trust with patients.
- 5.How to Measure ROI in Healthcare with Connected Care Solutions.
- 6.Growth of Private Equity and Hospital Consolidation in Primary Care.
- 7.What is Challenging with Provider Network Management?.
- 8.6 Proven Strategies for Healthcare Social Media Marketing.
- 9.How to calculate patient lifetime value.
- 10.Top Marketing Tactics For Dermatology Hospitals & Clinics.