Key Takeaways
- Coordination overhead consumes roughly 40% of internal marketing capacity, costing operators $180,000 to $320,000 annually 10, so treat retainer fees and absorbed internal labor as a single program cost during budget reviews.
- Per-location billing scales linearly with site count while service-line content is reusable, plateauing inquiry volume around the seventh or eighth site; shift to footprint-level contracts where new locations only add marginal content cost.
- Agencies have responded to fragmented search behavior and clinical bottlenecks with more account managers rather than restructured production routing 8, so evaluate operational geometry, not staffing levels, when judging adaptation.
- Fixed monthly content quotas leave publishing six to eight weeks behind demand windows, forcing paid search to absorb acquisition load; unified execution models cut launch time 65% and lift content output 3.1x 11.
- Treating clinical accuracy review as a post-production gate stretches two-week cycles to five weeks 8; integrate citation verification and fact-checking upstream so reviewers approve near-final drafts in days.
- Separating content, technical SEO, and paid media into three teams with distinct dashboards prevents clean ROI attribution 6, so require a shared performance dataset and publishing calendar across all three disciplines.
The Patient Acquisition Gap Most Retainers Hide
Rankings improved, but patient inquiries did not. This is a common report VPs of Marketing at multi-location healthcare operators receive from their medical SEO agency. Healthcare EBITDA was 230 basis points lower in 2024 than in 2019, with further decline projected through 2027 4. In this environment, six-figure agency retainers require a strong defense, which often fails on a single metric: cost per booked patient by location, not domain authority by quarter.
The disconnect between ranking reports and actual patient acquisition is not a tactical issue but a structural problem with contract geometry. Per-location billing, manual handoffs between writers and clinical reviewers, and detached technical SEO sprints create three parallel programs instead of one integrated system with shared performance data. This often results in the publishing curve lagging the demand curve by a quarter, leading to flat inquiry volumes across multiple sites.
What follows is a diagnostic an operator can run using existing GA4, Search Console, and contract data before the next renewal call.
Why Traditional Agency Models Fail at Scale
Coordination Overhead Undermines Retainer Value
The retainer fee itself is often not the largest cost of an agency relationship for a multi-location operator. The internal labor required to manage the agency often exceeds it. Advisory Board's 2024 research found that healthcare marketing teams spend approximately 40% of their time managing external agencies, including handoffs, revisions, and approvals. This coordination overhead costs organizations an estimated $180,000 to $320,000 annually in absorbed internal labor 10. This figure accounts for time spent by in-house marketing staff on tasks such as brief writing, routing content for clinical review, ensuring brand voice consistency, and reconciling quarterly performance.
For a VP of Marketing overseeing numerous sites, this means a significant portion of their internal team's capacity is consumed by translating between the operator and the agency, before any patient-facing content goes live. This hidden cost doesn't appear on agency reports but manifests as a need for additional marketing headcount to manage existing service lines.
Operators should view the retainer and the coordination tax as a single, comprehensive program cost, not separate departmental budgets.
Per-Location Billing Penalizes Growth
Most medical SEO agencies use a per-location billing structure designed for single practices, which becomes inefficient for portfolio operators. This model punishes growth: each new clinic triggers a separate onboarding fee, a monthly minimum per site, and a distinct reporting cadence. The agency's labor scales linearly with location count because its production is location-keyed, with dedicated resources for each Google Business Profile, local citation, and content calendar.
However, the underlying service-line content—such as a knee replacement recovery guide or a pediatric vaccine schedule—is often reusable across multiple locations. While demand for a service line concentrates at the account level, where shared content and technical SEO infrastructure could compound benefits, billing remains fragmented at the location level. This mismatch explains why per-location retainer programs often plateau in inquiry volume around the seventh or eighth site; the agency's revenue grows, but the operator's marginal patient acquisition cost increases proportionally. Outcome limitations stem from the contract structure, not the SEO tactics.
Disrupted Exchanges and Agency Adaptation Failure
Healthcare marketing has undergone significant disruption on both the demand and supply sides. Academic literature confirms that the traditional exchanges between providers, patients, and intermediaries no longer align with the workflows agencies were designed to service 8. Search behavior has fragmented, encompassing condition-specific informational queries, location-specific booking intent, and AI-generated answer surfaces that shorten the click path. New service lines emerge faster than agency content calendars can accommodate them, and clinical reviewers become bottlenecks in a publishing pipeline they are not staffed to support.
The typical agency response—adding account managers, implementing project management tools, and scheduling weekly calls—treats coordination friction as a communication problem. In reality, it's a production-routing issue. When content briefs, technical SEO sprints, and paid media bids are managed by separate teams with distinct points of contact and timelines, the operator bears the integration cost. Agencies have adapted their staffing without fundamentally changing their operational geometry, leading to a gap evident in patient inquiries per dollar of total program cost.
Where Medical SEO Programs Actually Break
Publishing Cadence Lags Demand
Search demand for clinical service lines operates on a timeline that traditional agency content calendars often cannot match. For instance, a dermatology operator introducing cosmetic injectable services in new markets will see branded and condition-level query volume emerge six to eight weeks before the agency's editorial pipeline produces the necessary supporting content. By the time a location-specific Botox aftercare hub goes live, the paid search team may have already absorbed the entire acquisition load at a cost that will be flagged by the CFO.
This lag is structural. Most medical SEO retainers commit to a fixed monthly content quota—e.g., eight, twelve, or sixteen pages—distributed across a footprint that might have forty active service-line opportunities. The agency rations output, and the operator absorbs the resulting queue. Forrester's 2024 evaluation of healthcare marketing platforms found that organizations using unified execution models reduced campaign launch time by 65% compared to traditional agency workflows and achieved 3.1x higher content output without increasing headcount 11. These figures measure end-to-end time from brief approval to live page for multi-location healthcare programs. Operators reviewing their own publishing logs will likely see similar gaps where briefs sat in queue while demand windows closed.
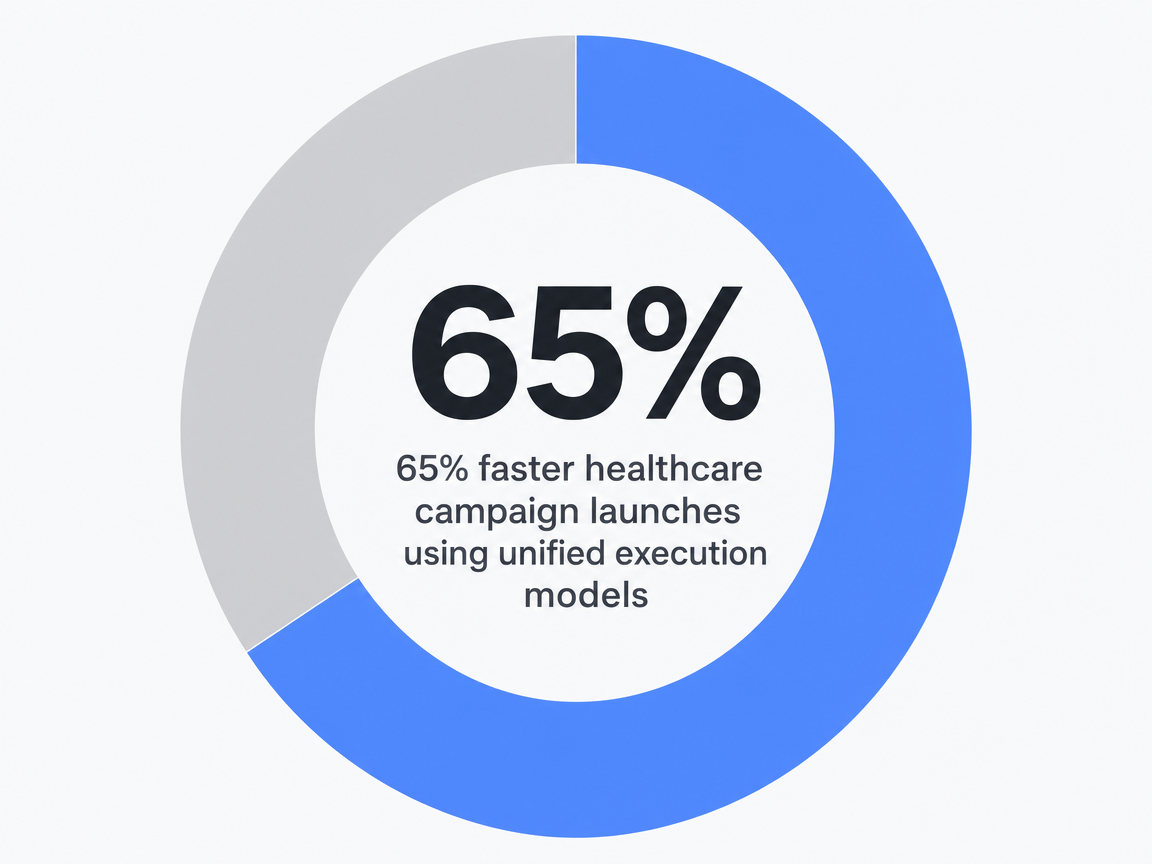 65% faster healthcare campaign launches using unified execution models: 65%
Medical Accuracy Review as a Rate-Limiter
Clinical review often becomes an unpriced bottleneck in the retainer model. Every page covering a YMYL (Your Money Your Life) topic—such as statin side effects, post-operative protocols, or vaccine schedules—requires sign-off from a credentialed reviewer not employed by the agency. The handoff process is inefficient: the agency drafts, the operator's medical director reviews, edits return to the agency, the agency revises, and the reviewer re-reads. This can stretch a two-week process to five weeks, delaying a Q1 service line launch into Q2, while competitors gain an advantage.
The Duke healthcare marketing analysis identifies this as a disrupted exchange problem, where clinical reviewers become gatekeepers for a publishing pipeline they are not staffed to support, and agencies continue workflows as if this bottleneck doesn't exist 8. The solution is not faster reviewers but integrating accuracy review into the production workflow. When draft generation, citation verification, and clinical fact-checking occur within one system, reviewers receive a near-final document, compressing review time because the upstream work is more complete.
Three Parallel Programs, Not One Unified Effort
Operators often pay for a single marketing program but receive three distinct, uncoordinated efforts. Content is managed by one team with its own brief templates and editorial calendar. Technical SEO is handled by a second team, focusing on Core Web Vitals, schema deployment, and crawl budget on a quarterly sprint cycle. Paid media is managed by a third team, optimizing bids and ad copy against a separate dashboard. Each team reports to a different account manager, operates on a different schedule, and lacks a shared performance dataset.
This fragmentation is evident at the page level. A new service-line landing page is published by the content team, but technical SEO might not implement internal linking and schema until a later sprint. Meanwhile, paid media may already be bidding on the same queries, driving traffic to a different URL with conflicting copy. The operator's GA4 view then shows three uncoordinated traffic sources converging on disparate conversion paths. Deloitte's research on healthcare digital ROI highlights the resulting measurement gap: when execution channels lack a shared performance layer, ROI cannot be cleanly attributed, making the program appear to underperform even if individual tactics meet their internal benchmarks 6. The CFO sees flat inquiries, while the agency reports three "green" dashboards.
Test automated content for every location now
Experience hands-on, multi-site content creation and publishing with no commitment required.
Understanding the Value of Traditional Retainers
The per-location retainer model has historically served a purpose. A credentialed agency partner offers a single point of accountability, a contractually defined scope, and specialized healthcare marketing experience that an in-house team would take significant time and resources to build. For a regional dermatology group expanding to its first few locations, this trade-off is rational. The agency manages Google Business Profile hygiene, schema markup on procedure pages, and editorial review for medical content.
Additionally, retainers provide access to specialized expertise that an operator might not need full-time. Few in-house teams can justify a dedicated technical SEO engineer for a five-site footprint or a backlink outreach function that is only needed intermittently. Agencies amortize these specialists across multiple clients, giving smaller operators fractional access to capabilities that would otherwise be underutilized on payroll.
However, this model breaks down at scale, typically beyond the seventh location. At this point, the efficiencies that once made the retainer effective—fractional specialists, defined scope, single accountability—transform into the coordination tax previously discussed 10. The issue is not that agencies are inherently ineffective, but that the contract structure becomes misaligned with the operator's expanding footprint.
A 7-Point Pre-Renewal Diagnostic for Medical SEO Agencies
The upcoming renewal call presents a crucial opportunity. Before it, VPs of Marketing can conduct seven checks using existing GA4, Search Console, and contract data to assess whether their current medical SEO agency is delivering value.
1. Attribution coverage by location: Determine the percentage of patient inquiries the agency can attribute to a specific page, source, and location over the last two quarters. A pass threshold is above 70%; below 50% indicates the program cannot justify its outcomes.
2. Days from brief approval to live page: Calculate the median time across the last twenty pages published. A pass is under 30 days. Over 60 days suggests the publishing curve lags demand, forcing paid media to absorb organic acquisition load.
3. Internal coordination hours: Track or survey the hours the in-house team spent on agency handoffs, revisions, and reporting calls last quarter. Advisory Board benchmarks healthcare marketing teams spending 35–45% of capacity on this, costing $180,000 to $320,000 annually 10. A pass is under 25%. At or above benchmark, the retainer is effectively being paid for twice.
4. Cross-discipline integration document: Verify the existence of a single document where content briefs, technical SEO sprint goals, and paid media keyword targets share a calendar and performance dataset. A pass means it exists and was updated this month. No document signifies no integration.
5. Per-location cost-per-page: Divide total program spend by net new pages shipped per location over the last twelve months. A pass is trending down quarter over quarter. Flat or rising per-location costs indicate linear scaling of the contract without compounding content asset library benefits.
6. Clinical review cycle time: Measure the median days from the first draft to clinical reviewer sign-off. A pass is under 10 days. Longer times suggest accuracy review is external to the production workflow rather than integrated within it.
7. Outcome metrics in the contract: Review the master services agreement. A pass means the agreement names patient inquiries, booked appointments, or qualified leads as deliverables. A fail means the deliverables are rankings, traffic, or content volume. The contract defines the agency's optimization focus.
Three or more failures should prompt a consolidation discussion rather than a renewal.
Consolidation Worksheet for Multi-Location Operators
This section is specifically for operators managing eight or more sites under a per-location retainer, as the financial implications become clear once coordination overhead and per-site billing have compounded over several quarters. The worksheet uses three operator-supplied variables and three sourced multipliers, all based on existing data and research.
Operator-supplied variables: Base monthly retainer (R), per-site monthly fee multiplied by location count (S), and loaded annual cost of the in-house marketing team (T), including salary, benefits, and overhead.
Sourced multipliers:
- Coordination capacity: 35–45% of internal team time, with absorbed labor costing $180,000 to $320,000 annually per organization (Advisory Board) 10.
- Total marketing spend reduction of 22% and lead volume increase of 31% under unified execution platforms versus traditional agency models, against a baseline where healthcare organizations spend 35–40% of marketing budget on agency coordination and overhead 13.
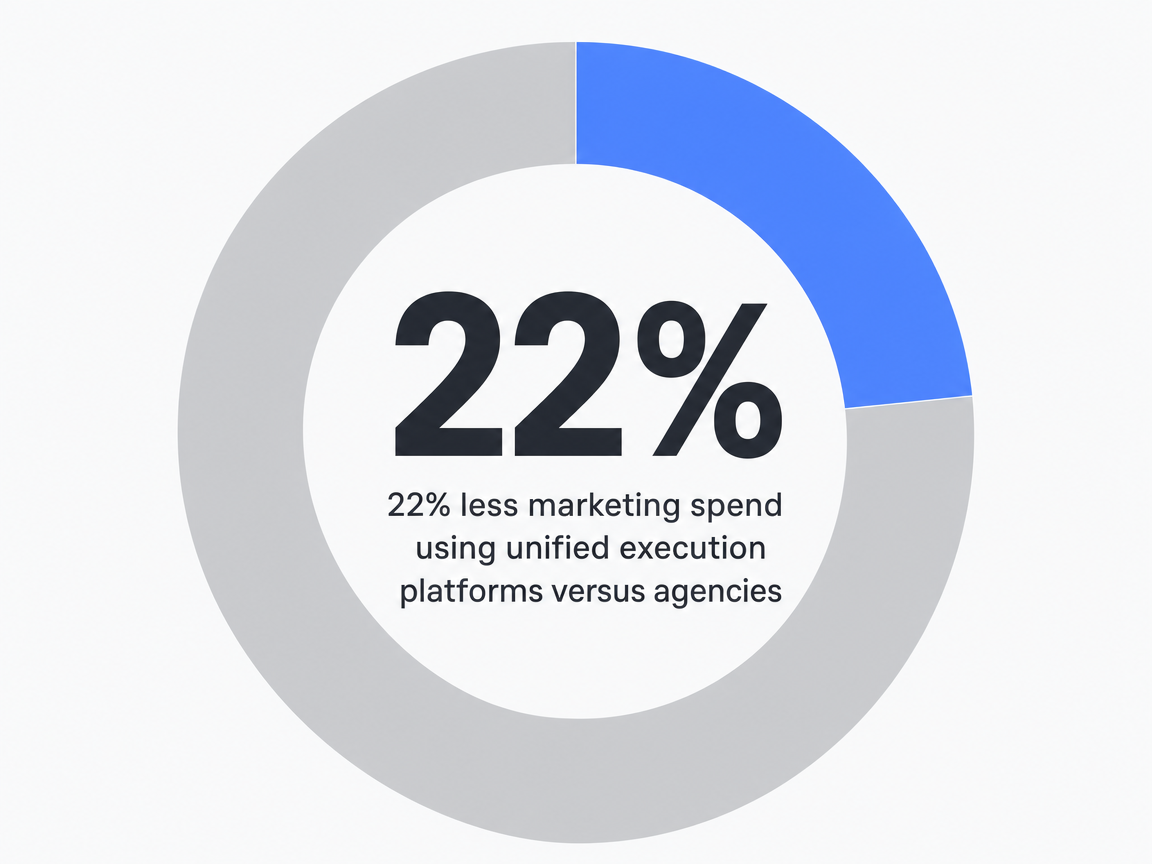 22% less marketing spend using unified execution platforms versus agencies: 22%- Campaign launch time reduction of 65% and content output multiplier of 3.1x under unified execution 11.
Two numbers the worksheet produces:
Coordination hours reclaimed: Take the midpoint of the 35–45% capacity benchmark (40%) and multiply by T. This result represents the loaded labor dollars currently allocated to agency handoffs instead of strategic work. For a team with a $600,000 loaded annual cost, this is $240,000 not producing patient-facing output.
CAC delta: Apply the 22% spend reduction to the numerator of the current blended patient acquisition cost (CAC) and the 31% lead lift to the denominator. The combined effect on CAC reveals the gap between the existing program and an account-level execution baseline derived from healthcare operators using unified platforms 13. Both adjustments come from the same Gartner dataset and should be modeled together.
Worksheet table:
| Line | Per-location retainer | Account-level execution |
|---|---|---|
| Base fees | R + S (scales with site count) | R only (flat at footprint level) |
| Internal coordination | ~40% of T 10 | Reduced; sourced reductions of 65% campaign launch time and 3.1x content output 11 |
| Total marketing spend | Baseline | −22% 13 |
| Lead volume | Baseline | +31% 13 |
| Marginal cost of site 9, 10, 11 | Per-site fee + coordination | Marginal content production cost |
The CFO conversation should focus on two outputs from this worksheet: reclaimed coordination dollars and the CAC delta. Both numbers are derived from the operator's own data combined with sourced multipliers, meeting the standard for financial review. Further modeling, such as projected EBITDA contribution or payback period, can be built by the VP of Marketing on top of these anchors.
See How Leading Healthcare Operators Automate SEO for Consistent Patient Demand
Get a personalized walkthrough of autonomous, multi-location content pipelines that replace manual agency workflows—powered by data-driven strategy, medical accuracy review, and AI-driven publishing at scale.
The Account-Level Execution Model
Account-level execution replaces the per-location retainer by shifting the unit of work from individual sites to the entire footprint. The contract then focuses on outcomes for the entire patient acquisition program rather than a fixed content quota per location.
This model involves three key operational changes: content production, technical SEO, and paid media share a single performance dataset and publishing calendar, collapsing three parallel programs into one unified effort. Clinical accuracy review is integrated into the production workflow, addressing the failure point identified by the Duke disrupted-exchanges analysis 8. The marginal cost of adding new locations becomes only the cost of producing location-specific content on top of an existing service-line asset library, eliminating new per-site retainers.
Operators already using this model demonstrate its effectiveness. Forrester's 2024 evaluation found that healthcare organizations on unified execution platforms reduced campaign launch time by 65% and achieved 3.1x higher content output without increasing headcount 11. These figures apply to end-to-end multi-location programs. The publishing curve aligns with the demand curve because the production routing is fundamentally changed, not simply because work is expedited.
This replacement model is neither an in-house team scaled up nor an agency scaled down. It represents a different contract geometry: flat at the footprint level, integrated across disciplines, and priced against patient inquiry outcomes rather than ranking deliverables.
Measuring Patient Acquisition Lift with Account-Level Execution
The ultimate measure of success is a quantifiable lift in patient acquisition. McKinsey's healthcare marketing analysis reveals that operators employing integrated strategies and unified execution achieve 1.8x higher patient acquisition volume compared to peers running fragmented agency programs across multiple locations 12. This figure specifically measures patient acquisition volume for multi-location healthcare operators, not single-clinic pilots, and provides a compelling argument for VPs of Marketing to present to their CFOs.
This multiplier reframes the renewal discussion. The choice is no longer between the current medical SEO agency and a different one, but between a contract that bills per location and one that executes against the entire footprint, with patient inquiry attribution as the primary deliverable. Operators considering this shift can utilize the seven-point diagnostic and the consolidation worksheet with existing data before exploring platforms like Vectoron, which integrate content, technical SEO, and paid execution through a single account-level performance dataset.
Frequently Asked Questions
References
- 1.Status and Trends of the Digital Healthcare Industry - PMC - NIH.
- 2.What to expect in US healthcare in 2025 and beyond | McKinsey.
- 3.The impact of marketing strategies in healthcare systems - PMC - NIH.
- 4.Future of US healthcare: Gathering storm 2.0 or a golden age?.
- 5.Harmful Marketing: An Overlooked Social Determinant of Health - PMC.
- 6.Measuring the ROI of Digital Transformation in Health Care - Deloitte.
- 7.Patient experience guide, part 2: The top 5 priorities for providers.
- 8.Marketing in the Health Care Sector: Disrupted Exchanges and New ....
- 9.Selling the Return on Investment for Digital Health - PMC.
- 10.The Hidden Cost of Healthcare Marketing Coordination: Time Allocation & ROI Analysis.
- 11.Forrester Wave: Healthcare Marketing Execution & Automation Platforms 2024.
- 12.McKinsey: Digital Patient Acquisition & Healthcare Marketing Effectiveness.
- 13.Gartner: Marketing Operations Efficiency & Healthcare Cost Optimization.