
Key Takeaways
- Moving company SEO operates across three distinct surfaces—classic organic, local pack, and phone-lead handling—each with different economics that must work together to convert rankings into dispatched trucks.
- Close rate, not traffic volume, is the strongest argument for SEO budget: organic leads close at 14.6% versus 1.7% for cold outbound, an 8.6x differential 4, 8.
- Cost per booked job, not cost per lead, is the metric that exposes real channel value—a phone-weighted organic program can book jobs near $76 while paid search runs closer to $1,058 6.
- Multi-market operators should report per-territory unit economics and coordinate weekly between booked jobs, phone-lead close rates, and truck-day capacity rather than relying on blended CPL dashboards.
The Gap Between Rankings and Dispatched Trucks
A moving company can rank highly for local search terms and still miss revenue targets. Rankings generate sessions, sessions generate leads, but booked jobs only materialize when the lead handling process is efficient and crew capacity is available. Each stage of this funnel has its own conversion rate and potential for leakage.
Home services websites typically convert visitors to leads at 5–15% on average, with the lead-to-paying-customer conversion averaging 7.8% across the category 11, 1. This wide range in conversion rates highlights the significant variability in cost per booked job, even before considering seasonality or crew availability.
Moving company SEO should be viewed not just as a traffic channel, but as a demand signal that must align with available trucks, specific territories, and fluctuating close rates. Successful operators shift their reporting from sessions and impressions to cost per booked job by market, detailing the visitor-to-lead and lead-to-job conversion steps.
This article explores the distinct behaviors and economic models of three SEO surfaces, their connection to booked jobs, and common points of failure between inbound inquiries and scheduled crews.
Three SEO Surfaces, Three Different Economics
Classic Organic: Long-Tail Capture With a Conversion Ceiling
Classic organic search results, appearing below the map pack, are what most marketing directors refer to as "SEO." This surface captures long-tail informational queries ("how much does it cost to move a 3-bedroom house"), commercial investigation queries ("best long distance movers reviews"), and mid-funnel comparisons. However, it generally yields the lowest per-session conversion economics among the three surfaces.
Across home services, organic search lead-to-paying-customer conversion rates range from 0.7% to 5.9%, compared to a 7.8% average for all lead sources 1. This significant spread is often due to how "leads" are defined. Companies counting every newsletter signup or gated content download as a lead will see lower conversion rates, while those focusing on direct quote requests and inbound calls from organic sessions will report higher figures.
The conversion ceiling for classic organic is inherent. Informational queries attract researchers and comparison shoppers who are often weeks away from a move. These visitors require nurturing, not immediate dispatch. Misclassifying them as failed conversions can skew channel economics and divert budget from valuable top-of-funnel content.
To accurately assess classic organic, operators should segment by intent. Informational content should be measured by assisted conversions and returning visitor rates. Commercial pages, such as "[city] movers" templates, should be evaluated using the same booked-job metric as paid search. Blending these can lead to misleadingly low conversion rates and difficulty securing budget.
Local Pack and Maps: Where the Click Share Concentrates
The local pack operates with distinct economics, and treating it as an extension of classic organic is a common budgeting error in home services. When a local pack appears above organic results, which is frequent for commercial local moving queries, the click distribution on the page changes significantly.
Organic position #1 click-through rate (CTR) drops from 39.8% without a local pack to 23.7% when one is present, a 40.5% reduction 5. This lost click share shifts to the map listings. In similar home services verticals, 41% of leads originate from Google Maps listings, and businesses in the top 3 map positions capture 75% of clicks on that surface 10. While this data is from HVAC, the high-intent, geographically bounded, service-oriented query behavior is comparable to the moving industry.
Consequently, a moving company ranking #1 organically for "movers [city]" but at map position #6 loses approximately 40% of potential clicks to competitors not visible in its Search Console report. While Search Console might show increasing impressions and clicks, the dispatch board will not reflect a corresponding increase in jobs.
Local pack ranking requires a different approach than classic organic. It depends on Google Business Profile completeness, review volume and response rates, proximity to the searcher, category selection, and consistent NAP (Name, Address, Phone) citations across the web. Moving companies that view Maps as a secondary SEO task, rather than a dedicated workstream with ongoing optimization, miss out on the highest-CTR surface. This oversight further lowers the effective conversion of classic organic traffic, as potential customers are diverted to competitors' map listings.
Phone Leads: The Conversion Layer That Actually Books Jobs
The third crucial element is not a search surface itself, but the conversion layer between an organic session and a booked job. This is where SEO ROI is either realized or lost.
The funnel mathematics are clear: home services websites convert visitors to leads at 5–15% 11. This range highlights the impact of page design and call-to-action (CTA) placement. Once a lead is generated, the path diverges. Form fills go to email or CRM queues, while phone calls are handled by receptionists, call centers, or voicemail.
Phone leads from organic search convert to booked jobs at approximately 46% in comparable home services benchmarks 6. Form fills convert at a significantly lower rate. This difference is not merely about lead quality; it reflects deeper intent (callers are often ready to act faster) and speed-to-response (a live conversation begins immediately).
This is a major leakage point in the SEO-to-revenue chain, often overlooked in SEO reports. A moving company could double organic sessions but see flat lead volume if the visitor-to-lead conversion rate drops (e.g., from 12% to 6%). Conversely, maintaining sessions while improving phone answering to a trained inbound team with sub-30-second pickup can double booked jobs. Neither of these operational improvements would appear in a rankings report.
These three surfaces are not in competition but rather work in concert. Classic organic builds brand awareness and captures research-phase queries. Local pack rankings capture high-intent clicks. The phone-lead handling layer converts this captured demand into scheduled jobs. Weakness in any one area limits the effectiveness of the others, necessitating integrated reporting for budget justification.
The Rhetorical Hinge: Close Rate as the Real Argument for SEO Budget
Marketing directors often present traffic charts to justify SEO budgets, but traffic can be easily replicated by paid channels. A more compelling argument lies in close rates.
Organic search leads close at 14.6%, significantly higher than the 1.7% for cold outbound leads, an 8.6x differential in the same operational context 4, 8. This figure, while aggregating broad home services verticals and blending form fills with phone leads, serves as a valuable reference. Moving companies with strong phone handling often exceed this, while those relying heavily on forms and delayed callbacks fall below it.
This close rate data reframes the budget discussion. A COO focused solely on cost per lead might favor the cheapest form fill. However, when close rate is considered, the economics shift dramatically. A $47 organic lead closing at 14.6% results in a booked job costing approximately $322. In contrast, a $127 Google Ads lead closing at 12% yields a booked job costing around $1,058 6. This demonstrates that SEO, despite potentially higher initial lead costs, delivers more valuable leads.
The advantage of SEO leads stems from the visitor's formed intent. They actively searched for "movers [city]" or "long distance movers near me," bypassed sponsored results, and chose to engage with an organic listing. This self-selection provides a level of qualification that paid leads often lack upon entering the CRM. The 8.6x differential against outbound leads illustrates the extreme end of this dynamic.
Two caveats are important for this argument. First, the 14.6% figure applies to mature organic programs with effective lead handling. A new SEO engagement with unoptimized phone answering will not achieve this. Second, SEO conversion rates are under pressure, with 10 of 16 home services subcategories experiencing year-over-year declines averaging 14.96% 7. The close-rate advantage is not static; it improves with investment in the handling layer and erodes with neglect. Presenting this data without these qualifiers can undermine its credibility.
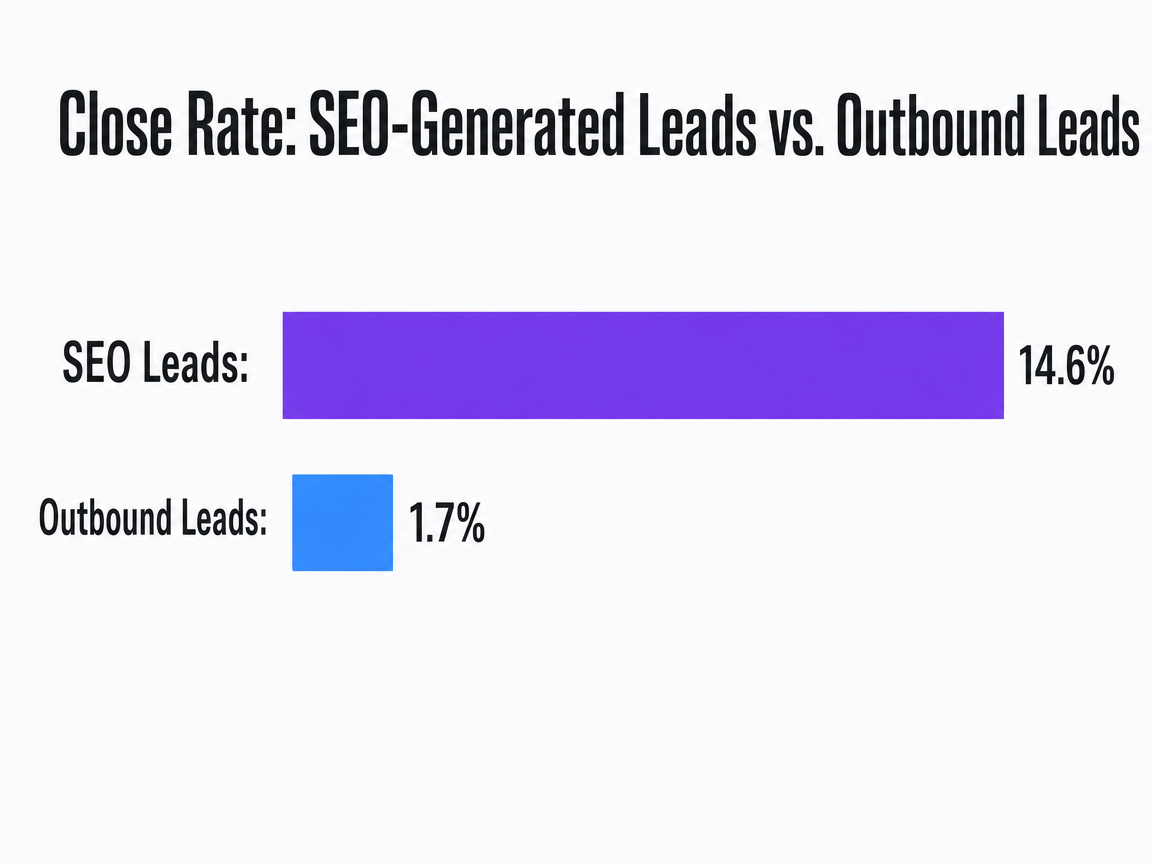 Close Rate: SEO-Generated Leads vs. Outbound Leads
Compares the close rate of leads generated from organic search (SEO) to those from cold outbound marketing in the home services industry.
Test moving company SEO strategies on real traffic
Experience live campaign results and track booked jobs before committing long-term.
Modeling Cost Per Booked Job, Not Cost Per Lead
Cost per lead, a common SEO metric, often misrepresents the channel's true value. Two leads costing $47 each might appear identical, but one could close at 46% because it was a phone call, while the other closes at 8% after sitting in a form queue overnight. The accurate measure is cost per booked job, which requires combining three key metrics.
The necessary inputs are readily available. Mature SEO programs in home services typically stabilize at $25–$45 per lead after about 12 months 7. Google Ads in the same context averages around $127 per lead 6. Home services websites convert visitors to leads at 5–15% depending on design and CTA placement 11. Crucially, the close rate split between phone and form leads—with organic phone leads converting to booked jobs at approximately 46%—determines the final outcome after lead capture 6.
The calculation reveals significant differences. A mature organic program with a $35 CPL and a phone-heavy lead mix closing at 46% yields a cost per booked job near $76. The same program, if form-heavy with a 15% close rate, would see a cost closer to $233. A paid search program with a $127 CPL and a 12% close rate results in a cost of roughly $1,058. Reporting only the initial cost per lead obscures these critical distinctions and weakens the case for SEO investment.
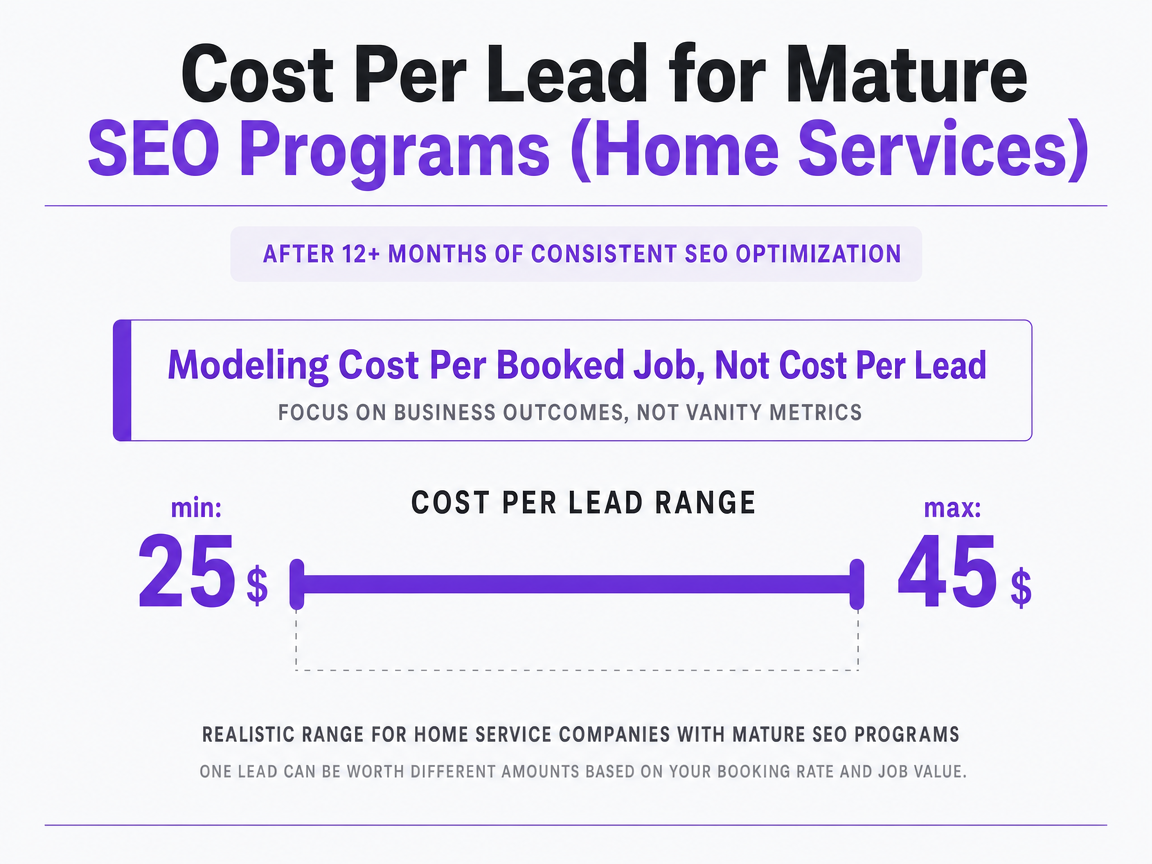 Cost Per Lead for Mature SEO Programs (Home Services)
Indicates the typical cost-per-lead range for home service companies after 12 or more months of consistent SEO optimization.
The Seasonality-Capacity Mismatch SEO Cannot Solve Alone
SEO's compounding growth curve does not align with seasonal demand peaks. A well-managed local SEO program in home services can reduce CPL from around $180 to under $70 within 12 months, achieving 10:1+ ROAS over 18 months 10. While this makes SEO a strong contender in channel mix discussions, it cannot independently resolve operational challenges on a moving company's dispatch board.
This mismatch has two primary aspects. First, residential moving demand is concentrated between May and September, while SEO requires a rolling twelve-month build-up. A program launched in February will not reach its optimal cost-per-lead until the following January, missing the immediate peak season. Second, spatial constraints mean a high-ranking market with four trucks might generate more qualified leads than it can handle in June, while another market two states away operates at 60% capacity.
These are not content problems. Publishing more service-area pages will not add trucks in July, and pausing SEO in October will erode rankings for the next spring. The solution lies in coordination, not just SEO tactics.
Three strategic moves are essential:
- Peak-season overflow should be managed by paid search and Local Services Ads (LSAs), funded with a budget line that accepts a higher cost per booked job, as marginal jobs are still profitable at capacity.
- Off-peak SEO investment must be justified by its compounding effect, recognizing that November's content and Maps work contributes to June's lower CPL.
- Per-market capacity signals—booked jobs versus available truck-days—should inform lead generation weekly, allowing overheated territories to throttle paid spend and underutilized ones to increase it.
SEO provides the baseline demand, but seasonal peaks require a coordinated, multi-channel approach.
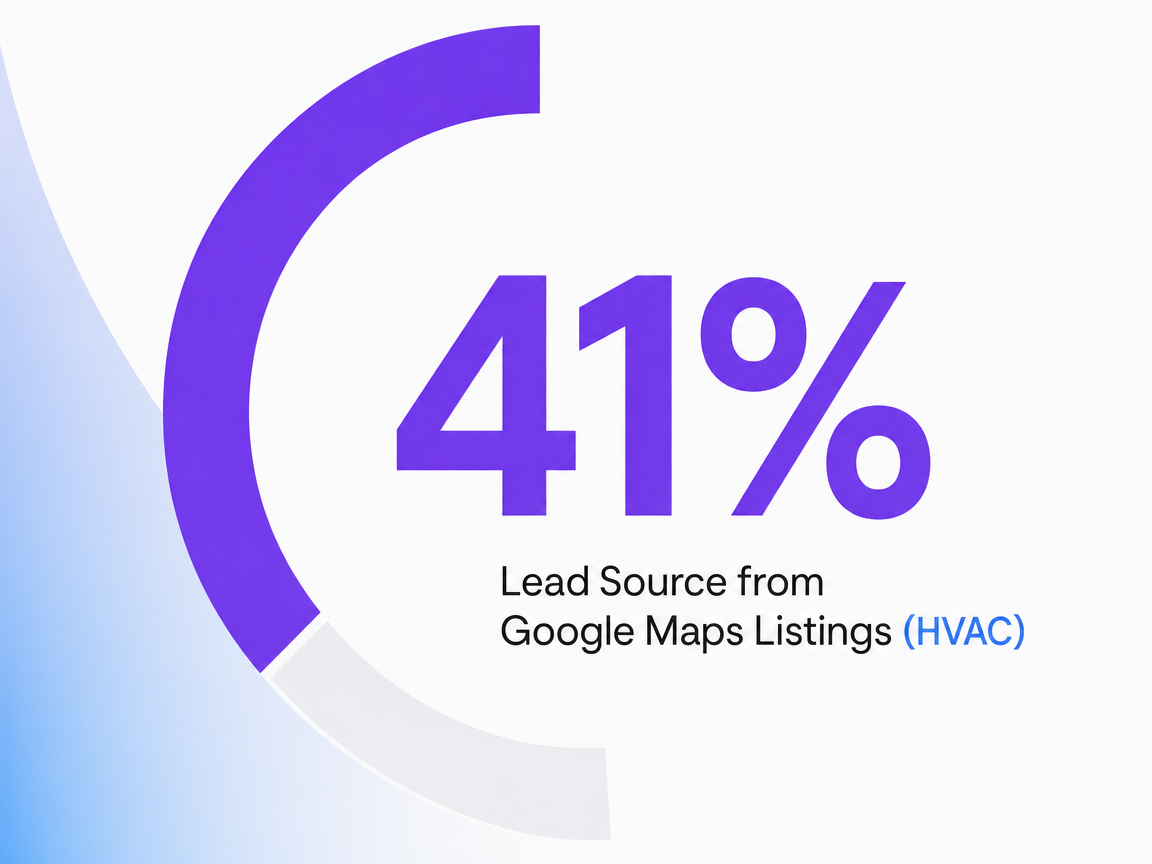 Lead Source from Google Maps Listings (HVAC)
Lead Source from Google Maps Listings (HVAC)
If You Manage Multiple Markets: Per-Territory Unit Economics
Operators managing multiple markets face a reporting challenge distinct from single-location businesses. Blended CPL across a portfolio obscures the economic realities of individual markets: a mature market generating booked jobs at a low cost versus a ramping market where SEO leads are still expensive. A single blended number provides no actionable insights.
The most effective lens for portfolio review is cost per booked job by market, derived from four inputs:
- Visitor-to-lead conversion (5–15% across home services) 11
- Phone-lead close rate (~46% for organic phone leads) 6
- Blended organic close rate (14.6% as a ceiling reference) 4
- CPL (mature programs at $25–$45; ramping programs higher) 7
The following table illustrates the significant differences within a single portfolio.
| Market | Monthly Organic Sessions | Visitor-to-Lead Rate | Leads/Month | Close Rate | Booked Jobs/Month | CPL | Cost Per Booked Job |
|---|---|---|---|---|---|---|---|
| Mature (12+ months, phone-weighted) | 8,000 (operator variable) | 10% 11 | 800 | 46% 6 | 368 | $35 7 | ~$76 |
| Ramping (month 4, form-weighted) | 2,200 (operator variable) | 6% 11 | 132 | 14.6% 4 | ~19 | ~$110 (operator variable, above mature band 7) | ~$753 |
The wide disparity is key. The same retainer structure and three-surface framework can result in a 10x difference in cost per booked job between a mature, phone-weighted market and a ramping, form-weighted one. The mature market's lower costs are not accidental; they result from optimized visitor-to-lead conversion, staffed phone handling, and strong Maps rankings. The ramping market lacks these elements, and simply publishing more service-area pages will not close the gap in the short term.
Allocation decisions should be based on this market-specific data, not blended averages. Mature markets should invest further in Maps defense and phone handling to protect their low marginal cost per booked job and counter competitive erosion. Ramping markets should prioritize improvements in the visitor-to-lead layer—page templates, CTA placement, and phone number visibility—as CPL will decrease over time, but close rates require active optimization. Reporting cost per booked job by market, with detailed intermediate steps, provides the clarity a COO needs for portfolio budget reviews.
See How Data-Driven SEO Converts Searchers Into Booked Moves
Request a custom analysis of your moving company’s search performance. Review territory-level keyword gaps, booking attribution, and workflow automation benchmarks—built for agencies and multi-location service brands.
Why Reported Conversion Rates Are Falling and What to Do About It
The decline in organic conversion rates is a widespread trend, not an isolated issue. Across 16 home services subcategories, 10 experienced year-over-year declines, averaging 14.96% 7. Moving operators observing similar trends are likely seeing a category-wide erosion that requires diagnosis at the lead handling layer, rather than solely at the ranking layer.
Three main factors contribute to this decline:
- Shifts in query mix mean informational content attracts earlier-stage researchers who previously might have been captured by paid results, leading to lower intent depth.
- Response time expectations have compressed; a quote request left unanswered for hours converts at a much lower rate than it would have a few years ago.
- The increasing prevalence of form-heavy sites exacerbates the decline, as form submissions inherently convert worse than phone calls, and mobile users increasingly default to typing.
The operational response must be precise. Isolate phone-lead conversion from form-lead conversion in reporting to prevent the strong ~46% phone close rate from adjacent home services benchmarks 6from being diluted by poorer form performance. Ensure phone answering provides sub-30-second pickup during business hours and regularly audit after-hours routing. Treat any declining conversion rate as a lead-handling issue first, before escalating it to an SEO retainer discussion.
Coordinating SEO Output With Dispatch: The Operator's Job
SEO generates demand, and the dispatch board fulfills it. The crucial work connecting these two—determining whether a $76 cost per booked job holds or rises to $250—falls to the marketing director, not just an SEO retainer.
Weekly coordination is the key mechanism. An integrated view should include booked jobs by market, phone-lead close rate by market, and available truck-days for the next two weeks. If a territory's utilization exceeds 90% for a rolling seven-day period, paid search and LSAs in that market should be throttled, with overflow routed to sister markets or held for premium rates. If utilization drops below 70%, paid channels can be expanded while the underlying SEO continues to compound. This loop, though simple, is often not implemented.
The shift in reporting makes this coordination possible. Cost per booked job by market, with detailed visitor-to-lead and phone-lead close rates, replaces the blended CPL dashboard that may have lost credibility. Platforms exist to facilitate this loop across content, paid, and call intelligence within a single workflow. The choice of channel is secondary; operator discipline in coordination is what bridges the gap between rankings and dispatched trucks.
Frequently Asked Questions
References
- 1.2026 Benchmarks for Lead Conversion Rates in Home Services.
- 2.Contractor Marketing Benchmarks (Synthesis Study).
- 3.Home Services Marketing Statistics: Ads, SEO & Leads (2026).
- 4.Choose an SEO Agency for Home Services (2026).
- 5.Where Do People Actually Click on Home Services Search Results?.
- 6.HVAC SEO Statistics: 2026 Contractor Benchmarks.
- 7.Local SEO for Home Service Companies: What Actually Moves the Needle.
- 8.HVAC Industry Market Context.
- 9.SEO vs PPC for Home Service Companies: Where to Put Your Money.
- 10.HVAC Digital Marketing Stats (2026) | Web Tonic™.
- 11.Home Service CPL Benchmarks 2026: $30–$500 by Trade.