
Key Takeaways
- Freeze baseline configuration in Search Console once—property type, search type, comparison windows, and opening snapshots—so monthly deltas reflect real performance change rather than filter drift 1, 2, 4, 10.
- Never report sitewide average position as a standalone number; segment by query cluster, page, device, country, and search appearance so clients see movement on revenue pages, not noise 1.
- Diagnose movement using the 16-month lookback sorted by Clicks Difference, then assign each affected page a one-line verdict: seasonality, demand, technical, algorithmic, or SERP presentation 3, 10.
- Reconcile Search Console, GA4, and CRM as three distinct systems and disclose the clicks-to-sessions variance as a percentage, because the two were never designed to agree 1, 5.
- Report Core Web Vitals as a field-measured user-experience indicator against the 75th-percentile threshold, not as proof of ranking gains, since Google refuses that causal claim 6, 7, 9.
- Lead the client narrative with reconciled ROI and disclosed variance, then tie each position claim to its filter and each traffic change to a diagnostic verdict 1, 3, 5.
- QA every report against baseline filter conventions, confirm the variance line is present, label provisional recent-data figures, and file a methodology sheet with delivery 1, 2, 4, 5.
- Scale the workflow by templating the mechanical steps and automating data assembly so analyst hours shift from pulling data to writing the diagnostic verdict and narrative 3, 5.
Why rank reporting breaks at the agency scale
Most agency SEO leads can pull a ranking report in under five minutes. The problem is not the pull. It is what happens when thirty of those reports have to ship in the same week, each one defensible under a client CFO's questioning, each one reconciling pre-click visibility against post-click revenue, and each one honest about what the data cannot prove.
Search Console gives the agency four metrics to work with: clicks, impressions, click-through rate, and average position 1. Average position is where the trouble starts. It is an aggregate across queries, pages, countries, devices, and search appearances, and clients routinely read it as a scoreboard. A sitewide figure moving from 14.2 to 12.8 says almost nothing about whether the money pages gained ground or whether a long tail of irrelevant impressions dragged the number around.
The second fracture appears when the account lead tries to connect visibility to revenue. Search Console measures what happened before the user arrived; Google Analytics measures what happened after 5. The two systems were never designed to agree, and clients who expect clicks to equal sessions will interpret the normal variance as either an SEO failure or an analytics failure. Neither is true, but someone has to explain it on every call.
Then AI Overviews and AI Mode appearances fold into the Web search type without a separate channel, obscuring where the visibility actually came from 10. The result is a reporting surface that looks simple and behaves adversarially. The seven steps that follow treat rank reporting as a reconciliation workflow built to survive scrutiny, not a screenshot pasted into a template.
Defining rank before the first screenshot
Before any analyst opens Search Console, the agency needs a written definition of what the word rank will mean inside its reports. Without that, every account lead renders the number differently, and the client's interpretation drifts across quarters.
The operative definition should start from the four metrics Search Console actually reports: clicks, impressions, click-through rate, and average position 1. Position is the one that requires the tightest guardrails. It is an average across every query, page, country, device, and search appearance in the filter set, which means a sitewide figure of 11.4 can describe a portfolio where the top ten commercial queries sit at position 3 and a long tail of brand-adjacent impressions sits at position 42. Reports that print the aggregate without the segmentation train clients to react to noise.
Three operating rules keep the definition defensible:
- Position is reported alongside the filter that produced it, never as a standalone sitewide number.
- The Web search type is treated as the reporting surface for AI Overviews and AI Mode exposure, because Google folds those appearances into the same bucket as classic blue-link results 10.
- The recent-data view is permitted for weekly pulse checks but labeled provisional, so clients do not treat a seven-day read as a final number 2.
Written once, this definition travels with every account. The analyst stops relitigating methodology on each call, and the account lead has a one-paragraph answer when a client asks what the ranking number actually represents.
Step 1 — Set the baseline inside Search Console
The baseline is a one-time act of methodology, not a monthly task. The analyst configures the property once, documents the filter conventions, and freezes them so every subsequent report compares against the same measurement surface. Without that discipline, month-over-month deltas reflect filter drift as often as they reflect real performance change.
Four configuration decisions belong in the written baseline:
- Confirm the property type (domain versus URL-prefix) and record which subdomains and protocols it covers, because Search Console only reports Google Search activity and will not account for other engines, direct traffic, or offline leads 4.
- Set the default search type to Web, since AI Overviews and AI Mode appearances are folded into that bucket rather than broken out separately 10.
- Lock the comparison window conventions: a 28-day trailing view for monthly reports, a 16-month view reserved for diagnostic work, and the recent-data view flagged provisional on any weekly pulse 2.
- Capture the opening snapshot of clicks, impressions, CTR, and average position at the property level and at the top-20 query and top-20 page level 1.
That snapshot becomes the reference point every account lead cites when a client asks what changed. The analyst stops rebuilding context each month and starts reporting against a fixed line.
Step 2 — Segment position before it reaches the client
The sitewide average position number is the single most dangerous figure in a client report. It compresses every query, page, country, device, and search appearance into one average, and the compression hides the only signal the client actually cares about: whether the pages that drive revenue are gaining or losing ground. Segmentation is the step that converts a misleading aggregate into a defensible read.
The Search Console Performance report exposes four core metrics — clicks, impressions, CTR, and average position — across the dimensions that make segmentation possible: query, page, country, device, search appearance, and date 1. A property reporting an average position of 11.6 can decompose into money-query clusters sitting at position 4.2 on desktop in the primary market, position 7.8 on mobile in the same market, position 22 on mobile in secondary geographies, and a long tail of brand-adjacent impressions sitting beyond position 30. The 11.6 is arithmetically correct and operationally useless.
The analyst's job is to decide which cuts matter for the account and freeze them into the report template. Four segmentations carry most of the weight:
- Query clusters separate commercial intent from informational and brand-adjacent impressions, so a client sees position movement on the terms tied to pipeline rather than on terms that will never convert.
- Page segmentation isolates the twenty to thirty URLs that produce the majority of qualified traffic, which is where position change has revenue consequence.
- Device splits mobile from desktop, because mobile SERPs frequently show a different result set and a different position for the same query.
- Country filtering removes impressions from markets the client does not serve, which is a common source of aggregate drift when a page picks up incidental international exposure.
Search appearance is the fifth cut, and it is the one most agencies still skip. Filtering by appearance type separates classic blue-link positions from featured snippets, image results, video results, and other enhanced treatments, each of which behaves differently in CTR and in what a client reasonably calls a ranking.
The deliverable is not a longer report. It is a shorter one that leads with the segmented view and relegates the sitewide average to a methodology footnote. When a client asks why rank moved, the account lead points to a specific cluster on a specific device in a specific market, and the conversation moves from debating the number to deciding what to do about it.
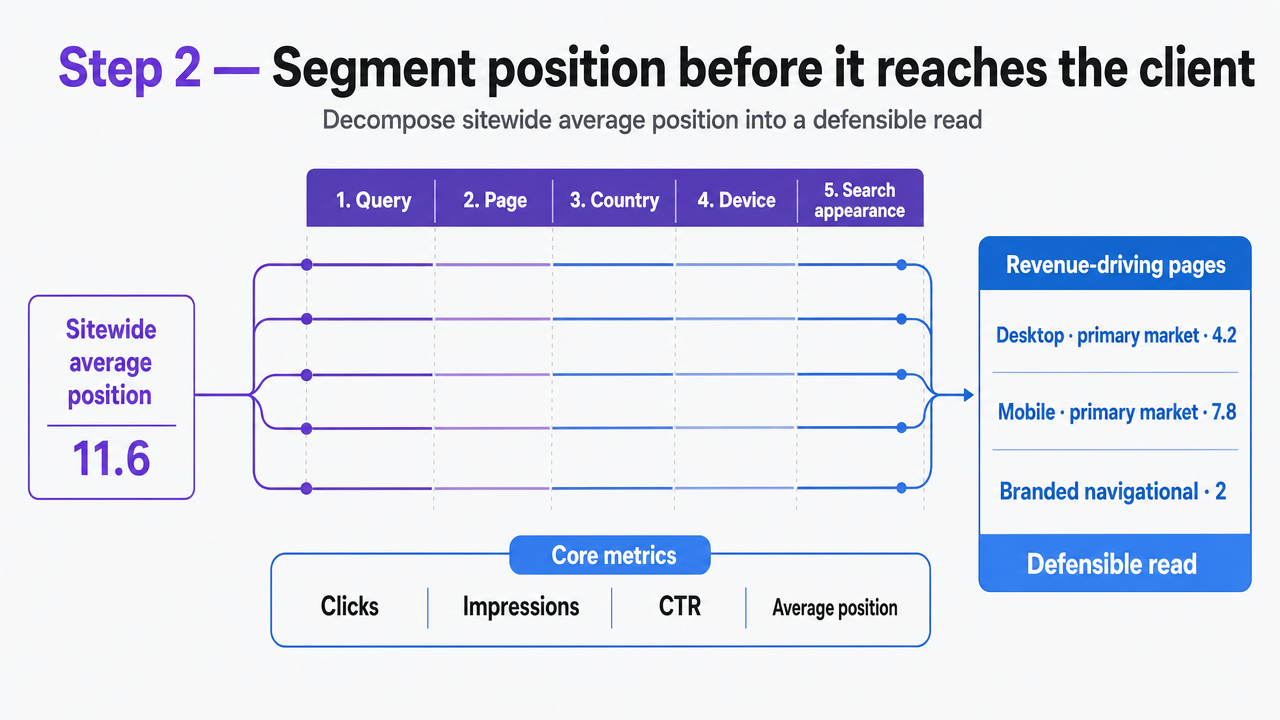 Visualize the five segmentation cuts the article prescribes for decomposing sitewide average position into a defensible read
Test Live Site Ranking and Client Reporting
Validate ranking insights and export real ROI reports using your own client data before you commit.
Step 3 — Diagnose movement with the 16-month lookback
Segmentation tells the account lead where position moved. Diagnosis tells them why. The two are different jobs, and conflating them is how agencies end up blaming an algorithm update for what was a seasonal demand swing or a template change that broke internal linking.
The diagnostic workflow starts with the 16-month comparison window. Google's own guidance on investigating traffic declines recommends pulling the full 16 months of Search Console history and sorting by Clicks Difference to surface the pages carrying the largest losses 3. That single sort collapses the problem from a sitewide anxiety into a short list of URLs the analyst can actually inspect. Ten pages usually account for the majority of the delta; the rest is noise.
From that short list, the analyst walks each candidate against a fixed set of causes before writing a conclusion:
- Seasonality is checked against the prior-year window in the same report, because a 20% click drop in late August on a tax-planning page is not an SEO event.
- Demand change is checked against Google Trends for the query cluster, which separates a page losing share from a category losing searches.
- Technical regression is checked against the page's crawl status, index coverage, and template history.
- Algorithmic movement is checked against the date of a known Google update aligned to the inflection point.
- SERP-presentation change is checked by inspecting the live result for the top queries, where an AI Overview, a new featured snippet, or an expanded local pack may have compressed blue-link real estate without any ranking change at all 10.
None of these causes is diagnosed in isolation. The deliverable is a one-line verdict per affected page — seasonality, demand, technical, algorithmic, or SERP presentation — with the supporting evidence attached. Clients stop hearing hedged narratives and start seeing a short table of causes they can act on.
Step 4 — Reconcile GSC, GA4, and CRM into one ROI view
Reconciliation is where rank reporting becomes revenue reporting, and it is also where most agency decks quietly fail. The failure is rarely arithmetic. It is methodological: the account lead presents a single blended number — organic sessions, assisted conversions, pipeline influenced — and the client assumes that number carries the same precision as a paid-media report. It does not, and pretending otherwise is how an agency loses a renewal the first time a client CFO audits the math.
The honest model treats the ROI view as three systems stitched together, each measuring a different stage of the funnel, each with its own definitions and its own blind spots:
Search Console : Reports pre-click activity: impressions, clicks, CTR, average position, and the queries that produced them 1.
Google Analytics : Reports post-click activity: sessions, engaged sessions, key events, and conversions 5.
CRM : Reports what the business actually sold: qualified leads, booked appointments, closed revenue, contribution margin.
The three were never designed to agree, and the reconciliation step is the act of showing the client where they overlap, where they diverge, and why the divergence is expected.
The point the analyst must make early and in writing is that clicks and sessions are not supposed to match. Google states the two systems use different definitions, processing, filters, and attribution logic, which is why a page can show 1,240 Search Console clicks and 1,080 GA4 organic sessions in the same window without either number being wrong 5. Pre-click metrics count appearances in Google's result set and user clicks from those results. Post-click metrics count sessions that survived the handoff, loaded the page, and triggered the measurement script. The gap between them is a measurement artifact, not a performance signal.
GSC pre-click metrics (impressions, clicks, CTR, average position, queries) versus GA4 post-click metrics (sessions, engaged sessions, key events, conversions). Clicks and sessions are not expected to match because the two systems use different definitions, processing, and attribution logic 5.
Once the two-system contrast is on the page, the CRM overlay does the commercial work. The analyst joins GA4 key events to CRM lead and revenue records by timestamp, landing page, and session identifier, then reports three figures the client can act on: qualified leads attributable to organic sessions, close rate on those leads, and revenue or contribution margin produced. The reconciled ROI view carries one disclosed variance line — the delta between GSC clicks and GA4 organic sessions for the same period — expressed as a percentage, not hidden. Clients who see the variance disclosed stop treating it as a problem; clients who see it concealed treat every future number with suspicion.
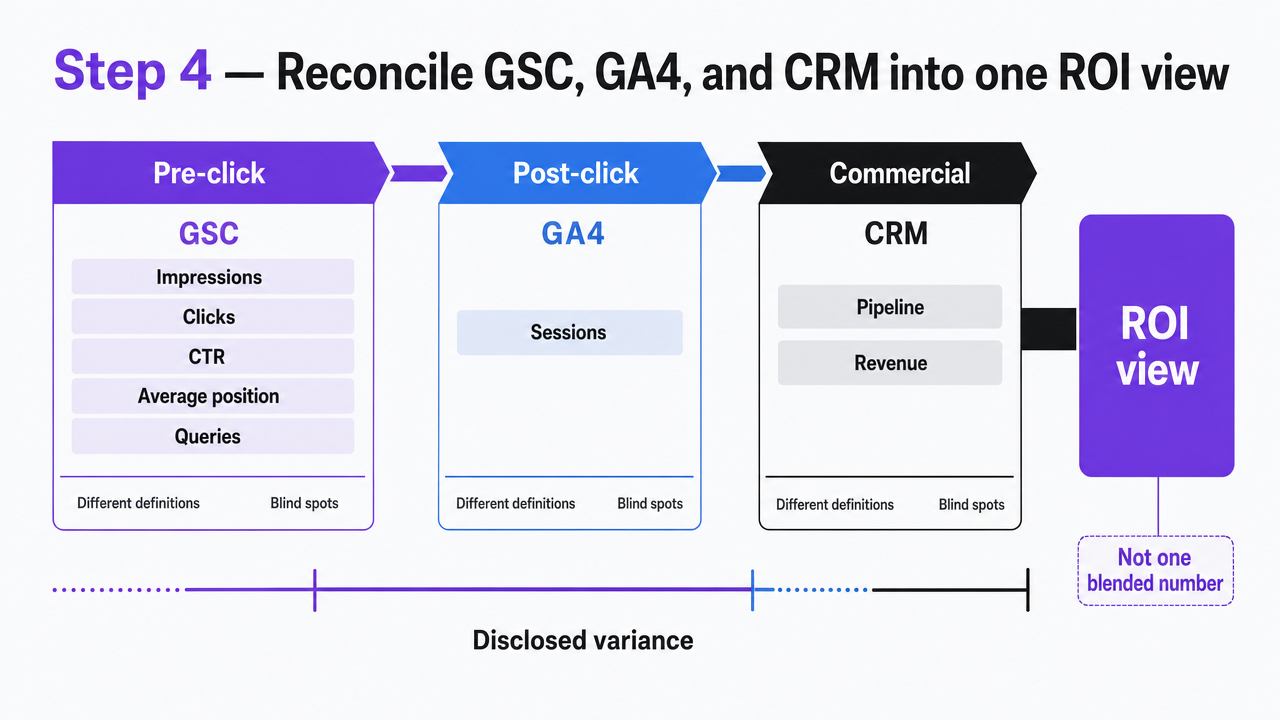 Visualize the three-system reconciliation funnel described in the section, showing pre-click, post-click, and commercial stages with the disclosed variance line
Step 5 — Report technical health without overclaiming
Technical health belongs in the report, but not in the role most agencies assign it. Core Web Vitals are user-experience indicators, not a ranking proof. Google states plainly that there is no single page-experience signal and that good Core Web Vitals do not guarantee top rankings 7. The account lead who presents a green LCP score as the reason a page moved from position 8 to position 4 is building a narrative the next algorithm shift will dismantle.
The honest framing treats technical health as a contributing indicator reported against field data, not lab scores. Core Web Vitals — Largest Contentful Paint, Interaction to Next Paint, and Cumulative Layout Shift — are measured at the 75th percentile across mobile and desktop using real-user monitoring 8. Recommended targets are LCP within 2.5 seconds, INP below 200 milliseconds, and CLS below 0.1 6. Lab tools are acceptable for diagnosis; they are not acceptable as the number the client sees.
A page is considered to meet Core Web Vitals recommended thresholds when 75% of visits meet the "good" threshold for each metric, measured through real-user monitoring across mobile and desktop 9.
That 75% threshold is the single technical KPI the report should carry 9. It is specific, field-measured, and client-legible. The analyst reports the share of the client's top-twenty revenue pages passing the threshold on each metric, movement against the prior period, and the pages that regressed. Nothing more.
The language around the number matters as much as the number. Technical improvements are reported as experience gains that reduce friction for users who already arrived, with any correlation to position movement described as supporting rather than causal. Clients who hear that distinction once stop asking for a Lighthouse score on every call, and the agency stops owning a promise Google has already refused to make.
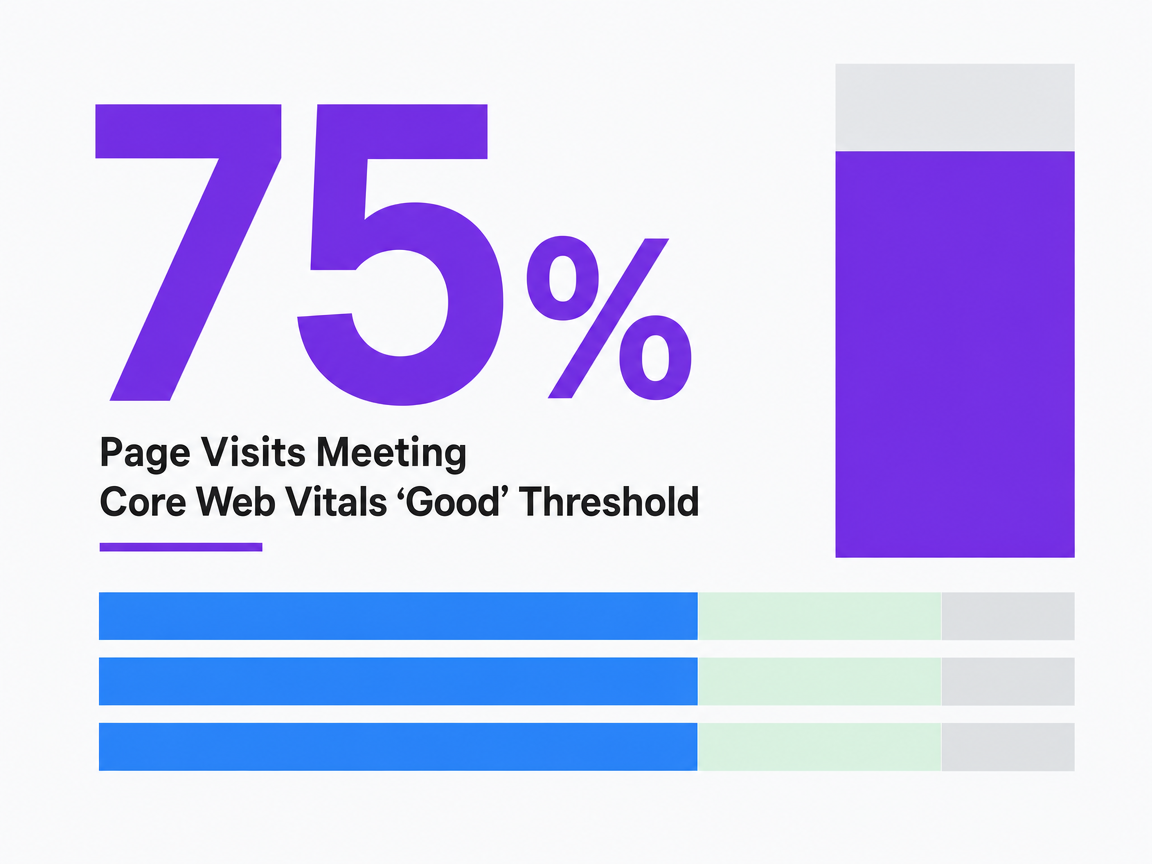 Page Visits Meeting Core Web Vitals 'Good' Threshold
Page Visits Meeting Core Web Vitals 'Good' Threshold
Streamline Site Rank Tracking and Deliver Transparent ROI Reporting
Connect with specialists to see how leading agencies use unified data and workflow automation to scale rank monitoring and client reporting—without increasing headcount or losing visibility into performance.
Step 6 — Write the narrative the account lead will defend
The numbers are now defensible. The narrative around them is where the account lead either earns another quarter or hands the client a reason to request a second opinion. Most monthly decks fail at this step because the analyst writes a chronology of activity — pages published, links acquired, technical fixes shipped — and leaves the client to connect activity to outcome. The client cannot make that connection, and the agency owns the silence.
The defensible narrative inverts the structure. It opens with the reconciled ROI figure, states the disclosed variance between pre-click and post-click systems, and only then describes the position movement, segmentation cuts, and diagnostic verdicts that produced the result 5. Activity appears last, framed as the cause of the outcome rather than the subject of the report.
Three disciplines keep the narrative durable:
- Each position claim is tied to a specific query cluster, page set, device, and country filter rather than to the sitewide average 1.
- Each traffic change carries a one-line verdict — seasonality, demand, technical, algorithmic, or SERP presentation — drawn from the diagnostic step 3.
- Each ROI figure names the attribution window and the systems joined to produce it.
The account lead who writes to this standard stops defending the report and starts defending the recommendation it leads into.
Step 7 — QA, deliver, and lock the methodology
The final step is the one most agencies treat as a formality and the one most likely to produce a defensible report. QA is not a proofread. It is a methodology audit that confirms every number in the deliverable traces back to a filter the analyst can reproduce six months later.
Four checks belong in the standing QA pass:
- The property, date range, country, and device filters match the baseline conventions set during Step 1, so month-over-month deltas reflect performance change rather than filter drift 4.
- The sitewide average position does not appear anywhere outside the methodology footnote; every position claim carries its query cluster, page set, and device filter 1.
- The disclosed variance line between Search Console clicks and GA4 organic sessions for the reporting window is present and expressed as a percentage 5.
- Any recent-data figure pulled inside the final seventy-two hours of the window is labeled provisional 2.
Delivery locks the methodology to the account. The analyst files the report alongside a one-page methodology sheet — filter conventions, attribution window, systems joined, variance disclosed — and references it on the client call. The next month's analyst inherits a documented surface rather than a blank Search Console view, and the account stops renegotiating what rank means on every renewal.
Scaling the seven steps across a book of accounts
A seven-step process is only an asset if it survives contact with a portfolio. One analyst running the full workflow for one marquee account can produce a report that wins renewals. Thirty analysts running thirty variants across thirty accounts produces drift, inconsistent methodology, and a QBR surface no head of SEO can defend. The scaling problem is not whether the steps work. It is whether they execute identically across the book without burning senior hours on every deliverable.
Two levers decide the economics:
- Templating: the baseline conventions, segmentation cuts, diagnostic checklist, reconciliation schema, and QA pass are codified once and reused on every account, so the junior analyst inherits a methodology rather than reconstructing it.
- Automation of the mechanical steps — pulling the segmented Search Console views, joining GA4 key events to CRM records, flagging the pages with the largest Clicks Difference over the 16-month window, generating the disclosed variance line — so the analyst spends their hours on diagnosis and narrative rather than on data assembly 3, 5.
The sections below unpack both levers against a working book of accounts.
Analyst-hours economics: manual versus templated delivery
The agency scope shifts here from a single account to a book of thirty. A manual pass through the seven steps — baseline reconfirmation, segmentation, diagnosis, reconciliation, technical check, narrative, QA and delivery — typically consumes four to six analyst hours per account per month once the deliverable meets the standard this article describes. Across thirty accounts, that is 120 to 180 analyst hours before any strategy work begins.
Templating the mechanical steps compresses the hour profile without compressing the methodology. The variables belong to the agency, not to this article:
| Workflow stage | Manual hours per account | Templated hours per account |
|---|---|---|
| Baseline reconfirmation 4 | 0.5 | 0.1 |
| Segmentation pulls 1 | 1.0 | 0.2 |
| 16-month diagnostic sort 3 | 1.0 | 0.3 |
| GSC/GA4/CRM reconciliation 5 | 1.5 | 0.4 |
| CWV field-data check 9 | 0.3 | 0.1 |
| Narrative and QA | 1.2 | 0.9 |
| Total | 5.5 | 2.0 |
At a loaded analyst rate the agency already knows, the delta between 5.5 and 2.0 hours per account per month, multiplied by the book size, is the margin recovered. The methodology does not change. The hours spent assembling the data do.
Where AI-coordinated execution enters the workflow
The hour delta above assumes templating and scripts. An AI marketing execution platform with specialist strategists and an approval workflow pushes further by handling the data assembly, the segmentation cuts, the diagnostic sort against the 16-month window, and the variance disclosure as a standing output, then routing a draft reconciled view to the account lead for sign-off before anything reaches the client 3, 5. The analyst inherits a QA surface, not a blank Search Console view, and spends their remaining hours on the diagnostic verdict and the narrative — the two parts of the workflow where judgment actually earns the fee.
That is the operating model Vectoron is built around: specialist strategists that read the signal, rank the priorities, and prepare the work; a Command Center that routes every recommendation for human approval; and execution that runs only after sign-off, so the agency scales the seven steps across the book without scaling headcount or surrendering oversight.
Frequently Asked Questions
References
- 1.A deep dive into Search Console performance data filtering and limits.
- 2.An improved way to view your recent performance data in Search Console.
- 3.Debugging drops in Google Search traffic.
- 4.How To Use Search Console.
- 5.Using Search Console and Google Analytics Data for SEO.
- 6.Understanding Core Web Vitals and Google search results.
- 7.Understanding page experience in Google Search results.
- 8.Web Vitals.
- 9.Getting started with measuring Web Vitals.
- 10.AI Features and Your Website | Google Search Central.