
Key Takeaways
- Organic and paid search reinforce each other asymmetrically, with organic exposure lifting paid utility 3.5 times more than paid lifts organic, so scoring them on the same per-click rubric misreads the budget math 1.
- Click distribution collapses toward the top of the SERP, with 97% of clicks landing on the first page, meaning query-cluster depth on terms already ranking five through fifteen returns more than net-new long-tail content 4.
- AI Overviews compress clicks most on shallow informational queries while mid-funnel and commercial queries retain value, so scorecards should add SERP-feature presence and assisted conversions alongside sessions and rankings 6.
- Multi-location operators gain more from consolidating fragmented SEO, content, local, and paid vendors into one signal-to-execution loop than from any single retainer cut, since coordination overhead outweighs the line-item spend.
Why Marketing Leaders Are Rebudgeting Search From the Top Down
Search remains the substrate of B2C and B2B discovery, and the budget conversations around it have finally caught up with that reality. CFOs are asking harder questions about organic spend. CEOs want to know what AI-generated summaries do to the pipeline. And marketing VPs who own revenue are being asked to defend organic search alongside paid, social, and outbound — often against per-click ROI math that flatters paid and penalizes anything with a longer payback curve.
That framing is the problem. Research on search interdependence shows organic and paid do not compete on equal ground; they influence each other asymmetrically, with organic exposure lifting paid utility more than the reverse 1. Forrester frames the implication plainly: SEO drives traffic, leads, and revenue for any company with a website, and its returns compound across the customer lifecycle rather than resolving inside a single click 8.
The marketing leaders rebudgeting search from the top down are doing three things at once. They are separating SEO from the per-click scoreboard it keeps losing on. They are treating organic as the layer that makes every other channel cheaper. And they are consolidating the fragmented execution stack — separate content, technical, local, and reporting vendors — into a single operating loop that can actually be measured. The rest of this piece lays out that system, section by section.
The Asymmetric Case for Organic in a Paid-Heavy Mix
What the Interdependence Research Actually Shows
The cleanest evidence against a per-click comparison of paid and organic comes from a study that measured both channels on the same keyword sets, with click and conversion data from a large retailer. The mean click-through rate was 6.6% on paid listings and 2.77% on organic, and mean profit per paid click ran 3.1 times higher than mean profit per organic click 1. Read alone, those numbers make paid look like the obvious winner.
The same dataset, however, models the interaction between the two placements. Organic click-throughs and paid click-throughs show positive, mutually reinforcing effects — but the reinforcement is not symmetric. Organic clicks lift the utility of paid clicks 3.5 times more strongly than paid clicks lift the utility of organic clicks 1. In plain terms: when a brand holds a strong organic position on a query, its paid ad on that same query works harder. When it buys a paid ad without an organic anchor, the organic listing barely benefits in return.
Two limits are worth naming in the same breath. The study is retail-focused with transactional intent, not B2B services, and it predates AI Overviews. The direction of the effect, though, is what matters for budgeting. Paid search converts efficiently on the transaction, and organic quietly raises the ceiling on every other query it touches. A follow-up study on the same data stream found organic performance is more responsive to keyword-level content variables than paid is — organic rewards content investment more directly 2. That is the empirical case for treating SEO as substrate rather than as a parallel channel competing for the same dollar.
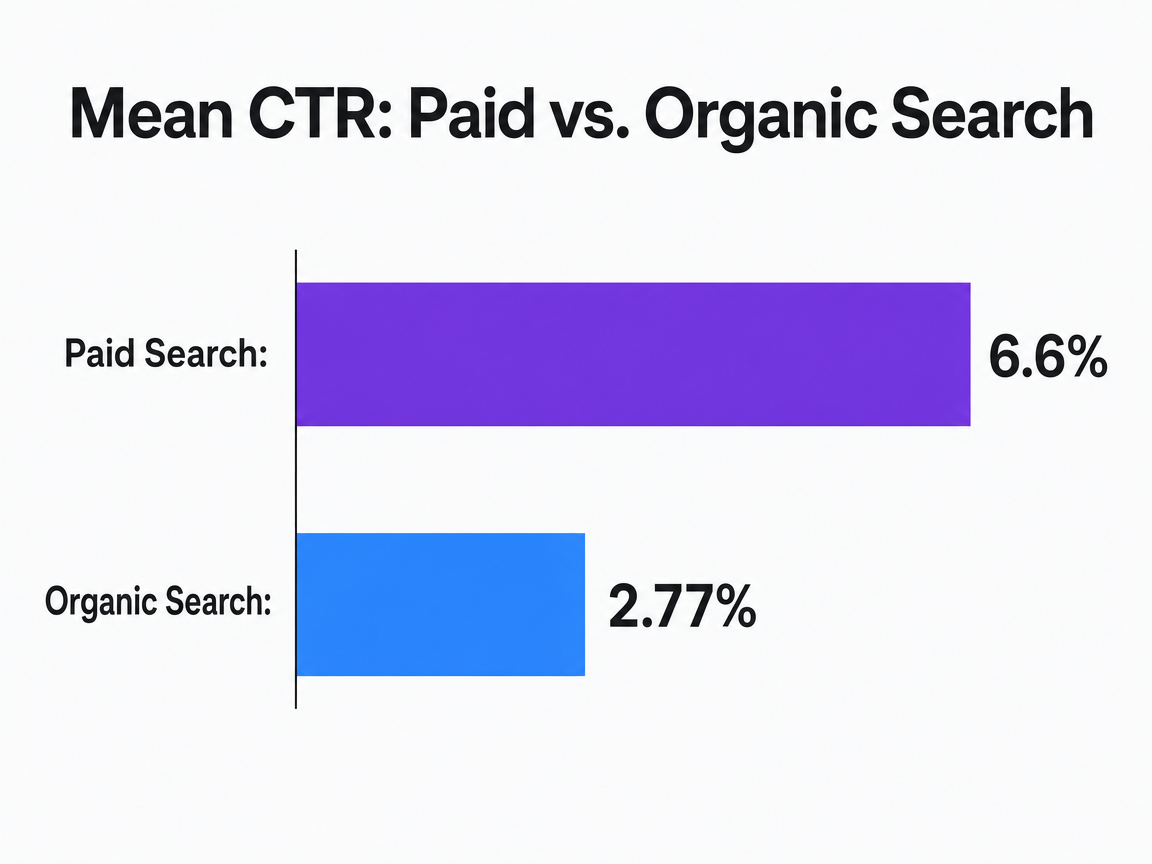 Mean CTR: Paid vs. Organic Search
Comparison of mean click-through rates, showing paid search ads have a higher average CTR than organic search listings in the studied context.
Reallocating Budget Without Cannibalizing Paid
The wrong response to the interdependence data is to defund paid search. The right response is to stop scoring the two on the same rubric.
Paid search should be measured on what it does well: closing high-intent queries with predictable unit economics. Organic should be measured on the compounding effects paid cannot generate — branded query volume, non-brand ranking coverage, assisted conversions across the funnel, and the lift it creates on paid CTR and quality score for queries where both surfaces appear. The retailer data suggests that lift is real and directional, not marginal 1.
For a marketing VP defending a mixed budget, the practical move is to separate the reporting. Paid gets a CAC and ROAS view on transactional and bottom-funnel queries. Organic gets a pipeline-contribution view that includes assisted conversions, share of first-page presence on priority query clusters, and paid efficiency gains on overlapping terms. When those two views sit side by side, the CFO sees paid earning its keep on measurable conversions and organic lowering the effective cost of the entire search program.
Reallocation follows from that split. Rather than shifting dollars from paid to organic, most in-house teams find headroom by cutting paid spend on queries where they already rank in the top three organically, then routing those savings into content depth and technical fixes on the query clusters where they rank on page two. Paid volume holds; organic capture expands; the interdependence effect widens the base.
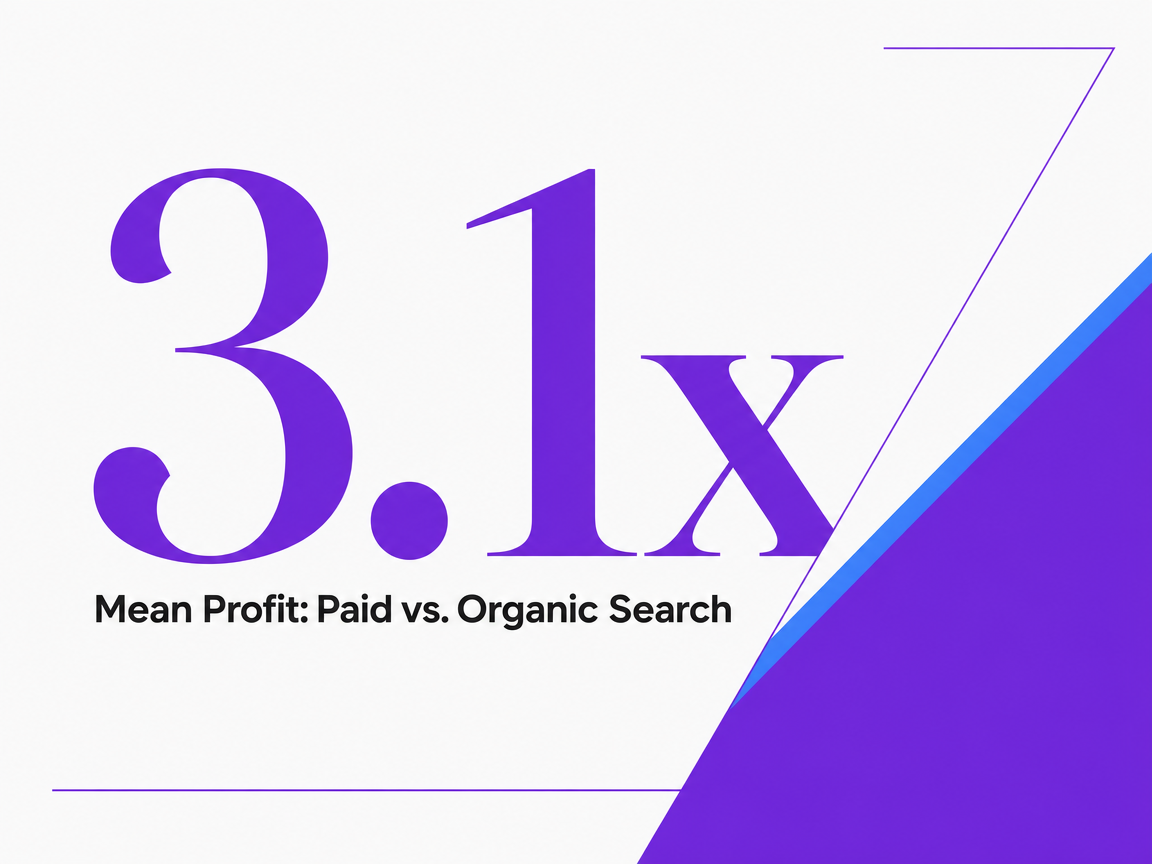 Mean Profit: Paid vs. Organic Search
Mean Profit: Paid vs. Organic Search
SERP Real Estate and the Economics of Rank Position
Ranking distributions are steep, and the economics of search follow that curve. A 2023 comparative analysis of clicking behavior across Google and Bing found that users clicked the first result in over 50% of cases, with 97% of all clicks concentrated on the first page of results 4. Eye-tracking work reinforces the mechanism: users spend more viewing time and evaluation effort on higher-ranked abstracts and rarely scan all listings before selecting one 3. Attention is not distributed evenly across the SERP; it collapses toward the top.
The budgeting consequence is unavoidable. Moving a query from position 8 to position 4 does not deliver double the traffic — it can deliver an order of magnitude more, because the click curve is exponential, not linear. Moving from position 4 to position 2 often produces another step change. Everything below the first page competes for the remaining 3% of clicks, split across all crawlable results the search engine has indexed for that query 4.
For marketing VPs allocating content and technical budget, that curve rewrites the math on long-tail volume plays. A portfolio of 300 keywords ranking on page two produces less pipeline than 30 keywords ranking in the top five, and it costs more to maintain. Query-cluster depth on terms already ranking 5–15 generally returns more per dollar than net-new content targeting unranked long-tail terms with weak commercial intent.
The scope of the click-concentration finding matters. It was measured on general-population search behavior across two engines, not on B2B buying committees running deep research sessions. In-house teams selling to sophisticated buyers should still expect a longer tail of engaged clicks below position five — but the primary traffic base still lives in the top slots. The operational takeaway holds: pipeline compounds where rankings compound, and rankings compound at the top of the page.
Experience measurable SEO execution at scale now
Test real-world SEO strategies and see pipeline impact before committing to ongoing investment.
Reading the AI Overview Disruption Without Overreacting
Generative summaries at the top of the SERP are the disruption marketing VPs are being asked about most, and the honest read is neither apocalyptic nor dismissive. Pew's July 2025 behavioral study found that 58% of U.S. adults who searched Google in March 2025 encountered at least one AI-generated summary, and users were measurably less likely to click through to result links when a summary appeared on the page 6. That is a real change in click distribution, and it lands on top of the same position-bias curve organic teams already contend with.
Scope matters. Pew measured U.S. adult search behavior across a broad mix of everyday queries — informational, navigational, and casual research. It did not isolate B2B buying-committee sessions, high-intent local service queries, or transactional shopping paths, where users still need to reach a specific provider, form, or page to complete the task. AI summaries suppress clicks most on queries that were already headed toward zero-click outcomes: definitions, quick facts, and shallow comparisons. Bottom-funnel queries with commercial intent behave differently because the summary cannot complete the transaction.
The operational read for in-house teams has three parts:
- Informational content that lived on top-of-funnel traffic alone is the most exposed; that traffic was already softening and now compresses faster.
- Brand and mid-funnel queries where the user needs to evaluate a specific provider retain their click value, because the summary often cites and links to those pages rather than replacing them.
- Structured, expertise-dense content is more likely to be surfaced inside the summary itself, which returns brand exposure even when the click does not fire.
The budget move is not a retreat from organic. It is a shift in what organic is measured on. Impression share inside AI summaries, branded query lift, and assisted conversions from summary-cited pages become part of the scorecard alongside sessions and rankings. Teams that keep tracking only raw organic clicks will see the number bend down and misread the cause. Teams that add SERP-feature presence and downstream conversion contribution to the reporting will see where organic is still doing the work.
A Growth-System Architecture for In-House Teams
Signal Capture: What the Team Actually Listens To
A functioning organic program runs on a narrow set of signals, not a dashboard full of them. Four inputs matter most:
- Query-level ranking movement on priority clusters
- The SERP feature landscape around those queries
- Downstream conversion behavior tied to organic sessions
- The operational data most in-house teams already collect — qualified calls, form submissions, booked appointments, and cost per lead by channel
Ranking data alone is misleading without the SERP context around it. A position-two result on a query now dominated by an AI summary and a local pack behaves nothing like a position-two result on a clean ten-blue-link SERP. Signal capture has to record both the rank and the surface conditions.
The conversion side is where most programs go thin. Organic sessions need to be tracked through to the same pipeline outcomes paid is measured on — call quality, booking rate, lead-to-opportunity conversion — or the program keeps getting compared on traffic volume it cannot always control 8. Signal capture is not reporting. It is the raw input the next step consumes.
Prioritization: Ranking Bets by Pipeline Weight
Every organic program has more work available than capacity to execute it. Prioritization is where most in-house teams lose the plot, defaulting to whatever the last audit surfaced or whichever page the CEO forwarded that week.
A pipeline-weighted approach ranks work on three variables: the commercial intent of the query cluster, the current ranking position relative to the click curve, and the effort required to move it. Queries ranking five through fifteen with clear buying intent get the top of the queue, because that is where click-curve economics reward incremental gains most heavily. Net-new content on unranked terms sits below query-cluster depth on terms already earning impressions 2.
Bets should be sized against pipeline weight, not traffic weight. A cluster driving 400 monthly sessions with a 6% conversion rate to qualified lead outranks a cluster driving 4,000 sessions at 0.2%, even though the second looks bigger in a rankings report. Prioritization discipline is what turns signal capture into a working queue instead of a wish list, and it is the step vendor-fragmented programs almost always skip.
Execution and Measurement in One Loop
The gap between prioritization and execution is where most organic programs bleed time. A queued brief moves to an outside content agency, waits for a draft, returns for legal or clinical review, waits for a technical fix from a separate SEO vendor, and finally publishes six to ten weeks after the signal that prompted it. By then, the SERP has moved, the query cluster has shifted, and the measurement window is already contaminated.
Closing that loop means treating execution and measurement as one connected motion, not two departments. When a piece ships, the same system captures its ranking trajectory, its impression share inside SERP features, its click-through pattern, and its downstream conversion behavior. That data feeds directly back into the next prioritization cycle. Nothing sits in a monthly report waiting for a status meeting to interpret it.
For in-house teams without the headcount to run this loop manually across content, technical, and local surfaces, the practical answer is a single operating layer that connects signals, priorities, execution, and measurement under human approval. Marketing keeps the judgment. The coordination overhead — the part that swallows most VP time in a fragmented stack — comes out of the system.
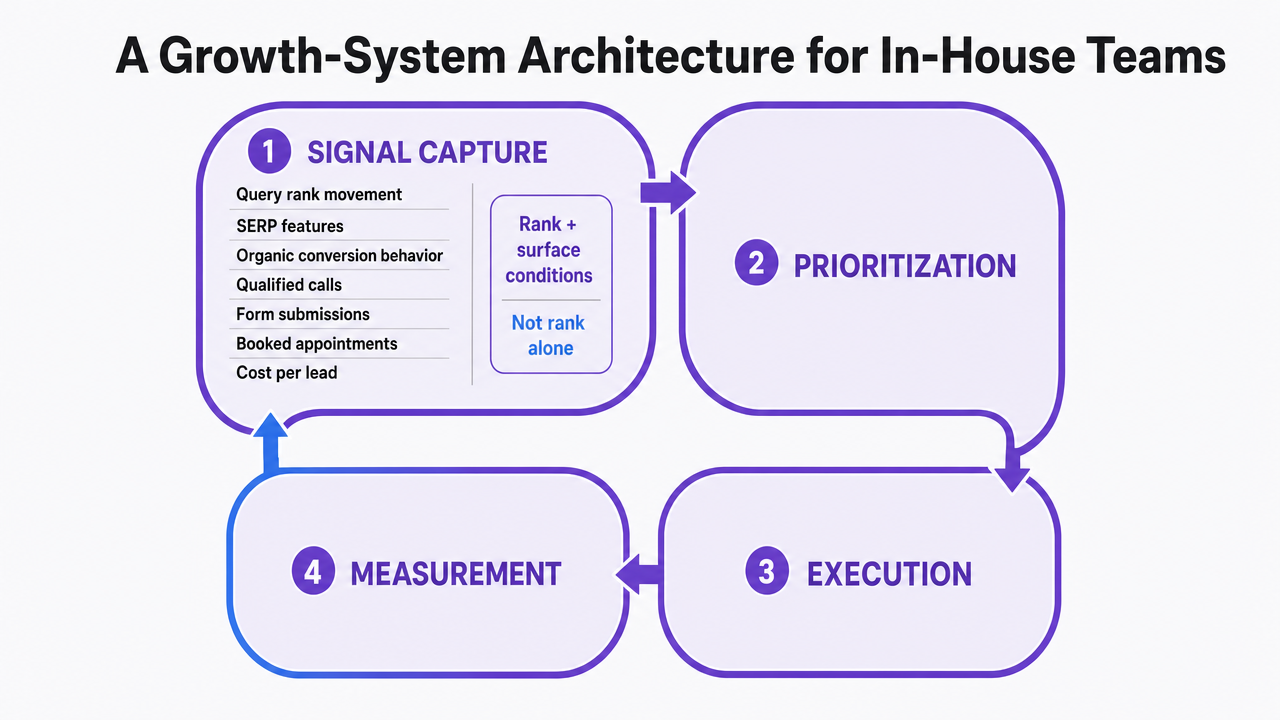 Visualize the four-step operating loop described across the three subsections: Signal Capture, Prioritization, Execution, and Measurement, feeding back into Signal Capture
Higher-Stakes Verticals and the Content Quality Bar
Search behavior in regulated verticals raises the stakes on every published page. A systematic review of online health information seeking found that patients' search activity is associated with measurable changes in healthcare utilization patterns, including consultation frequency and self-management behavior 11. When a query can move a patient toward a clinic visit or away from one, the quality bar on the ranking page stops being a marketing preference and becomes a clinical liability.
Legal, behavioral health, dental, and senior living operate under the same pressure. Search engines evaluate these categories through stricter quality signals — author expertise, citation depth, factual precision, and evidence of real-world credentials. Thin content that ranks in a lower-stakes vertical will not hold position on a query about medication interactions, personal injury statutes, or memory care admission criteria. The keyword-level covariates that lift organic performance most sharply — retailer-specific detail in commercial contexts, provider-specific detail in service contexts — are exactly the inputs a generalist content vendor tends to strip out 2.
In-house marketing leaders in these verticals need a production model that keeps subject-matter review inside the loop, not bolted on after drafting. That means clinical, legal, or licensed reviewers approving substantive claims before publication, structured author attribution on every page, and citation trails that hold up to both search-engine evaluation and regulatory scrutiny.
Operationalize SEO as a Scalable Growth Engine—No Additional Headcount Required
See how enterprise marketing teams are using AI-driven, multi-channel optimization to create a predictable organic pipeline and improve conversion rates—without adding vendors or increasing internal workload.
If You Manage Multiple Locations: Consolidation Economics
The Fragmented Vendor Stack Most Multi-Location Operators Inherit
A note on scope: this section shifts from the general in-house VP guidance above to the operator economics that only apply when a marketing team owns more than a handful of locations — multi-site dental groups, law firm networks, home services franchises, behavioral health portfolios, senior living operators. The dynamics change once local surfaces multiply.
The typical stack a 10-to-50-location operator inherits looks like this:
- A national SEO agency on retainer for the main domain
- A separate content agency producing service and blog pages
- A local SEO or Google Business Profile vendor managing listings and reviews
- A PPC agency running paid search and often Local Services Ads
- A reporting or dashboard tool stitching partial data across all of them
- Sometimes a sixth vendor handles reputation management or citation cleanup
Each vendor arrived through a different procurement cycle, defends a different scoreboard, and holds a partial view of what actually ranks. Location page audits get duplicated. Brand guidelines get reinterpreted. The VP spends more time reconciling conflicting recommendations than approving work.
Comparing a Fragmented Model to a Consolidated Execution Model
The visible cost of a fragmented stack is the sum of the retainers. The hidden cost is the coordination overhead those retainers create, and it usually runs larger than any single line item. A compact comparison, using variables an operator can fill in from their own numbers rather than invented benchmarks:
| Cost Line | Fragmented Vendor Stack | Consolidated Execution Model |
|---|---|---|
| Monthly retainers | 3–5 separate vendors (SEO, content, local, PPC, reporting) | Single operating layer with unified pricing |
| Briefing and status cycles | Weekly calls per vendor, duplicated context | One approval workflow across channels |
| Location page audits | Re-run by each vendor on their schedule | Single crawl feeding shared prioritization |
| Cross-channel reconciliation | VP or director time, typically several hours weekly | Shared signal layer across organic and paid |
| Reporting integration | Third tool aggregating partial exports | Native to the execution loop |
| Accountability for ranking outcomes | Split across content, technical, and local vendors | Single owner with human approval gates |
The math that matters is not which model is cheaper on retainer alone. It is which model produces measurable ranking movement on priority query clusters per dollar and per approval hour. Keyword-level content quality drives organic performance more directly than any technical patch a separate vendor can apply 2, and that quality bar is what fragmented stacks routinely strip out during handoff. Consolidation is not a preference. It is what makes the growth-system architecture in Section 5 executable at multi-location scale.
Defending the Budget: How VPs Frame Search ROI to a CFO
CFO scrutiny of organic budgets usually starts with the wrong question: what is the cost per click compared to paid? The right reframe is to show search as a portfolio of returns that accrue on different timelines, not a single-line expense measured against a single-line outcome.
Three framings hold up in a finance conversation.
- The first is compounding value. Forrester's ROI framework treats SEO as necessary for any company with a website because its contribution runs across traffic, leads, and revenue, with returns that build over multiple reporting periods rather than resolving inside a quarter 8. A ranking earned this year continues generating pipeline next year at near-zero marginal cost, which is the opposite of how paid spend behaves the moment the budget pauses.
- The second framing is channel interdependence. Organic exposure raises the efficiency of paid on overlapping queries, and keyword-level content quality lifts organic performance more directly than it lifts paid 2. That means every dollar spent on content depth on priority clusters shows up twice — once in organic capture, once in paid CTR and quality score on the same terms. CFOs understand cost synergies. This is one.
- The third framing is what gets measured. Sessions and rankings are inputs. The scorecard a CFO should see includes assisted pipeline contribution, paid efficiency gains on shared queries, and share of first-page presence on the clusters tied to revenue. Framed that way, search stops being a cost center defending itself and starts reading as the acquisition layer that lowers the cost of everything else.
Frequently Asked Questions
References
- 1.Analyzing the Relationship Between Organic and Sponsored Search Advertising.
- 2.Comparing Performance Metrics in Organic Search with Sponsored Search.
- 3.Eye-Tracking Analysis of User Behavior in WWW Search.
- 4.You are how (and where) you search? Comparative analysis of users’ clicking behavior in Google and Bing.
- 5.The Significant Role of SEO in Effective Web Marketing.
- 6.Do people click on links in Google AI summaries?.
- 7.Main findings.
- 8.The ROI Of SEO.
- 9.Consumer Click Behavior at a Search Engine.
- 10.Search Engine Use 2012.
- 11.Online Health Information Seeking and Healthcare Utilization: A Systematic Review.