
Key Takeaways
- Track competitor bid trajectories across 30, 60, and 90-day windows to distinguish myopic reactors from dynamic optimizers, since myopic bidders leave measurable profit exposed through predictable overreactions 1.
- Treat the position-1 advertiser as a primary target, not a threat — under pay-per-click mechanisms the position paradox strengthens, so inferior firms often hold the top slot through bid rather than relevance 4.
- Decompose identical positions into bid and quality score inputs to find arbitrage, then reallocate spend into auctions where a rival is overpaying and withdraw from queries where the client is the overbidder 2.
- Map branded impression share and top-of-page drift to expose rivals whose brand defense is weakening, then rank conceded adjacent and comparison queries for conquesting entry.
- Filter auction findings from copy claims — only publicly verifiable pricing, published commitments, and on-site features can lawfully appear in comparative ads, with substantiation logged before dissemination 10.
- Shift from manual weekly audits to signal-driven monitoring so analyst hours land only on accounts where impression share, position volatility, or quality-score thresholds have actually breached.
Why static competitor snapshots miss the auction's real weaknesses
Most competitor audits produce a Tuesday-morning artifact: a screenshot of Auction Insights, a SpyFu keyword export, three ad copy variants pasted into a slide. By Thursday, the rival has shifted dayparting, dropped a bid modifier, or swapped a landing page. The snapshot is already stale, and the analyst who built it has moved on to the next of 20 client accounts.
The problem is not the tools. It is the model. Sponsored search is a real-time auction where ad rank and clearing price depend on both bids and quality scores assigned per query 8. Competitors are not fixed positions on a leaderboard. They are agents whose bid trajectories respond to conversion feedback, budget pacing, and rival pressure over time. Yao and Mela's dynamic model of paid search shows that advertisers who bid myopically leave measurable profit on the table compared to those who optimize dynamically 1. That gap is the exploitable surface. It is invisible in any single snapshot.
Reframing PPC spying as continuous auction reverse-engineering changes what an analyst looks for. Not "who is ranking above my client this week," but which rivals adjust slowly, which sit in top positions they cannot economically defend 4, and which pay premiums for quality-score deficits they have not fixed. The five steps that follow build that read, then convert it into reallocated spend and ad copy that survives FTC substantiation review.
Step 1: Monitor bid trajectories across 30/60/90-day windows
What myopic bidders reveal in their adjustment patterns
A single Auction Insights export tells an analyst what happened last Tuesday. A 90-day trajectory tells them how a rival thinks. That distinction sits at the center of the dynamic bidding model Yao and Mela built from real sponsored search data, which shows that advertisers who bid myopically leave measurable profit on the table compared with those who optimize dynamically across time 1. The gap between the two behaviors is not academic. It is the pattern a specialist can read.
Myopic bidders react to yesterday. Their bids climb after a good conversion day, drop after a bad one, and rarely account for how their own adjustments will move the auction against them tomorrow. That produces a jagged trajectory: sharp CPC increases followed by impression share collapses, then rebids two weeks later after budget pacing recovers. Dynamic bidders smooth those responses. Their trajectories move in longer arcs, tied to seasonality and conversion feedback rather than to last week's dashboard.
Reading these patterns requires committing to a fixed observation window. A 30-day view catches tactical adjustments, dayparting shifts, and campaign launches. Sixty days exposes budget pacing rhythms, month-end throttling, and how a rival responds when their own impression share drops. Ninety days surfaces the structural moves — new landing page rollouts, quality score recoveries, seasonal repositioning — that a specialist can anticipate rather than chase. The signal a myopic competitor sends is consistency of overreaction. Once that pattern is logged across two full cycles, the next adjustment becomes predictable enough to preempt with a bid modifier or a scheduled budget push.
Signals to log: impression share drift, position volatility, dayparting shifts
Three signals carry most of the diagnostic weight in a trajectory log, and each one answers a different question about how a rival is defending its position.
- Impression share drift. Track a competitor's overlap rate and top-of-page rate week over week, not as isolated numbers but as slopes. A steady decline in overlap while position hold, top-of-page, and outranking share remain flat usually means the rival is narrowing keyword coverage — pulling back from broad match or cutting low-converting queries. That is a window to expand into the abandoned surface.
- Position volatility. The standard deviation of a rival's average position across a 30-day window separates confident bidders from reactive ones. Low volatility with high position hold points to a well-funded, quality-score-supported campaign. High volatility with slipping position hold usually means budget caps are firing mid-day or bid strategies are being retuned. The auction mechanism rewards both bids and quality scores per query 8, so a rival whose position swings without a matching bid change is likely fighting a quality score decline they have not addressed.
- Dayparting shifts. Note when a competitor's impression share collapses on specific hours or days. Repeated evening dropoffs typically signal budget exhaustion, not strategic scheduling. Those hours become reallocation targets — cheaper auctions with a weakened field.
Step 2: Exploit the position paradox in top-ranked rivals
Why the position-1 advertiser is often the weakest target
The instinct is to treat the ad in position 1 as the account to fear. It is usually the account to attack. Under generalized second-price mechanisms with quality-weighted ranking, a less efficient firm can end up above a more efficient one, and the Columbia analysis of this dynamic finds that under pay-per-click mechanisms the position paradox is strengthened — the inferior firm is even more likely to sit at the top 4. Rank, in other words, is not a ranking of underlying strength. It is a ranking of what a given advertiser was willing to pay for the outcome the auction produced.
That distinction matters when a specialist is deciding where to press. A rival holding position 1 through a high maximum CPC and a mediocre quality score is not defending a moat. They are subsidizing a placement that a better-structured competitor could take at a lower clearing price. The pattern shows up as a persistent gap between their outranking share and the click-through rates their ad copy actually earns — impressions purchased, attention not converted.
The practical read is straightforward. When a rival occupies position 1 on the queries that matter to a client and their overlap rate with the second-position advertiser stays tight week over week, the auction is telling the analyst that the top slot is being held with money, not with relevance. That is the profile worth targeting first. The rival below them, sitting quieter in position 2 or 3 with steadier top-of-page rates, is often the harder economic opponent.
Auction efficiency tells: overbidding, thin margins, and defensive positioning
Three tells separate the paradox rival from the genuine leader, and each one is legible from data an agency already collects.
- Overbidding. A rival whose top-of-page rate holds near ceiling while their absolute top impression share fluctuates is paying a premium to stay visible. The bid is doing the work the quality score should be doing. Because clearing prices are set by the bid-quality composite at the query level 2, that account is absorbing higher CPCs than a specialist with a stronger landing page would ever need to match them.
- Thin margins. Watch for retreats on long-tail or lower-intent variants while the rival holds firm on head terms. Selective withdrawal usually means their unit economics only work on the queries with the strongest downstream conversion, and they cannot afford to spread coverage. The abandoned tail is reallocation surface.
- Defensive positioning. A rival who bids aggressively on their own brand terms and on a small ring of category defenders — but disappears on adjacent commercial queries — is running a moat, not an offense. That signals a budget constrained enough to concede growth queries to protect existing pipeline.
Together these tells convert the position-paradox insight from a theoretical curiosity into a targeting rule. The rival paying to hold visibility is the one whose auctions a client account can enter with a lower bid and a better Ad Rank composite.
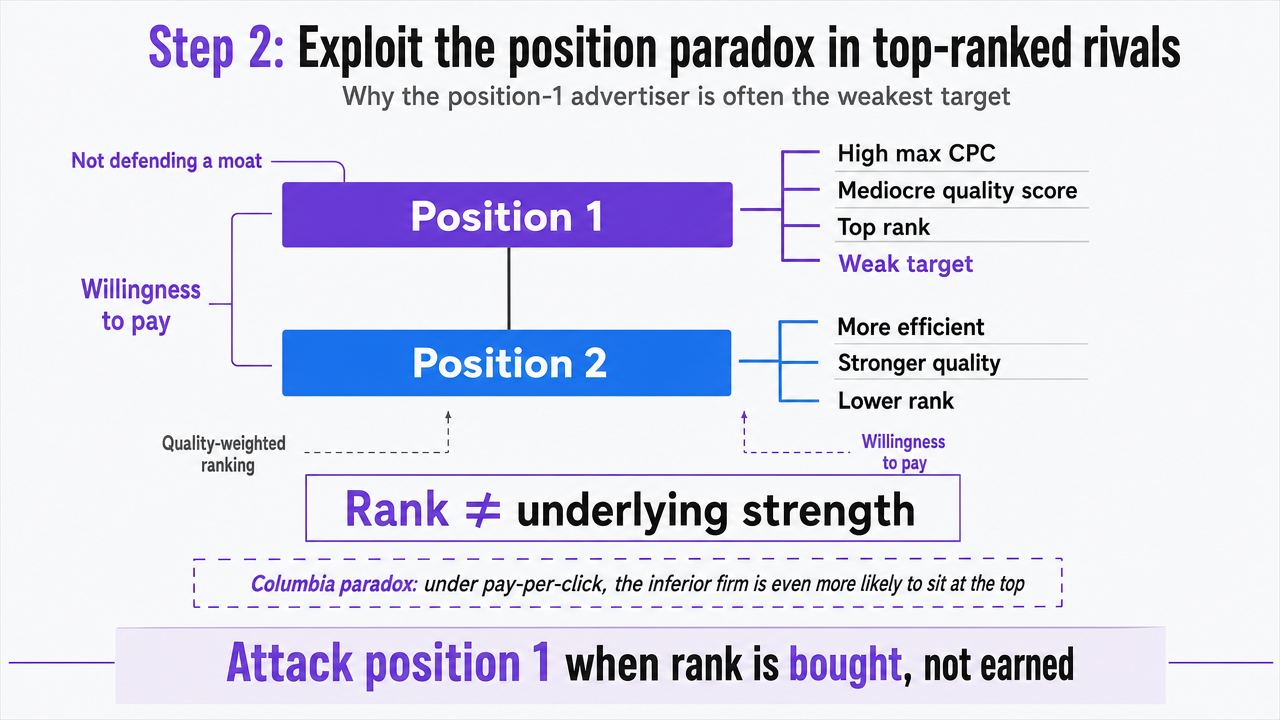 Visualize the position paradox concept as a comparison framework showing why the top-ranked advertiser is often the weakest target, directly supporting the section's core argument grounded in the Columbia paradox citation
Pinpoint Competitor PPC Gaps With Live Data
Map competitor weaknesses and optimize your campaigns using actionable insights from real-time data analysis.
Step 3: Identify quality score arbitrage in the Ad Rank decomposition
Reading identical positions as different economic stories
Two rivals holding an average position of 2.3 on the same head term are not running the same campaign. They are running two different economic stories that happen to end at the same slot. The structural model of sponsored search auctions makes this explicit: ad ranks and clearing prices depend on both advertiser bids and the quality scores the platform assigns to each ad and query 8. Position is a product, not a variable. A specialist who reads it as a single number is discarding half the diagnostic information.
Decompose the position. Advertiser A reaches slot 2.3 with a maximum CPC of $18 and a quality score of 4. Advertiser B reaches the same slot with a max CPC of $9 and a quality score of 8. Their Ad Rank composites land in the same neighborhood. Their unit economics do not. Advertiser A is paying roughly twice as much per click to sit next to Advertiser B, and every incremental impression they win is bought with bid, not earned with relevance 2. That is the arbitrage. It is not a leaderboard question. It is a question of which advertiser's landing page, ad copy, and query mapping are doing the compounding work.
The read for an agency specialist is to stop treating position parity as competitive parity. On any query where a client's quality score sits meaningfully above a rival's — visible through consistently lower CPCs at matching positions — the auction is subsidizing the client. On queries where the rival holds the same position at lower CPC, the arbitrage runs the other way, and the diagnostic points at the client's landing page, not the bid.
Where to reallocate spend when a rival is buying position, not earning it
Once the decomposition is logged, reallocation follows three moves.
- Enter the queries the rival is overpaying to hold. Where a competitor sits at parity through bid rather than quality score, the clearing price is set by their willingness to pay 2. A client with a stronger landing page and tighter ad-to-query relevance can enter the same auction at a lower Ad Rank cost and force the rival to either bid higher or cede position. Prioritize the head terms where their quality score gap is widest — that is where each incremental dollar buys the most position pressure.
- Withdraw from auctions where the client is the overbidder. The same decomposition works in reverse. On queries where a client holds position through bid while a rival earns it through relevance, the CPC is a rent, not an investment. Cap those bids, redirect the freed budget to the arbitrage queries above, and route the flagged terms to a landing page and ad copy sprint rather than a bid patch.
- Concentrate quality score investment where auction volume rewards it. Quality score improvements compound only where impression volume is meaningful. Rank the arbitrage list by query volume before assigning production hours, and treat the top decile as the sprint backlog. That is the sequence that converts a static audit into a reallocation plan the media buyer can execute the same week.
Step 4: Map brand defense gaps and conquesting openings
Brand terms are where rivals reveal their conviction. An account that bids aggressively on its own brand, holds top-of-page share above 90 percent on branded queries, and shows steady impression share on category defenders is running a coordinated defense. An account that lets its branded impression share drift below 70 percent, or shows a rival capturing top-of-page share on its own name, is leaving pipeline exposed. That gap is the conquesting opening.
The read starts with the rival's own brand SERP. Log their branded impression share, the identity of the advertisers appearing above or beside them, and how their top-of-page rate moves across the observation window. A widening gap between search impression share and top-of-page impression share on branded queries usually means budget is being redirected to category acquisition, not brand defense. That is the moment to enter — clearing prices on branded queries are low precisely because the brand owner is not defending them, and the incoming click is a high-intent user actively searching for the rival's name.
The inverse tell matters just as much. A rival whose branded defense is tight but whose category coverage is thin is telling the analyst where their unit economics work and where they do not. Log the queries they have conceded — the adjacent commercial terms, the comparison queries, the "alternative to" variants — and rank them by client relevance before the media buyer builds the conquesting campaign. What survives review in Step 5 is a shorter list than most analysts expect, because auction openings and lawful ad copy are two different filters.
Step 5: Convert findings into compliant conquesting campaigns
What competitor weaknesses can lawfully appear in ad copy
Auction analysis surfaces plenty of weaknesses. Not all of them belong in an ad headline. The FTC's position on comparative advertising is that naming or referencing a rival is encouraged when the comparison is truthful, clear, and, where necessary, disclosed to avoid consumer deception 9. The operative filter is not whether the finding is interesting. It is whether the specific claim in the copy can be defended as accurate to a reasonable consumer reading it in context.
Three categories of findings translate directly. Publicly verifiable pricing differences, published response-time or availability commitments, and features a rival lists on their own site can support head-to-head copy as long as the referenced attribute is current at the time of ad service. Categories that do not translate: inferred quality score gaps, budget exhaustion patterns, or auction efficiency tells. Those are diagnostic inputs for bidding and targeting decisions, not messaging assets. A specialist who writes "Faster response than [Rival]" because the rival dropped off evening auctions has confused a media signal for a service claim, and the FTC's substantiation standard requires a reasonable basis for the claim itself before the ad runs 10.
The workable output of Step 5 is a two-column list: auction findings that inform where and when to bid, and separately, a smaller set of factual, on-site, or publicly-stated rival attributes that can lawfully appear in copy 6.
Building the substantiation file before launch
Before any conquesting variant enters an ad group, the substantiation file has to exist. The FTC's guidance is direct: advertisers must substantiate all express and implied claims before dissemination, and consumers are assumed to expect a reasonable basis whether or not one is stated 11. "Before dissemination" is the operative phrase. Post-hoc justification does not satisfy the standard.
The file is short and structured. For each competitor claim in the copy, log the exact assertion, the source it rests on (rival's live pricing page, published SLA, product spec sheet), a dated screenshot or archived capture, and the internal reviewer who signed off. Implied claims get their own row — a headline that says "Same service, lower price" implies parity on scope, and the file has to show that comparability was verified, not assumed 10. Schedule a monthly recheck. Rival pricing pages change without notice, and a claim that was substantiated at launch stops being substantiated the day the source moves. Agencies running conquesting across a portfolio should treat the file as a shared asset with version control, not a per-campaign attachment, so any analyst can defend any live claim on the same day it is questioned.
Pinpoint Competitor PPC Gaps with Data-Driven Analysis
Connect with our specialists to access actionable insights on competitor ad strategies, wasted spend, and missed opportunities—delivered with the speed and depth required by high-volume agency teams.
If you manage multiple client accounts: portfolio-scale audit economics
The four steps above scale in theory. In practice, they collapse against analyst hours. A senior specialist running the trajectory, paradox, arbitrage, and brand-defense reads on a single account can produce a defensible weekly output in two or three hours. Multiply that by 20 accounts and the arithmetic breaks before Wednesday. This section shifts scope from single-account tactics to portfolio economics — the operator problem an agency actually pays for.
The worksheet below is built from variables the reader supplies, not benchmarks. Fill in the account count, hours per audit cycle, cycle frequency, and blended analyst rate for the book being managed. The columns compare a manual weekly audit posture against a signal-driven posture where the trajectory log runs continuously and analyst time is spent only on the accounts where a threshold is breached.
| Input | Manual weekly audit | Signal-driven monitoring |
|---|---|---|
| Accounts in book (A) | A | A |
| Hours per audit cycle (H) | H | H × review rate (r) |
| Cycles per month (C) | 4 | 4 |
| Blended analyst rate ($/hr) (R) | R | R |
| Monthly analyst hours | A × H × C | A × H × C × r |
| Monthly labor cost | A × H × C × R | A × H × C × r × R |
The review rate (r) is the share of accounts flagged for analyst attention in a given cycle after the trajectory log surfaces threshold breaches — impression share drift beyond a set band, position volatility above a set standard deviation, or a quality-score gap widening on a priority query. In most portfolios the flagged share stabilizes well below the manual baseline once the log has two full cycles of history to compare against.
The economic point is not that monitoring replaces judgment. It is that judgment gets applied to the accounts where the auction is actually moving, and the rest of the book runs on a passive log until a threshold fires. That is the sequence that lets an eight-account specialist take on a 20-account book without the audit cycle absorbing the margin. For agencies coordinating this across analysts, an AI-coordinated monitoring layer — the category Vectoron sits in — reads the log continuously and routes only the exceptions to human review.
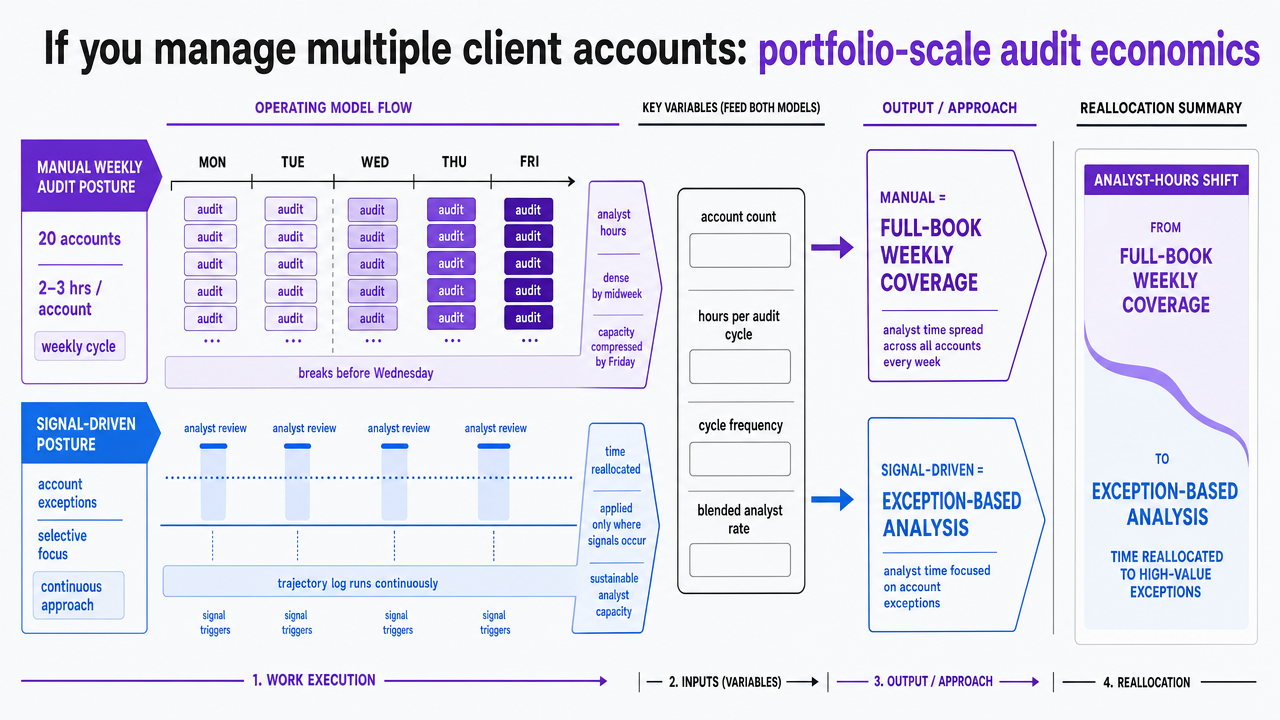 Visualize the operating model comparison between manual weekly audits and signal-driven monitoring that the section explains in its worksheet table, showing how analyst hours are reallocated
What expressive bidding and AI-coordinated auctions change next
The five-step read above assumes a competitive field where most rivals bid with static maximums and periodic manual adjustments. That assumption is eroding. The Cornell work on expressive bidding proposes auction environments where advertisers submit bidding programs that respond to conditions like clicks, conversions, budget states, and slot positions rather than fixed CPCs 3. When agents on both sides of an auction adjust continuously, the trajectory signals that Step 1 relies on get faster, noisier, and shorter-lived.
Two consequences follow. The observation window for reading a rival compresses — 90-day arcs shrink toward 30-day cycles as expressive agents retune inside a week. And the position paradox 4 widens, because expressive bidders defending head terms will absorb higher clearing prices to hold visibility their quality score no longer earns. The specialist edge shifts from spotting weakness in a snapshot to running the same continuous read a rival's agent is running, at the same tempo, across the portfolio. That is the category an AI-coordinated monitoring layer occupies next.
Frequently Asked Questions
References
- 1.A Dynamic Model of Sponsored Search Advertising.
- 2.Design of Sponsored Search Auction Mechanism for Electronic Commerce.
- 3.Toward Expressive and Scalable Sponsored Search Auctions.
- 4.A “Position Paradox” in Sponsored Search Auctions.
- 5.Closing Deck: Search Advertising: U.S. and Plaintiff States v. Google LLC.
- 6.Advertising FAQs: A Guide for Small Business.
- 7.Department of Justice Wins Significant Remedies Against Google.
- 8.A Structural Model of Sponsored Search Advertising Auctions.
- 9.Statement of Policy Regarding Comparative Advertising.
- 10.FTC Policy Statement Regarding Advertising Substantiation.
- 11.Advertising Substantiation Principles.
- 12.Justice Department Sues Monopolist Google For Violating Antitrust Laws.
- 13.Department of Justice Prevails in Landmark Antitrust Case Against Google.
- 14.Competition Guidance | Federal Trade Commission.