
Key Takeaways
- Rank data proves ROI only inside a three-layer attribution chain: rank-to-clicks through a sourced CTR curve, clicks-to-sessions through a parity view, and sessions-to-qualified conversions at intake.
- Contemporary CTR benchmarks and a bounded per-position multiplier of roughly 10% 3should be applied to a client's own Search Console impressions, not third-party volume estimates.
- Search Console clicks and Analytics sessions measure different events and will not reconcile 1; report them side by side and monitor whether the ratio stays stable rather than promising parity.
- Portfolio scale depends on productizing the first three layers and reserving strategist hours for the QBR narrative, where SERP context, parity, and qualified-inquiry yield decide renewals.
The Three-Layer Attribution Chain Behind Every Defensible ROI Claim
Position screenshots do not survive a quarterly business review. A ranking of three for a commercial query is not evidence of return; it is evidence of visibility. The distance between that visibility and a signed contract is where most agency retention conversations quietly fall apart.
A rank tracker earns its place in an ROI narrative only when it sits at the top of a three-layer attribution chain. The first layer converts rank movement into projected click volume using contemporary CTR benchmarks, because ranking gains have measurable but bounded traffic value 2. The second layer reconciles those projected clicks against actual sessions in analytics, without pretending the two systems will agree; Google itself frames Search Console and Google Analytics as complementary rather than reconcilable, and recommends comparing clicks to sessions as the closest available pairing 1. The third layer connects sessions to qualified conversions, which in high-stakes verticals means separating form fills and phone rings from the smaller subset that represents real pipeline.
Each transition leaks value:
- Rank-to-click leaks because SERP presentation, device mix, and query intent distort click share independent of ordinal position.
- Click-to-session leaks because the two measurement systems count different events at different moments.
- Session-to-qualified-conversion leaks because raw lead volume overstates commercial outcomes, particularly in legal, health, and home services intake.
The sections that follow work through each layer in order, then translate the chain into a client conversation and a portfolio reporting model. The argument is not that rank tracking is unimportant. The argument is that rank data proves ROI only when the agency has already built the plumbing that carries a position change from a SERP into a client's revenue statement.
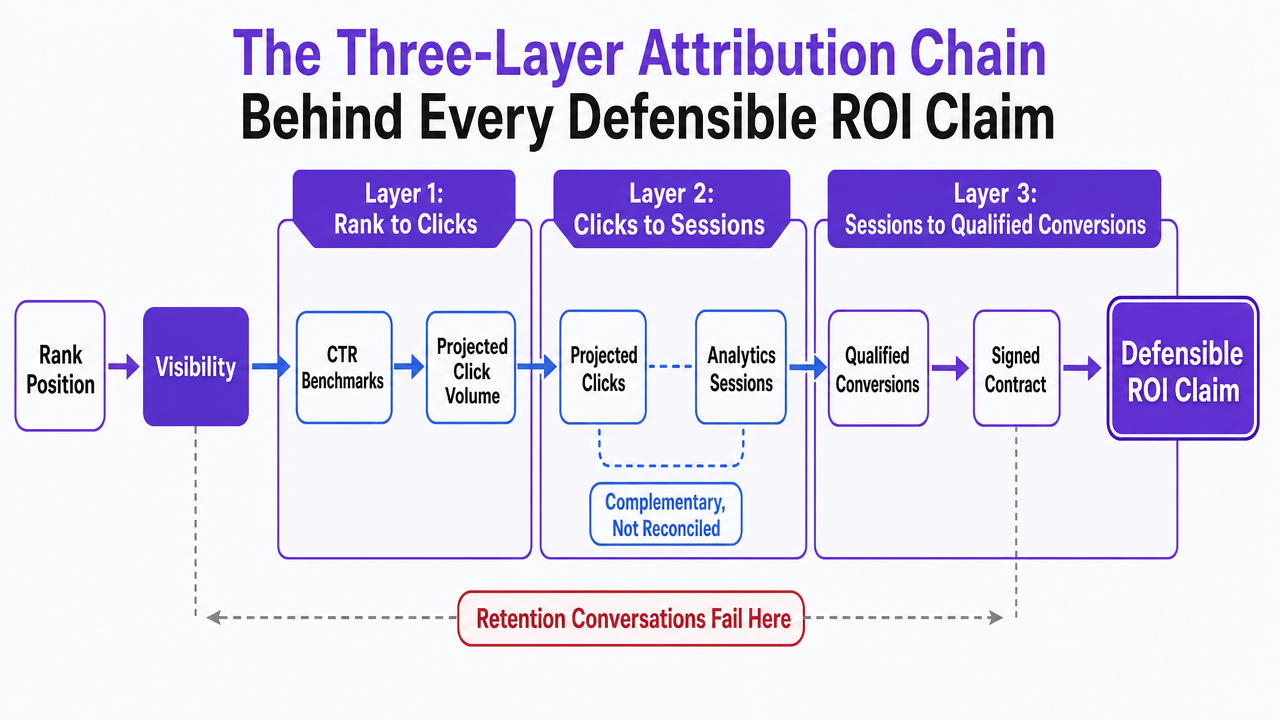 Visualize the three-layer attribution chain (rank-to-clicks, clicks-to-sessions, sessions-to-qualified-conversions) that structures the entire article
Layer One: Converting Rank Movement Into Bounded Click Projections
Anchoring Position Data to Contemporary CTR Benchmarks
Rank data becomes a traffic forecast only when it is multiplied against a defensible click-through curve. The curve most agency decks still reference dates from a decade ago and assumes position one collects roughly a third of all organic clicks. Contemporary evidence puts the number far lower.
A 2024 peer-reviewed analysis of 416,386 clicks and 31,648,226 impressions estimated organic CTR at 9.28% for position one, 5.82% for position two, and 3.11% for position three, with material variation by device 2. The scope matters: the figures come from a single-site Search Console dataset, so the authors treat them as current benchmarks rather than universal constants. That caveat is what makes them useful in a client-facing model. The numbers are recent, the methodology is disclosed, and the device split lets an account team stress-test projections against a client's actual traffic mix.
The working example is straightforward. A family-law client in a 400,000-population metro ranks in position six for a commercial query drawing 2,400 monthly impressions in Search Console. Moving that page to position three, using the 3.11% benchmark, projects roughly 75 clicks per month from that query alone. The projection is bounded, sourced, and reproducible across the account team without a senior strategist rebuilding the math each cycle.
Two disciplines protect the model from overclaiming. First, the benchmark is applied to impressions the client already has, not to search-volume estimates from third-party tools, because impressions reflect the client's actual eligibility in the SERP. Second, the projection is labeled as an expected range, not a guarantee, and the underlying CTR figure is cited once with its device-dependent scope. That single citation carries the section; it is not repeated in later layers of the ROI narrative.
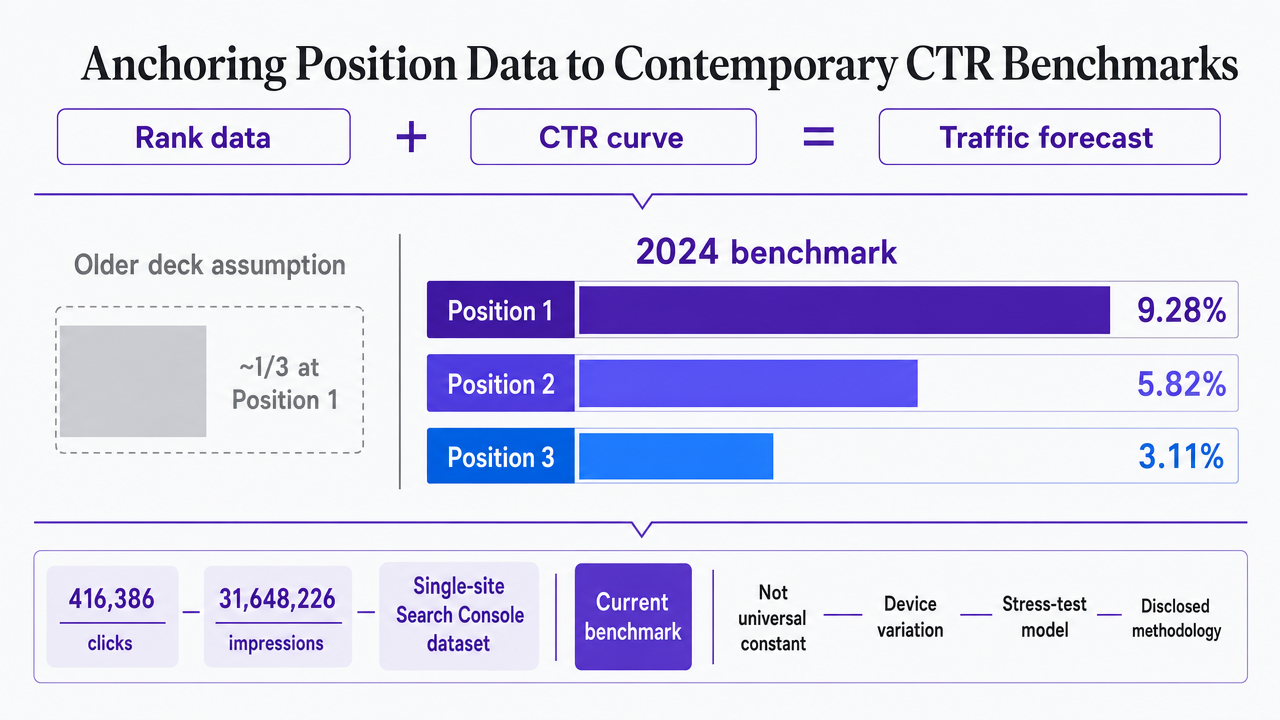 Visualize the contemporary organic CTR benchmarks cited in the section prose to anchor the rank-to-click projection model
The Empirically Bounded Rank-to-Click Multiplier
CTR benchmarks describe the destination. They do not describe the slope between positions. For that, the strongest available evidence comes from a Management Science study that combined archival modeling with randomized ranking experiments in a hotel-search context, and found that a one-position improvement in rank was associated with a 10.07% average increase in clickthroughs in the archival model 3.
The scope has to travel with the number. The study analyzed a vertical search environment, not general Google organic results, and the 10.07% figure comes from the observational model rather than the randomized arm. It is best used as an order-of-magnitude multiplier, not a universal law. Applied carefully, it turns a rank tracker's position deltas into a compounding curve: a move from position five to position four projects roughly a tenth more clicks, and a further move from four to three compounds on that already-elevated base. Across three positions, the arithmetic produces a materially different traffic story than a linear model implies.
The same study contains a warning agency leads should carry into every QBR. The paper found that clicks and revenue can move in opposite directions: an active personalization strategy in the experiments increased clicks but reduced purchase propensity and total revenue 3. Rank-driven click gains are not automatically revenue gains. That finding is the empirical bridge into the next two layers of the attribution chain, where session quality and qualified-conversion rates decide whether a projected click volume translates into a defensible dollar figure.
The operational discipline for Layer One is narrow. The account team applies a sourced CTR curve to client-specific impression data, applies a bounded rank-movement multiplier only where the query context resembles the source study, and hands the resulting range to the next layer without inflating it.
Layer Two: Reconciling Clicks With Sessions Without Overpromising Parity
Why Search Console Clicks and Analytics Sessions Never Match
The projected clicks from Layer One arrive at analytics as a smaller, differently shaped number. That gap is not a bug in the reporting stack. It is the measurement architecture behaving as designed.
Google's own documentation frames Search Console and Google Analytics as complementary rather than reconcilable. Search Console records impressions, clicks, and queries at the SERP, before a visitor reaches the site. Analytics records sessions, pageviews, and events after arrival, and only when tagging fires correctly on a supported browser. Google recommends comparing Search Console clicks to Analytics sessions as the closest available pairing, while warning that the two will not match exactly because the systems measure different events at different moments 1.
The mechanical reasons for the divergence are worth naming for a client audience:
- A single click can produce multiple sessions if a user leaves and returns within a reporting window.
- A click can produce zero sessions if the page fails to load, if the visitor blocks analytics, or if a bot triggered the impression.
- Time zones, sampling thresholds, and consent-mode signals introduce further drift.
In practice, agency reporting stacks routinely observe Analytics sessions running 10% to 30% below Search Console clicks for the same URL and window, and the direction of the gap is not stable across accounts.
An account team that promises reconciled figures inherits every one of these mechanics as a monthly explanation. A team that reports the two systems side by side, with the gap labeled and expected, spends its client hours on strategy instead.
Building Parity Reports Instead of Reconciled Ones
A parity report treats the click-to-session gap as a feature of the measurement architecture rather than a defect to explain away. The construction is disciplined: Search Console clicks and Analytics sessions appear on the same page, at the same URL grain, over the same date range, with the delta shown as a persistent column rather than a footnote. The report does not attempt to close the gap; it monitors whether the gap is stable.
Stability is the diagnostic signal. When the click-to-session ratio holds within a familiar band month over month, the Layer One projections carry through to on-site behavior at a predictable rate, and the account team can move confidently into Layer Three. When the ratio breaks, the report has surfaced a real issue: a tagging regression, a consent-mode change, a bot surge, or a template-level rendering failure. In either case, the parity view lets a strategist act without waiting for a client to notice the anomaly first.
The three-layer attribution stack becomes legible at exactly this point. Rank data flows down to click projections through a sourced CTR curve. Click projections flow down to sessions through a parity ratio, not a promise of equivalence, and Google's guidance that clicks and sessions measure different events sits at this layer as the labeled leak 1. Sessions flow down to qualified conversions through a separate layer of intake evidence, which Layer Three addresses.
The client-facing benefit is narrow and specific. The account team stops defending small numeric discrepancies in QBRs and starts explaining what the parity ratio has done over the reporting period. Renewals turn on the second conversation, not the first.
Prove SEO impact with real tracked data
Track keyword movements and demonstrate measurable ROI to clients using live campaigns during your free trial.
Layer Three: The Qualified-Conversion Gap Agencies Rarely Close
Sessions are not clients. In legal, behavioral health, dental, and home services intake, the distance between an on-site session and a qualified inquiry is the layer where most agency ROI stories quietly collapse. A rank tracker that stops at sessions has proven visibility. It has not proven revenue.
The mechanical problem is straightforward. A form submission on a personal injury site can be a wrong-jurisdiction inquiry, a solicitation, or a prospect who already signed elsewhere. A phone ring on a multi-location dental group can be a billing question, a hang-up, or a new-patient booking. Raw lead counts overstate commercial outcomes in exactly the verticals where those outcomes carry the highest per-conversion value. The Management Science evidence that clicks and revenue can move in opposite directions applies here in reverse: sessions can rise while qualified inquiries hold flat, and rank-only reporting will never surface the divergence 3.
Closing the gap requires a separate evidence layer at the intake surface. Call recordings are read for qualification signals such as jurisdiction, service line, insurance status, and appointment intent, and tagged against the landing page and query that produced the session. Form submissions are scored against the same criteria before they enter a CRM. The output is a qualified-conversion rate per URL, per query cluster, and per rank band, which then flows back up the attribution chain to weight the Layer One click projections against a client-specific yield.
The reporting consequence is direct. An account team can defend a ranking gain by showing that a page moved from position six to three, that impressions and clicks tracked with the sourced CTR curve, that sessions moved in parity with clicks, and that qualified inquiries per hundred sessions held or improved. That sequence is a revenue narrative. A screenshot of a position change is not.
The infrastructure to run this layer at scale is where most agencies stall. Manual call review does not survive a book of thirty accounts, and generic conversion tracking treats a hang-up the same as a booked consultation. Call intelligence that reads recorded calls, tags qualified inquiries, and surfaces intake patterns against source URL and query is what makes Layer Three operational rather than aspirational.
Interpreting Rank Data Without Overclaiming: SERP Layout, Presentation, and Click Bias
Ordinal position is a coarse variable. Two pages ranking third for the same query in the same week can pull materially different click share depending on what surrounds them: an AI overview stacked above the organic block, a local pack occupying the first screen, a featured snippet siphoning intent, or a shopping module compressing the visible list. A rank tracker that reports position without capturing SERP composition invites the account team to overclaim what a numeric gain actually produced.
The theoretical grounding for that caution is settled. Click-model research has shown for nearly two decades that observed clicks are a joint function of rank, relevance, and presentation, and that the same URL will draw very different click shares depending on what else is displayed alongside it 10. Related work on implicit feedback found that user behavior depends on the quality of the surrounding ranking, meaning clicks are influenced by relevance and position together rather than by position alone 6. Layout choices in the SERP itself add another distortion layer independent of ordinal position 11.
Visibility of credible listings compounds the effect. Analysis of search data has shown that removing access to a market leader's information depresses click-through rates in the surrounding results, which means a client's rank gain can be muted or amplified by the identity of the neighbors on the page 12. A position-three appearance next to a dominant brand behaves differently from a position-three appearance in a fragmented SERP.
The operational discipline is narrow. Rank data enters the ROI narrative paired with SERP-feature context for the same query set: which queries triggered AI overviews, local packs, or snippets during the reporting window, and how those features moved. When a position gain coincides with a feature that captured intent above the organic block, the projected click volume from Layer One is discounted before it reaches the client. When a competitor lost a snippet the client did not gain, the account team explains that the click share moved without a rank change. The report reads as analysis rather than a spreadsheet, and it stops promising traffic the SERP was never going to deliver.
Reporting Cadence After the December 2024 and June 2025 Search Console Updates
Client expectations for reporting speed have moved. Two Google updates in the last twelve months are the reason, and an account team that has not adjusted its cadence is now reporting on a rhythm that lags what the client can already see.
The December 2024 release added a 24-hour view to Search Console performance reports, surfacing clicks, impressions, average CTR, and average position from the last available day with only a few hours of delay 4. The June 2025 release folded the Insights report into the main Search Console interface, giving faster access to trending pages, trending queries, and click and impression totals in a single view 5. Neither update changes what the data means. Both change when it arrives and how quickly a client can ask about it.
The practical consequence for cadence is a split:
- Weekly touchpoints now carry the 24-hour view as a diagnostic layer: a page shipped on Tuesday shows measurable impression and position movement by Friday, and the account team can flag a regression before the client emails about it.
- Monthly reports carry the parity view from Layer Two, the sourced CTR math from Layer One, and the qualified-conversion evidence from Layer Three.
- Quarterly business reviews carry the narrative arc across the full attribution chain, with the Insights report used only to confirm that trending pages and queries align with the strategic thesis on file.
The discipline is to resist letting faster data pull the reporting rhythm toward more frequent revenue claims. Near-term Search Console figures are performance indicators, not proof of revenue on their own 4. The 24-hour view earns its place in the weekly conversation as an early-warning signal; the ROI narrative still lives in the monthly and quarterly cycles where sessions, parity, and qualified conversions can be assembled into a defensible story.
See How Real-Time Rank Tracking Quantifies SEO Impact for Clients
Request a demo to explore advanced rank tracking dashboards that tie keyword movements to qualified lead volume, supporting transparent, metrics-driven SEO reporting at agency scale.
If the Account Team Manages a Portfolio: Productizing Rank-to-Revenue Reporting
The audience shifts here. Everything above assumes a single-account view of the attribution chain. The economics change when the same account team owns thirty, sixty, or a hundred client relationships and cannot rebuild the chain by hand each month.
Hand-built reporting scales linearly. If a senior strategist spends four hours per account per month assembling rank data, applying CTR benchmarks, reconciling parity against sessions, and tagging qualified conversions, a portfolio of forty accounts consumes 160 strategist hours before a single client conversation begins. The math is unforgiving because the labor is not fungible: junior staff cannot compress a QBR narrative, and senior staff cannot spend their time exporting spreadsheets. The near-term Search Console updates make the pressure worse, not better. Faster data means clients ask sooner 4, and the Insights integration puts trending pages and queries in front of them without an agency intermediary 5.
A productized model treats each layer of the attribution chain as a repeatable component rather than a bespoke deliverable. The variables are worth naming explicitly so the account team can populate them against its own book.
| Reporting component | Hand-built monthly cost per account | Productized monthly cost per account |
|---|---|---|
| Rank pull and CTR projection (Layer 1) | H₁ hours × Rₛ loaded rate | Fixed per-account platform cost |
| Click-to-session parity (Layer 2) | H₂ hours × Rₛ loaded rate | Fixed per-account platform cost |
| Qualified-conversion tagging (Layer 3) | H₃ hours × Rₛ loaded rate | Fixed per-account platform cost + call intelligence pass |
| QBR narrative assembly | H₄ hours × Rₛ loaded rate | H₄' hours × Rₛ (retained, reduced) |
The productized column collapses H₁ through H₃ toward a fixed platform cost per account, leaving strategist hours concentrated on the narrative layer where judgment actually matters. The retained hours per account fall, but the quality of the client conversation rises because the strategist arrives at the QBR with the chain already assembled and defensible. That is the operational shift a Head of SEO owns: margin protection on the low end of the book and expansion capacity on the high end, without adding headcount.
The QBR Script: Turning the Attribution Chain Into a Client Conversation
The dashboard is not the deliverable. The meeting is. A rank tracker earns its cost when the account lead walks into a quarterly business review with a four-move script that carries the client from position data to a revenue statement without a single defensive detour.
- Move one opens with the SERP context, not the position table. The account lead names which queries triggered AI overviews, local packs, or snippets during the period, and which competitors gained or lost real estate above the organic block. That framing tells the client the agency is reading the page the way a searcher does, not the way a spreadsheet does.
- Move two carries the rank deltas into projected click ranges using the client's own impression data and a sourced CTR curve, then compares the projection against actual clicks in Search Console. Where the two agree, the meeting moves on. Where they diverge, the account lead points to the SERP-feature shift or the presentation change that explains the gap, because clicks are a joint function of rank and what surrounds it 6.
- Move three shows the parity view: Search Console clicks and Analytics sessions on the same URLs over the same window, with the delta labeled as an architectural feature rather than a defect 1. The conversation stays on whether the ratio held, not on which number is correct.
- Move four closes on qualified conversions. The account lead reports qualified inquiries per hundred sessions, attributed to the URLs and query clusters that moved, and connects that yield to the client's pipeline definition on file. That is the sentence the client remembers when the renewal comes up.
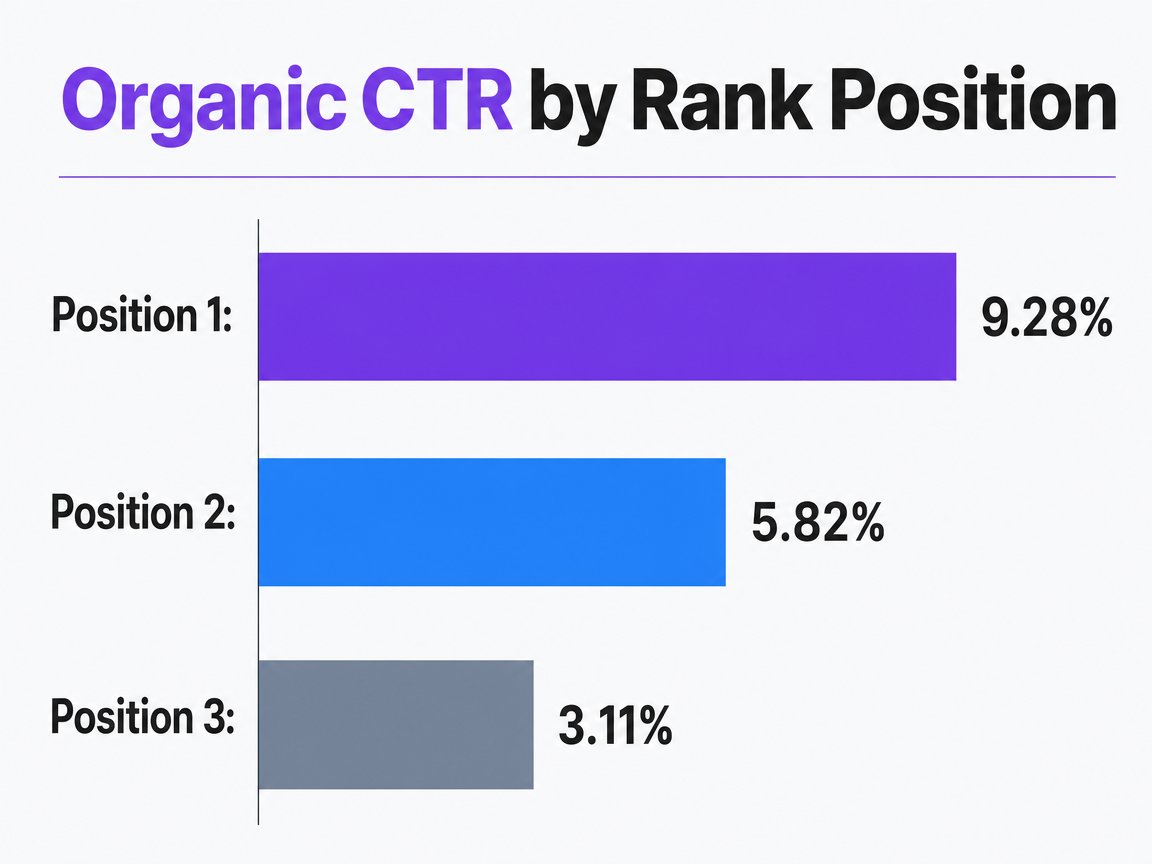
Estimated organic click-through rate for the top three Google search positions, based on a 2024 study. This data can be used for a bar chart.
Frequently Asked Questions
References
- 1.Using Search Console and Google Analytics data for SEO.
- 2.Device-dependent click-through rate estimation in Google organic search results based on clicks and impressions data.
- 3.Examining the Impact of Ranking on Consumer Behavior and Search Engine Revenue.
- 4.An improved way to view your recent performance data in Search Console.
- 5.The new Search Console Insights report is here.
- 6.Evaluating the Accuracy of Implicit Feedback from Clicks and Query Reformulations in Web Search.
- 7.Device-dependent click-through rate estimation in Google organic search results based on clicks and impressions data.
- 8.5pl.eps.
- 9.Improving Web Search Ranking by Incorporating User Behavior.
- 10.A Dynamic Bayesian Network Click Model for Web Searching Ranking.
- 11.Search Result Presentation.
- 12.Ananya Sen – Presentation on Search Data and Click-Through Behavior.