
Key Takeaways
- A rank tracker only earns its place in the stack if its data joins cleanly to GA4, Search Console, and CRM records without manual reconciliation across every client account.
- Visibility, traffic quality, conversion, and revenue form a four-layer chain 9; a tracker that cannot feed landing-page and non-branded segments into that chain breaks ROI reporting.
- Defensible volatility reporting requires the vendor to document its ranking-comparison method, aggregation logic, and handling of keywords that exit and re-enter tracking 2, 6.
- Tool-to-tool disagreement is inevitable given how SERPs are sampled 7, 13, so internal consistency across repeat pulls — not vendor agreement — is the right benchmark to defend in client meetings.
- Click-weighted share of voice 11turns rank data into a pipeline input, but only if the tracker allows editable competitor sets and exports keyword-level click estimates through its API.
- API depth that returns positions, SERP features, landing pages, competitors, and historical series in one pull is what lets a single analyst run portfolio-wide audits instead of per-account projects.
- Multi-location portfolios require native geo-grid tracking and one portfolio-wide API endpoint; per-location tool sprawl scales linearly with client count and breaks rankings-to-revenue reporting 9.
- Rank trackers measure what happened in the SERP; execution platforms sit downstream, consuming that data to route ranking signals into briefs, approvals, and shipped work.
The Measurement-Infrastructure Test Every Rank Tracker Should Pass
Most rank tracker evaluations start with the wrong question. Agencies compare refresh cadence, keyword caps, and dashboard aesthetics, then discover eighteen months in that the tool's data model cannot feed the ROI report the client actually pays for. The better question: does this tracker's underlying math plug into a rankings-to-revenue attribution stack, or does it terminate at a screenshot?
Rankings on their own do not close deals. The current SEO ROI formula — (Revenue from Organic − Cost of SEO) ÷ Cost of SEO × 100 — requires that position data be traceable through traffic, conversions, and closed revenue before it means anything to a CFO reviewing a retainer 10. A tracker that cannot export cleanly into that chain is a reporting liability, not an asset.
The measurement-infrastructure test has four parts:
- Can the tool's data be joined to GA4, Search Console, and CRM records without manual reconciliation?
- Is its ranking-comparison methodology documented well enough to defend when a client questions a week-over-week delta?
- Does it aggregate positions into share-of-voice metrics that map to competitive pipeline modeling?
- Does its API surface enough depth to support portfolio-scale audits without adding analyst headcount?
Every tracker in the market will pass one or two of these. The ones worth standardizing on across a client book pass all four. The rest of this piece works through each layer as a selection rubric, not a feature list.
A Four-Layer Rubric: From Visibility to Revenue
Layer One — Visibility: What the Tracker Actually Measures
Visibility is the entry point of the rubric, and the layer most rank trackers overstate. The relevant question is not how many keywords a tool can track, but whether the visibility signal it produces — positions, impressions, SERP feature coverage, geo-specific presence — can serve as the top of a four-layer chain that connects to conversion generation and revenue contribution 9.
Strong client reporting frameworks describe visibility as the first of four layers that must be read together: search visibility, organic traffic quality, conversion generation, and revenue contribution 9. A tracker fails the visibility test the moment its outputs cannot be joined to the layers beneath it. Average position across a five-thousand-keyword set, reported in isolation, tells a Head of SEO almost nothing about pipeline motion.
Three visibility inputs matter for scaling ROI reporting:
- Keyword coverage across non-branded, commercial-intent terms is the first — branded impressions inflate visibility scores without moving acquisition cost.
- SERP feature attribution is the second: a tracker that reports position three without noting three AI overviews, a local pack, and a featured snippet above it is misrepresenting click potential.
- Geo-specific ranking capture is the third, and it separates trackers built for national dashboards from those built for portfolio operators.
The rubric test at this layer is procedural. Export a week of visibility data. Attempt to join it, without manual reconciliation, to Search Console impressions and GA4 landing-page sessions. If the join breaks — mismatched keyword normalization, no landing-page mapping, no SERP feature flags — the tracker cannot underwrite the next three layers.
Layer Two — Traffic Quality: Non-Branded Impressions and CAC Signals
Traffic quality is where visibility gets stress-tested. A ranking that produces impressions without qualified sessions is a reporting artifact, not a growth signal. The layer sits between visibility and conversion for a reason: it is the earliest point in the chain where an agency can distinguish keyword volume from acquisition efficiency.
Two signals define this layer. Non-branded impressions isolate demand the client is actually earning through organic effort, filtering out the branded queries that would convert regardless of SEO investment. Organic customer acquisition cost, calculated against those non-branded sessions, then anchors the traffic layer to program economics — a metric modern ROI reporting treats as core rather than optional 9.
A tracker earns its place at this layer by making the non-branded slice easy to isolate. That means keyword tagging that survives at portfolio scale, landing-page attribution that maps ranked URLs to session data, and an API that lets an analyst pull the non-branded segment without rebuilding it in a spreadsheet every reporting cycle. Tools that force manual segmentation cost analyst hours and introduce reconciliation errors that clients catch.
A useful validation exercise: pick a client with a strong branded search footprint. Ask the tracker to isolate non-branded ranking movement over the last quarter and correlate it with GA4 non-branded sessions. If the two series drift or require custom scripting to align, the tool is not built to feed the traffic-quality layer.
Layers Three and Four — Conversion and Revenue Attribution
Layers three and four are where most rank tracker selections quietly fail. Conversion generation and revenue contribution require data movement between the tracker, analytics, and the client's CRM — and the tools that cannot participate in that movement force analysts to rebuild the chain by hand every month 9.
The conversion layer measures whether ranked, non-branded sessions become tracked events: form submissions, calls, bookings, qualified leads. The revenue layer closes the loop with attributed revenue and applies the working formula — (Revenue from Organic − Cost of SEO) ÷ Cost of SEO × 100 10. Neither layer can be populated by a rank tracker alone. Both depend on whether the tracker's data can be keyed to landing pages, campaigns, and time windows that match CRM records.
Three tracker capabilities determine whether these layers hold together at portfolio scale:
- Landing-page-level ranking data is non-negotiable: without it, there is no way to tie a keyword's movement to the URL that produced the conversion.
- API access with sufficient historical depth is second, so ranking series can be joined to closed-won revenue over the sales cycle the client actually runs.
- Timestamp fidelity is third — daily or weekly cadence needs to match the granularity of GA4 exports and CRM stage changes for attribution windows to line up.
The selection question at this layer is direct: can the tracker's data participate in a rankings-to-revenue join without a custom ETL project for every client? If the answer requires an analyst to build reconciliation logic per account, the tool will not scale across a twenty-plus client book, regardless of how its dashboard looks in a demo.
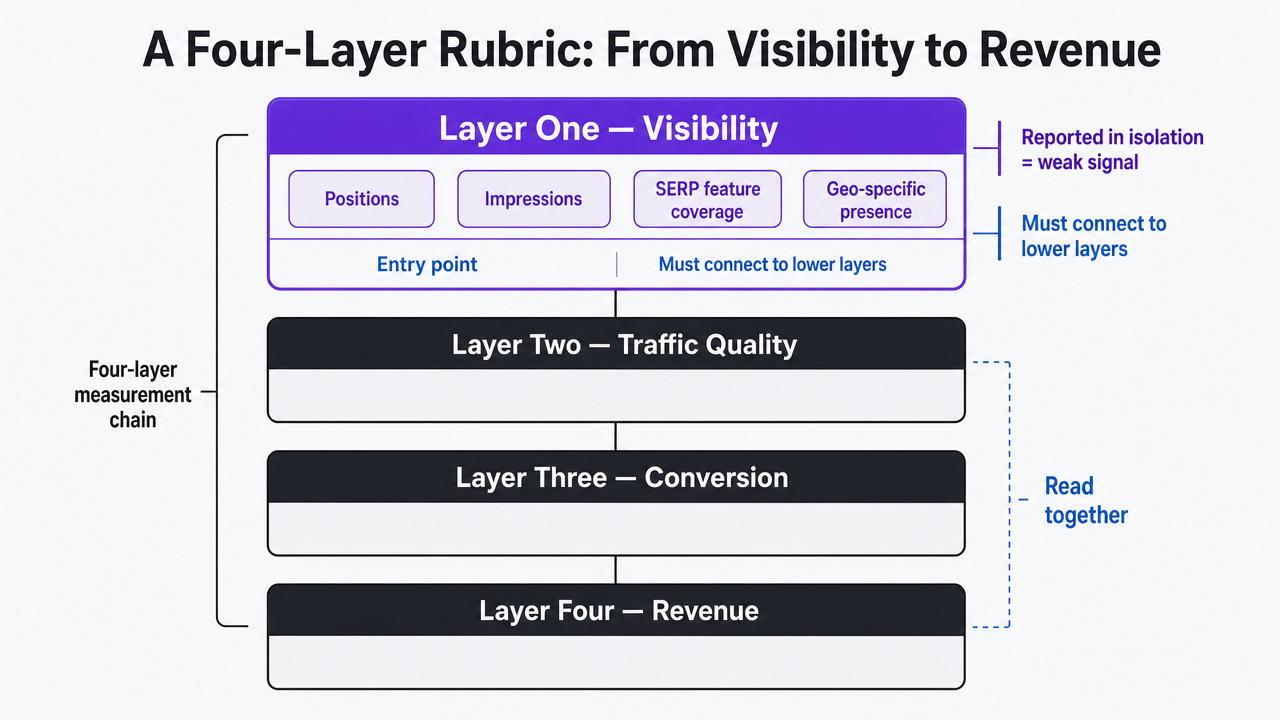 Visualize the four-layer measurement chain (visibility, traffic quality, conversion, revenue) that structures the entire section and is cited in the article
Data Defensibility: Underwriting the Numbers a Client Will Question
Volatility Math and Ranking-Comparison Methodology
A client will eventually challenge a week-over-week ranking delta in a QBR. The question is whether the tracker's methodology holds up when they do. Most agencies discover mid-meeting that they cannot explain how their tool calculated the movement it just reported.
The academic definition of ranking volatility is precise: the sum of all position shifts of an element over a defined window is that element's volatility 6. That formulation matters because it treats a keyword bouncing between positions four and six three times as more volatile than one that drops from four to six once and stays there — even though a naive tracker reporting only start and end positions would call them identical. Two trackers scanning the same SERP over the same week can therefore produce different volatility scores depending on which comparison method they use.
The comparison method itself is a defensibility question. Levene and colleagues formalized four distinct measures for assessing ranking changes over time and across engines, each producing different signals depending on whether the analysis weights top-of-page positions more heavily, penalizes new entrants, or treats missing results as position-infinity 2. A tracker that does not document which method it uses is asking the agency to underwrite a black box.
Before a tracker enters the standard client stack, the selection process should extract three answers in writing:
- What comparison method drives its volatility scores.
- How position shifts are aggregated across a keyword set.
- How the tool handles keywords that fall out of the tracked window and re-enter.
Trackers that cannot answer force the analyst to write the methodology footnote themselves, every reporting cycle, for every account.
Precision, Recall, and Why Tools Disagree
Two trackers rarely report the same position for the same keyword on the same day. That disagreement is not a bug in one vendor; it is a predictable outcome of how ranking measurement works, and it needs to be explained to clients rather than hidden.
Information retrieval frames the underlying problem with two metrics: recall, the ability to find relevant material in the index, and precision, the ability to place that material high in the ranking 1. Rank trackers face a parallel problem — approximating a SERP that Google generates through a multi-factor, personalized, location-sensitive algorithm 7. Different sampling strategies, proxy locations, device emulation, and refresh cadences will produce different snapshots of what is, at any given second, a moving target.
Research on predicting web search result rankings quantifies how imperfect even well-constructed models are. A linear model trained on content features correctly predicted seven of the top ten pages for 78% of evaluated keywords, and nine or more of the top ten for 77% of terms under content-only ranking 13. Those are strong results in academic terms, and they still leave meaningful position disagreement on nearly a quarter of the keyword set. Commercial trackers, which sample rather than model, inherit similar variance.
The operational consequence is that tool-to-tool agreement is the wrong benchmark. Internal consistency is the right one. A defensible tracker produces the same position for the same keyword, geo, and device across repeat pulls in a stable window, and its disagreements with a competing tool can be traced to a specific sampling difference. That is the answer to bring into the client meeting.
Test Advanced Rank Tracking at Full Scale
Validate agency-wide keyword tracking and reporting workflows with unrestricted access before making a commitment.
Share of Voice as the Bridge Between Rank Data and Pipeline
Average position across a keyword set is a summary statistic. Share of voice is a market statement. The two are related, but only the second one answers the question a client executive is actually asking: how much of the addressable organic demand is our brand capturing versus the competitors we care about?
The working definition is competitive. Share of voice measures a brand's visibility in organic search results relative to all competitors for a defined keyword set 11. The click-weighted formulation is the version that survives contact with a pipeline model: SOV equals the sum of a brand's estimated clicks across all tracked keywords, divided by the sum of total estimated clicks across all tracked keywords for every competitor in the set, multiplied by one hundred 11. Position data feeds the numerator and denominator through CTR curves. Rankings become a market-share proxy instead of a scoreboard.
That formulation is what turns rank data into a pipeline input. Once click share is defined against a competitor set, incremental SOV movement can be modeled into incremental sessions using CTR curves, then into incremental leads using the client's own conversion rate, then into incremental revenue using average deal size and close rate 12. The chain is assumption-heavy — CTR curves shift by SERP feature mix, and conversion rates drift by season — but it is a defensible chain. A single-percentage-point SOV gain against a named competitor is a claim a Head of SEO can bring to a QBR without hedging.
The tracker selection implication is specific. A rank tracker earns its place in the stack only if it can define competitor sets per client, compute click-weighted SOV natively across those sets, and export the underlying keyword-level click estimates through its API so an analyst can rebuild the calculation against the client's own CTR assumptions. Trackers that report only a proprietary visibility index — unweighted, undocumented, and non-exportable — break the modeling chain at exactly the point where it needs to feed revenue projections. The competitor definition also has to be editable at the account level; a fixed top-ten domain list will not reflect the actual competitive frame in verticals where the relevant rivals are local, category-specific, or newly emergent.
API Depth, On-Page Signal Integration, and Scalable Audits
API depth is what separates a rank tracker that scales across a client book from one that generates PDFs. The question is not whether the vendor offers an API, but whether the endpoints expose the fields an analyst needs to run portfolio-wide audits without opening the UI:
- Keyword-level positions with geo and device dimensions
- SERP feature flags
- Landing-page URLs
- Historical series at the granularity of the tracking cadence
- Competitor position data joined to the same keyword IDs
Anything less forces per-account scripting, which is where analyst hours quietly compound.
The on-page integration question sits directly downstream. Ranking movement without a linked on-page signal tells an agency what happened, not why. Structured on-page metrics — the k-rank framework, for example, quantifies not just the presence of target keywords in HTML tags but how those tags are used with selected keywords across a domain 4. Composite constructions go further and fold ranking positions into a total-rank formula that aggregates keyword-level components into a single optimization score 5. Neither metric has to be adopted verbatim; the point is that a tracker whose API can be joined to on-page crawl data lets an agency build a repeatable diagnostic instead of a one-off investigation.
Three tests decide whether the audit stack scales:
- Can the API return the last twelve months of position, SERP feature, and landing-page data for every tracked keyword in a single paginated pull.
- Can competitor positions be retrieved on the same keyword IDs, so gap analysis runs without a second reconciliation step.
- Can on-page crawl output — H1s, title tags, canonical URLs, internal link counts — be joined to ranking data on the URL field without transformation.
A tracker that answers yes to all three lets one analyst maintain the audit across dozens of accounts. One that answers no turns each audit into a project.
See How Leading Agencies Scale Accurate Rank Tracking—Without Extra Hires
Request a strategy session to benchmark your current rank tracking workflows against AI-powered automation models proven to reduce manual reporting hours by up to 70% across multi-client portfolios.
If You Manage Multi-Location Portfolios: Consolidating the Tracker Stack
Geo-Grid Granularity and the Per-Location Sprawl Problem
For agencies running multi-location portfolios — legal networks with twelve offices, DSOs with sixty practices, home-services franchises with two hundred territories — the rank tracker selection question changes shape. National tracking at ZIP-code centroids does not capture what a prospective patient in the north end of a metro actually sees, and it does not survive the moment a franchisee asks why their location report shows position four while the corporate dashboard shows position two.
Geo-grid tracking is the operational answer. A grid divides a service area into a lattice of tracked points — often a 5x5, 7x7, or 9x9 array around each location — and pulls positions from every node. That produces a spatial map of visibility instead of a single number, and it exposes the coverage gaps that per-location averages hide. The measurement grounding is the same as the visibility layer of the ROI rubric: rankings only feed conversion and revenue if they represent what real users in specific places are seeing 9.
Sprawl happens when an agency solves this location by location. One tracker per market, one grid subscription per brand, one reporting template per franchisee. The tool bill scales linearly with the client count, and so do the analyst hours spent reconciling separate exports. A single tracker with native multi-location grid support, campaign-level segmentation, and one API endpoint for the whole portfolio collapses that overhead.
Consolidation Variables: A Comparison Table for Portfolio Operators
The consolidation decision comes down to how a tool's per-location capacity, keyword allowances, and API access interact with the client's actual portfolio shape. Rather than model dollar figures — which drift by vendor tier and negotiation — the variables below frame the math an agency should run against its own book before standardizing.
| Variable | Per-Location Tool Stack | Consolidated Grid Tracker with API |
|---|---|---|
| Tracked locations | L (one subscription per location) | L (single account, portfolio-wide) |
| Keywords per location | K | K |
| Grid points per location | Often 1 (centroid only) | G (5x5 to 9x9 lattice) |
| Total tracked data points per cycle | L × K | L × K × G |
| Reporting exports to reconcile | L separate exports | 1 API pull |
| Analyst hours per reporting cycle | H per location, scales with L | Hfixed + marginal cost per added location |
| Competitor set definition | Per-location, often static | Editable per location, portfolio-queryable |
The tradeoff is legible once L and G are filled in for a real client. A twenty-location DSO tracking one hundred keywords per location on a 7x7 grid produces just under one hundred thousand data points per cycle — unmanageable through separate subscriptions, straightforward through one API pull that feeds the same rankings-to-revenue chain used for single-site clients 9. Consolidation is what makes portfolio reporting a query instead of a project.
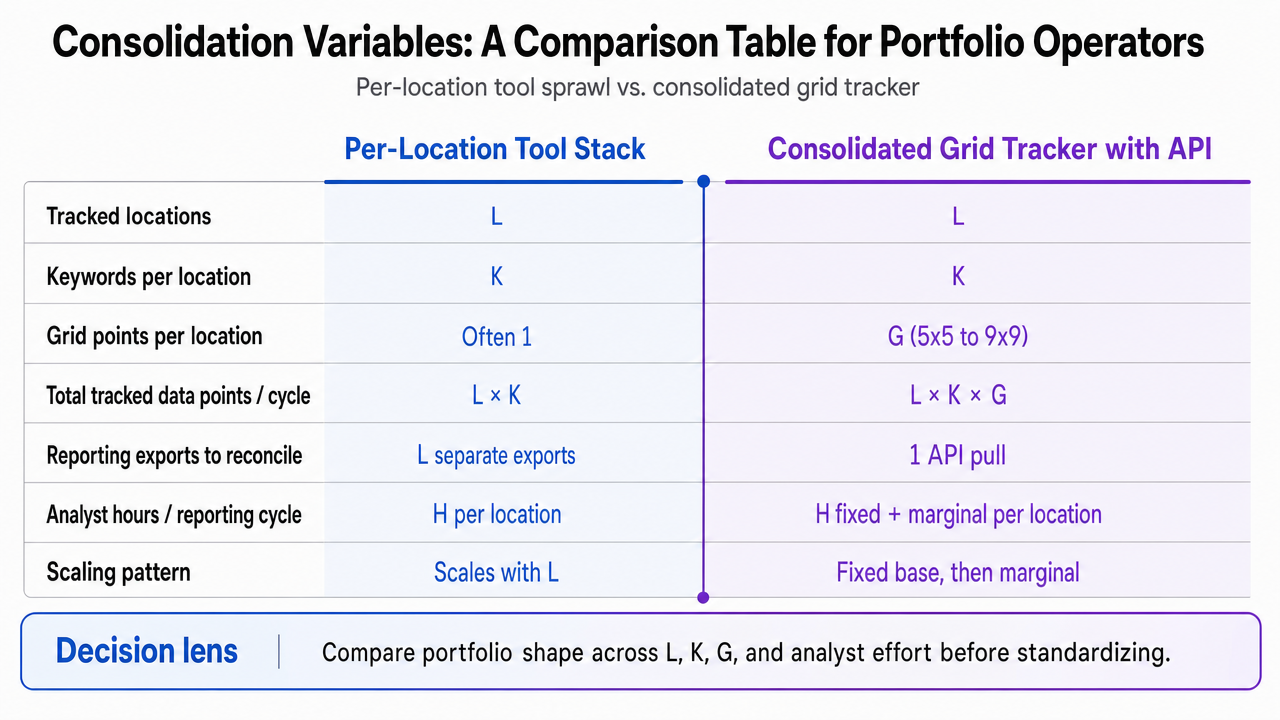 Visualize the side-by-side comparison of per-location tool sprawl vs. consolidated grid tracker directly reflecting the article's comparison table
Where Execution Platforms Fit Around the Rank Tracker
A rank tracker is a measurement instrument. It reports what happened in the SERP, not what should be shipped next. The gap between those two functions is where analyst hours quietly accumulate: a Head of SEO reviewing position drops, mapping them to on-page issues, briefing writers, coordinating link work, and waiting on production cycles across twenty accounts. The tracker did its job the moment the data landed. Everything downstream is coordination.
AI marketing execution platforms sit in that downstream layer. They consume the outputs a rank tracker produces — position deltas, SERP feature shifts, share-of-voice movement, landing-page-level ranking data — and route them into ranked recommendations, briefs, and approval workflows so that ranking signals become work orders instead of screenshots. The point is not to replace SERP data collection. It is to close the distance between a volatility alert and the content, on-page, or link action that responds to it, without adding a project manager per client.
The category boundary matters for selection. A rank tracker is chosen against the four-layer measurement rubric 9. An execution platform is chosen against a different question: does it ingest the tracker's API cleanly, preserve human approval on every shipped change, and tie completed work back to the same rankings-to-revenue chain the client already reviews? Vectoron operates in that second category — an AI marketing execution platform with an approval-first workflow, designed to consume rank data rather than produce it.
Frequently Asked Questions
References
- 1.Search Engine Metrics.
- 2.Methods for comparing rankings of search engine results.
- 3.Designing Formulae for Ranking Search Results: Mixed Methods Evaluation Study.
- 4.Measuring the Utilization of On-Page Search Engine Optimization Elements Using the K-rank Metric.
- 5.Search Engine Optimization Metric.
- 6.A refined approach to the dynamics of rankings: taking ranking differences into account.
- 7.Google's PageRank and Beyond: The Science of Search.
- 8.SEO ROI: Measuring the Business Impact of Organic Search Investment.
- 9.How to Measure SEO ROI for Clients: Rankings to Revenue.
- 10.How to Measure SEO ROI in 2026.
- 11.What is Share of Voice in SEO? The 2026 Guide to Measuring Share of Voice.
- 12.Share of Voice - SEO Visibility & Competitor Benchmarking.
- 13.Predicting Web Search Result Rankings with Linear Models.