
Key Takeaways
- AccuRanker delivers high-frequency SERP capture with clean exports, making it a strong data feedstock for agencies that already own the downstream translation layer into pipeline reporting.
- Semrush Position Tracking earns its slot on breadth across SERP features and intent tagging, though narrative commentary for QBRs still falls to the account manager.
- Ahrefs Rank Tracker stands out for traffic-weighted share of voice, giving portfolio-level competitive benchmarking a more defensible frame than raw position counts 1.
- SE Ranking compresses the recurring deck cycle through white-label portals and scheduled reports, which matters most where reporting hours, not SERP capture, erode retainer margin.
- Nozzle lands full SERP data in BigQuery, unlocking direct joins to CRM and revenue tables for agencies with data engineers or mature warehouse-based reporting stacks.
- STAT Search Analytics supports enterprise retainer defense through daily tracking at high keyword volumes with tag, market, and device segmentation piped via API into BI layers.
- Vectoron consumes rank data alongside call, CRM, and paid signals to produce ranked, approval-ready actions, shifting retainer defensibility from reporting into execution.
Why Position Data Stopped Defending Retainers
Ranking reports used to close renewal conversations. A screenshot of green arrows next to fifteen keywords was enough to justify a five-figure monthly fee. That era is over, and the reason shows up on the executive dashboards agency work is meant to influence.
Forrester's 2023 measurement research found that 41% of B2B marketers report marketing-sourced pipeline or marketing-sourced revenue as a performance indicator on their CMO dashboards 10. The number matters less for its size than for what it excludes. Average position, share of voice, and keyword-count deltas do not appear on that surface. When a CFO or CRO opens the quarterly review, the line items that survive are the ones denominated in pipeline dollars, sourced revenue, or cost per opportunity. A rank tracker that stops at position outputs a report the executive layer has already stopped reading.
Forrester's separate guidance on ROI measurement puts the same pressure on the vendor side: marketing ROI is treated as the definitive judge of performance in B2B, and organizations that cannot operationalize it lose budget arguments to functions that can 14. For agencies, that reframes the rank tracker category. The tool is no longer the deliverable. It is the raw feedstock for a translation layer that has to reach pipeline language before the retainer meeting starts.
The Rubric: Four Axes That Separate Rank Trackers From ROI Instruments
SERP Fidelity: Why Average Position Is a Weak Standalone Signal
Rank tracking is an ordered retrieval problem, and the academic literature on retrieval evaluation is unambiguous about what a single position number leaves out. NIST's TREC evaluation measures treat recall and precision as complementary, not interchangeable 1, and modern deep-learning retrieval benchmarks use NDCG@10 precisely because it weights graded relevance across the top of the results page rather than reducing performance to a scalar 3.
Translated to agency reporting, SERP fidelity means three things: how often the tool captures the SERP, whether it captures the SERP feature stack the query actually returns (AI Overviews, local packs, video, product grids), and how it handles graded visibility rather than binary presence. A tool that reports position 4 on a query where an AI Overview and three product tiles consume the visible viewport is describing a ranking that no user sees. Fidelity is the floor. Without it, every downstream metric inherits the same measurement error.
Outcome Linkage: Connecting Position Movement to Pipeline and Revenue
The second axis measures how directly the tool wires ranking movement into the metrics that actually appear on the CMO dashboard. Forrester's guidance treats marketing ROI as the definitive judge of B2B marketing performance, and organizations that cannot operationalize it lose budget arguments to functions that can 14.
Outcome linkage scores what a tool does natively: does it join keyword position to Search Console clicks, to CRM opportunity stages, to closed-won revenue by landing page? Tools that stop at organic sessions push the join into a spreadsheet, which pushes the labor onto an analyst, which pushes the retainer conversation back to vanity metrics. Tools that carry the join to pipeline let the account team open the QBR at revenue and work backward to rank as a leading indicator.
Reporting Labor Absorbed: The Hidden Margin Line
The third axis is the one that shows up on the P&L. Every hour an analyst spends reconciling exports, rebuilding slides, and writing narrative commentary is an hour the retainer has to price for. Reporting labor absorbed measures how much of that cycle the tool eliminates versus how much it displaces into a data team.
McKinsey's productivity work sets a top-down ceiling on what is achievable: generative AI could increase marketing function productivity by 5% to 15% of total marketing spending 4. That range is a scope for the marketing function overall, not a vendor-specific benchmark, but it establishes the order of magnitude an agency should expect from automating reporting labor rather than adding an analyst.
Executive-Readable Output: What a CMO Actually Reads
The fourth axis is the delivery format. A CMO reading a Monday morning summary is not scanning a keyword table. She is reading a two-sentence narrative that says which programs moved pipeline, which regressed, and what the recommended action is. Executive-readable output measures whether the tool produces that narrative or expects the account manager to write it from scratch.
This axis is where most rank trackers score lowest. They export well and visualize adequately, but they treat narrative as out of scope. Tools that produce a defensible one-page summary in pipeline language, with rank movement as supporting evidence rather than the headline, are the ones that survive the executive review cycle.
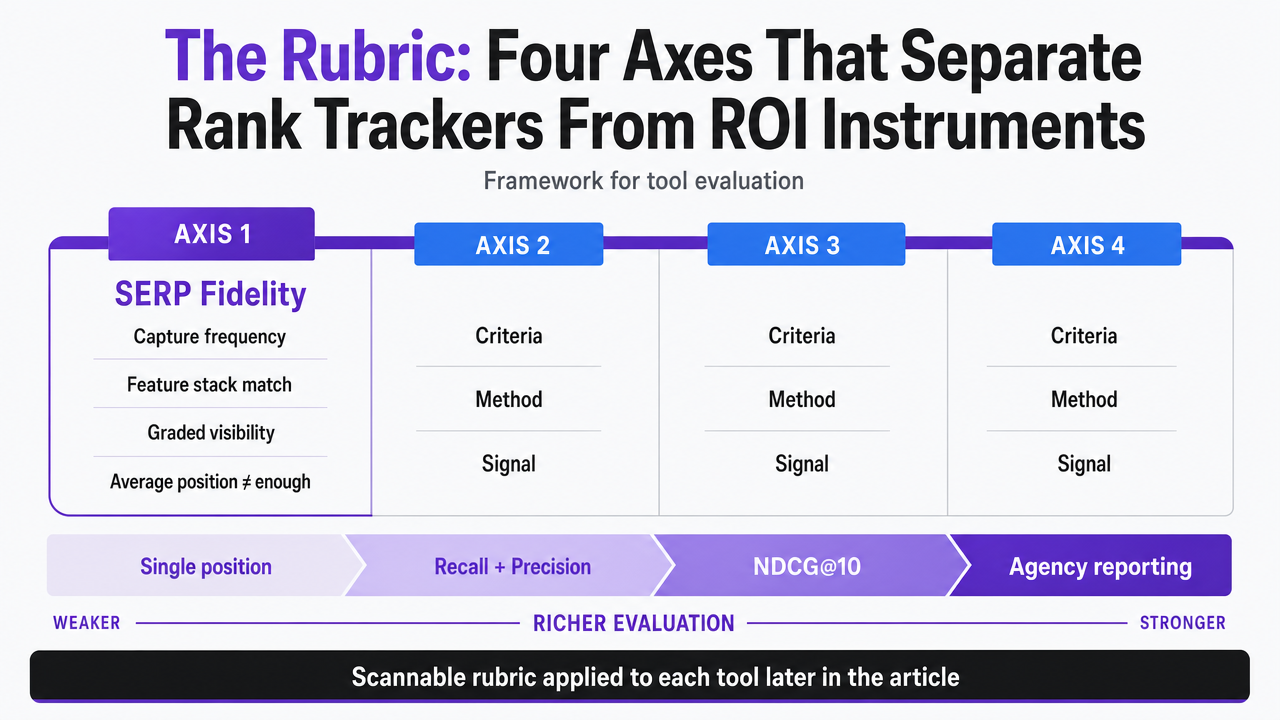 Visualize the four evaluation axes introduced in this section as a framework diagram, giving readers a scannable reference for the rubric applied to each tool later in the article
Seven Tools Scored Against the Rubric
AccuRanker: High-Frequency SERP Capture as a Data Layer
AccuRanker's positioning is narrow by design: daily and on-demand SERP capture at scale, exported cleanly into whatever reporting stack the agency already runs. On the fidelity axis, it scores high. Capture cadence is fast enough to catch volatility during algorithm updates, and SERP feature detection covers the visible surface most queries actually return.
Outcome linkage is where the tool defers to the buyer. It integrates with Search Console, Analytics, and Looker Studio, but it does not carry ranking movement into pipeline on its own. Reporting labor absorbed sits in the middle of the range: the exports are clean, but a human still writes the narrative. Executive-readable output is minimal by design. The tool is best understood as the top of a stack rather than the whole stack, which suits agencies that already own the translation layer downstream and need a reliable feedstock into it.
Semrush Position Tracking: Breadth Across the SERP Feature Set
Semrush earns its place in agency stacks on breadth rather than depth of any single axis. Position Tracking covers a wide SERP feature inventory, tags queries by intent, and rolls up visibility across tagged segments the agency defines. Fidelity is adequate for most reporting cycles, though capture frequency is coarser than a pure tracker.
Outcome linkage improves when the account team wires in the ImpactHero and Analytics integrations, but ranking data still terminates at organic sessions rather than sourced pipeline. Reporting labor absorbed is higher than the pure-tracker tier because the platform generates scheduled PDF and Looker reports natively. Executive-readable output remains templated: the deck is delivered, but the narrative commentary that survives a QBR still comes from the account manager. Semrush earns its slot as a broad research and tracking layer, not a translation layer.
Ahrefs Rank Tracker: Coverage-Weighted Visibility for Portfolio Reporting
Ahrefs Rank Tracker reads more usefully when scored alongside the platform's Site Explorer and content data than as a standalone rank product. The distinguishing feature is share-of-voice weighted by estimated traffic potential, which addresses the recall-versus-precision tension NIST retrieval work flags in ordered evaluation: a keyword covered at position 3 with real search demand contributes more to portfolio visibility than one covered at position 1 with none 1.
On fidelity, the tool is competitive but not category-leading on cadence. Outcome linkage is limited to Search Console signals unless the agency builds the join externally. Reporting labor absorbed is moderate; the visualizations are executive-adequate but the narrative is still analyst-written. The tool's real ROI case for agencies sits in portfolio-wide competitive benchmarking, where the traffic-weighted visibility score gives account teams a defensible way to talk about progress on accounts where a handful of terms dominate the value.
SE Ranking: White-Label Reporting Automation for Agency Delivery
SE Ranking's rubric profile is almost the inverse of AccuRanker's. Fidelity is respectable but not the differentiator; the tool wins on reporting labor absorbed. White-label client portals, scheduled reports, and drag-and-drop report builders reduce the per-client hours that account managers spend rebuilding decks each month.
Outcome linkage extends to Search Console, Analytics 4, and Google Business Profile, which lets agencies show a rank-to-traffic-to-conversion chain inside a single interface, though closed-won revenue still requires a CRM join outside the platform. Executive-readable output is templated but presentable: the client-facing portal is the deliverable, which shifts the conversation from monthly report production to portal review. For agencies whose margin problem is the reporting cycle rather than the SERP capture cycle, this is the tier where analyst hours per client compress most visibly.
Nozzle: BigQuery-Native Data for Custom Attribution Models
Nozzle sits at the opposite end of the spectrum from a white-label reporting tool. It captures full SERP data at high fidelity and lands it in BigQuery, which is where its ROI logic starts. For agencies with a data engineer or a strong analytics partner, that architecture allows ranking data to be joined directly to CRM opportunities, ad platform spend, and revenue tables without an export step.
On the rubric, fidelity is high, outcome linkage is high in potential but requires build effort, reporting labor absorbed is low out of the box, and executive-readable output depends entirely on what the agency layers on top. The right buyer profile is narrow: agencies serving enterprise clients with in-house data teams, or agencies that have already invested in a warehouse-based reporting stack and need a rank data source that fits it. For agencies without that infrastructure, the tool's ROI case does not close.
STAT Search Analytics: Enterprise-Grade Segmentation for Retainer Defense
STAT, part of Semrush after its acquisition from Moz, is built around daily SERP tracking at large keyword volumes with heavy segmentation by tag, market, and device. Fidelity is high, and the segmentation model is the feature that supports retainer defense on enterprise accounts where a single share-of-voice line hides more than it explains.
Outcome linkage is API-driven rather than native to a dashboard, which is a strength for agencies feeding data into custom reporting environments and a weakness for those expecting turnkey client decks. Reporting labor absorbed is moderate; the platform generates scheduled reports, but enterprise buyers typically pipe the data into a BI layer where a data team writes the narrative. Executive-readable output belongs to that downstream layer. STAT earns its slot when the client roster includes accounts tracking tens of thousands of keywords across regions and the segmentation itself is the value delivered.
Vectoron: Approval-Workflow Layer That Consumes Rank Data
The last option in the shortlist is not a rank tracker. It is the layer that consumes rank data alongside call intelligence, CRM signals, and paid metrics, then converts movement into ranked, approval-ready actions across content, technical SEO, backlinks, and PPC. Fidelity is inherited from whichever tracker feeds it. The rubric shift happens on the other three axes.
Outcome linkage is native, because the platform reads live business data — qualified calls, bookings, cost per lead — and ties recommendations to those metrics rather than to sessions. Reporting labor absorbed is where the model earns its keep: recommendations arrive with strategic reasoning attached, and the Command Center routes them for human sign-off before execution, which collapses the briefing-to-publish loop that traditionally consumes analyst hours. Executive-readable output is the deliverable rather than a byproduct. For agencies that have already commoditized SERP capture, this tier is where retainer defensibility gets rebuilt.
Test real rank tracking impact risk-free
Validate your client rank reporting workflows on live projects before making a commitment.
Rubric Scorecard: Reading the Four Axes Side by Side
Placing the seven tools on a single frame clarifies what the rubric actually measures. SERP fidelity rewards capture cadence, feature-stack detection, and graded relevance handling — the same properties NIST retrieval work isolates when it separates recall from precision and treats ordered evaluation as more informative than binary presence 1. Outcome linkage rewards native joins to pipeline signals rather than exports that terminate at sessions. Reporting labor absorbed rewards the elimination of analyst hours, not their displacement. Executive-readable output rewards narrative delivery in pipeline language.
Scored against those axes, the shortlist sorts into three tiers. AccuRanker, Nozzle, and STAT lead on fidelity and defer downstream on translation. Semrush and Ahrefs cluster in the middle, trading depth on any single axis for breadth across research and tracking workflows. SE Ranking wins on reporting labor absorbed for agencies whose margin problem is the deck cycle rather than the capture cycle. The execution-and-approval tier scores lowest on native fidelity, because it consumes rank data rather than producing it, and highest on outcome linkage and executive-readable output.
The scorecard is not a leaderboard. A high fidelity score means little to an agency drowning in reporting hours, and a high labor-absorption score means little to an enterprise buyer whose data team writes the narrative. The rubric is a diagnostic: it locates the axis on which each retainer is most exposed and directs tool selection there.
Portfolio Economics: What Each Tier Costs in Analyst Hours
Signaling the Shift: For Agencies Running Portfolios Above 20 Accounts
The rubric so far has treated tool selection as a per-account decision. At portfolio scale, that framing breaks. For agencies running 20 or more accounts, the deciding variable is not which tool captures the SERP most faithfully on any single retainer. It is which tier of tool absorbs the most repeatable analyst labor across the book. The next two sections shift the audience from account leads evaluating a single stack to portfolio operators managing delivery capacity, margin, and renewal cadence across dozens of clients simultaneously.
A Four-Tier Consolidation Table for Portfolio Operators
The table below organizes the shortlist into four consolidation tiers and names the variables an operator plugs in to size the labor impact for a specific book. No vendor-specific dollar figures appear because the research supplied does not include audited per-vendor ROI numbers. The productivity anchors in the automation and execution rows are drawn from McKinsey's sizing of generative AI in the marketing function, which places the achievable range at 5% to 15% of total marketing spending 4, with mature adopters in the marketing function reporting 22% efficiency gains as a separate, more advanced data point 6. Both figures describe the marketing function overall, not rank-tracker deployments in isolation.
| Tier | Representative Tools | Primary Labor Absorbed | Operator Variables to Plug In ||------|----------------------|------------------------|-------------------------------|| Raw tracker | AccuRanker, Nozzle, STAT | SERP capture and export | Analyst hourly cost; hours per client per month on reporting; clients per portfolio; cost per tracked domain || Tracker + BI layer | Ahrefs, Semrush, STAT via API | Capture plus dashboarding | Above, plus BI licenses and data-engineer time per portfolio || Tracker + reporting automation | SE Ranking | Capture, dashboarding, and templated narrative | Above, minus estimated deck-production hours per client per month || Execution and approval layer | Category the article positions Vectoron within | Recommendation, briefing, publishing coordination | Above, plus recommendation-to-execution cycle time and approval-queue throughput |
Operators sizing the bottom two rows should hold the 5%–15% band as the top-down ceiling for what automation can plausibly return across the marketing function 4, and treat the 22% figure as achievable only where AI adoption has matured across the workflow, not as an out-of-the-box vendor benchmark 6.
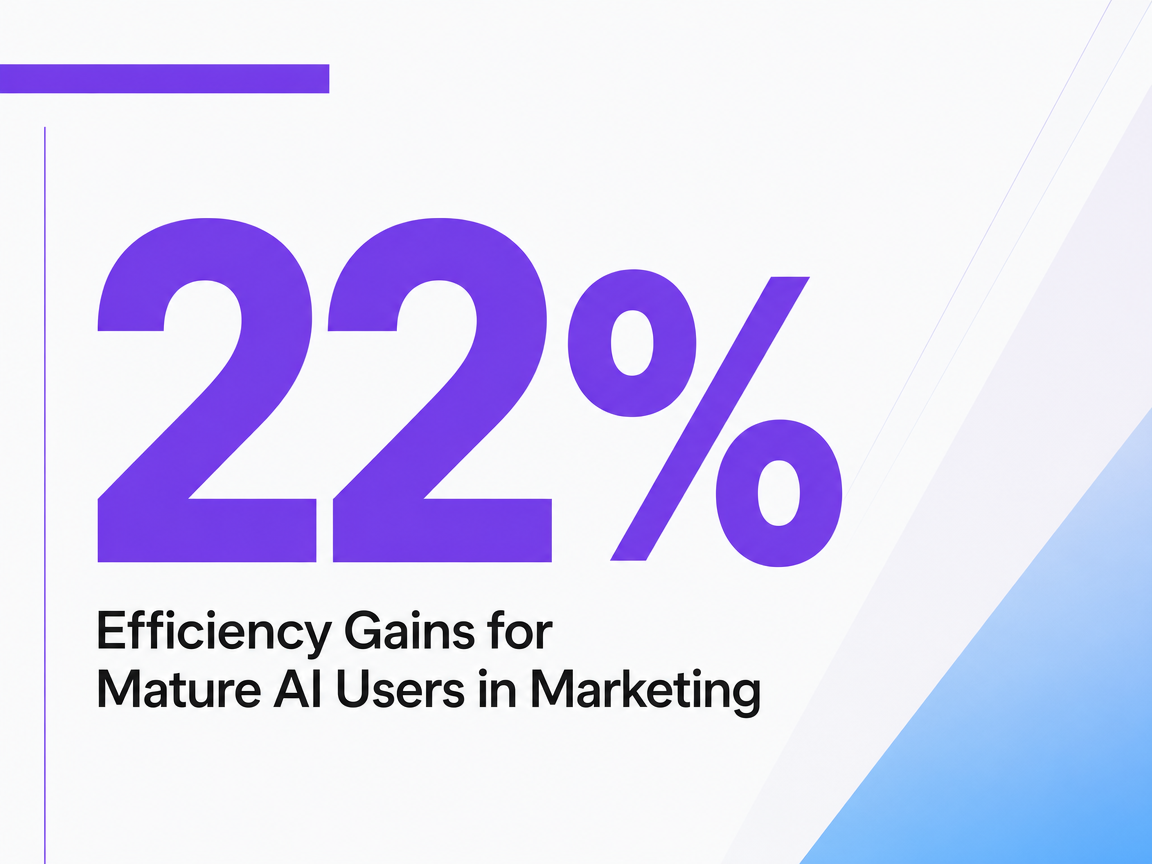 Efficiency Gains for Mature AI Users in Marketing
Efficiency Gains for Mature AI Users in Marketing
TEI-Style Worksheet: Net Benefit Over Twelve Months
Forrester's Total Economic Impact framework structures martech ROI as net benefit over cost across a defined horizon, adjusted for risk 15. Applied to rank tracker selection, the worksheet has four inputs and one output. The inputs are:
- annualized tool cost across the portfolio,
- avoided analyst hours multiplied by fully loaded hourly cost,
- retainer defense value measured as retained monthly revenue on renewal-at-risk accounts,
- and a risk adjustment reflecting how much of the labor absorption is realized in practice rather than in theory.
The output is twelve-month net benefit.
Operators building the worksheet should keep the risk adjustment conservative on the automation and execution tiers. MIT Sloan's survey data on AI marketing investments shows meaningful outcomes — a 7.2% decrease in marketing overhead costs among adopters — but also notes that many organizations struggle to move pilot results to enterprise value 12. The net-benefit calculation is defensible when the assumed absorption sits inside that observed range.
See How Leading Agencies Quantify SEO Wins with Real-Time Rank Tracking
Request a walkthrough of advanced, multi-site rank tracking dashboards built for agencies focused on transparent reporting, cross-channel impact, and measurable client ROI.
Blended Reporting: Where Organic Rank Data Meets Paid and Pipeline
Rank data rarely reaches the executive layer alone. It arrives inside a blended report that also carries paid search performance, direct response, and pipeline contribution, and the interaction between those channels is where reporting most often misleads. Ghose and Yang's academic comparison of organic and sponsored search performance found that differences in paid search metrics across ranking scenarios are frequently not statistically significant, which means incrementality between the two channels is harder to isolate than a side-by-side dashboard suggests 8. A rank tracker that reports position gains next to a paid dashboard reporting conversions does not, on its own, establish that the organic movement caused the pipeline movement.
The operational consequence for agency reporting is specific. When organic and paid queries overlap, position improvements on branded and high-intent terms often coexist with paid clicks that would have converted anyway. A defensible blended report separates queries by whether paid was bidding on them during the reporting window, weights organic contribution by SERP feature exposure rather than raw position, and treats pipeline as the joined outcome rather than the sum of channel-level clicks. Tools scoring high on outcome linkage in the earlier rubric do part of that work natively. The rest lives in the translation layer, which is where retainer defensibility either holds or does not.
Selection Guidance by Agency Shape
Tool selection tracks agency shape more reliably than agency size. Three shapes dominate the shortlist.
- Boutique agencies under fifteen accounts with strong account-manager craft should buy on SERP fidelity and accept the analyst hours. A raw tracker paired with the account team's own narrative preserves margin better than paying for an automation layer the team will half-use.
- Mid-market agencies between fifteen and fifty accounts, where the deck cycle is the binding constraint, should buy on reporting labor absorbed. The white-label reporting tier compresses the recurring hours that quietly erode retainer margin.
- Agencies with enterprise clients running warehouse-based reporting stacks should buy on data architecture fit, not on dashboard polish.
The fourth shape is the agency treating rank data as an input to execution rather than a deliverable. That book buys on outcome linkage and executive-readable output, and it selects the tier where recommendations arrive pre-reasoned and approval-ready. Vectoron sits in that tier for teams rebuilding retainer defensibility on the execution side of the reporting line.
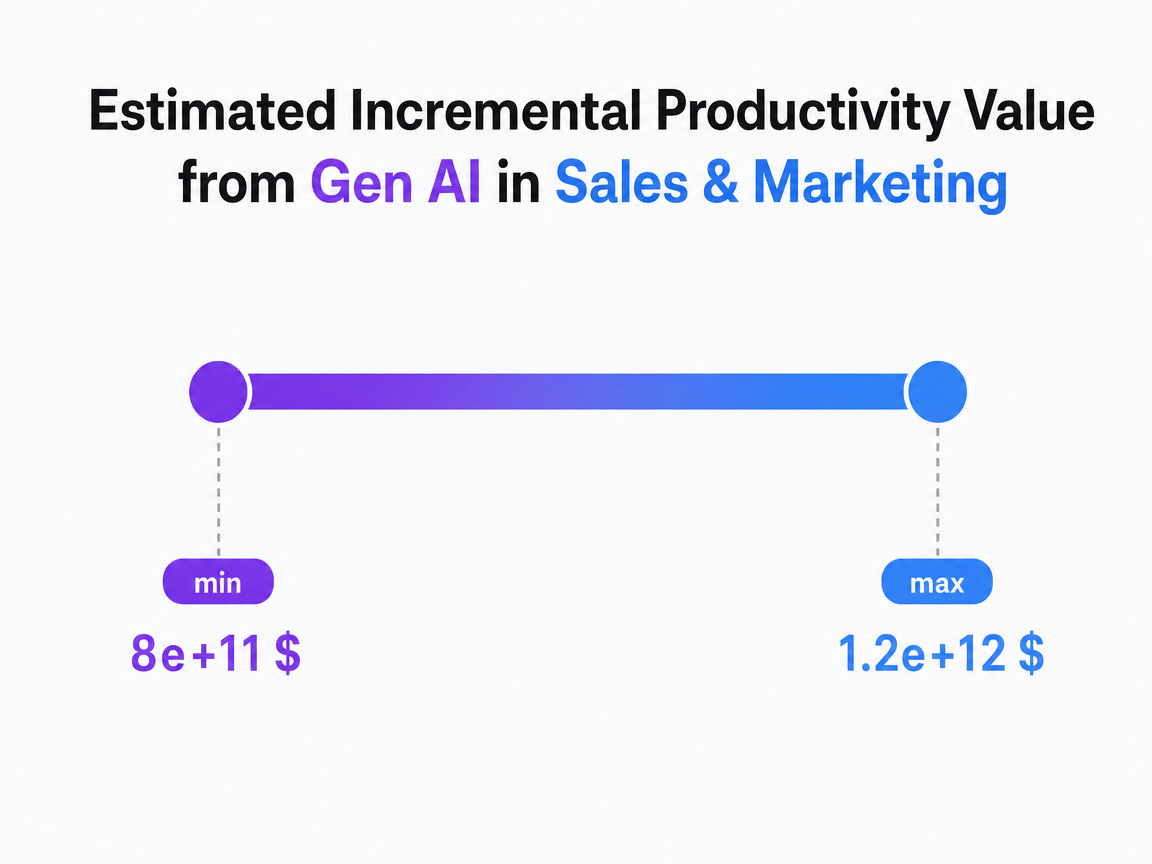 Estimated Incremental Productivity Value from Gen AI in Sales & Marketing
McKinsey estimates an incremental $0.8 trillion to $1.2 trillion in productivity value across sales and marketing from generative AI.
Frequently Asked Questions
References
- 1.1 Common Evaluation Measures • Recall.
- 2.Retrieval Evaluation with Incomplete Information.
- 3.OVERVIEW OF THE TREC 2020 DEEP LEARNING TRACK.
- 4.Economic potential of generative AI.
- 5.How generative AI can boost consumer marketing.
- 6.A marketing organization that thrives with AI.
- 7.Harnessing generative AI for B2B sales.
- 8.Comparing Performance Metrics in Organic Search with Sponsored Search Advertising.
- 9.Gain Consumer Insight With Generative AI.
- 10.The State Of B2B Marketing Measurement, 2023.
- 11.The Latest And Greatest Marketing Measurement Service Providers.
- 12.When AI Investments Pay Off in Marketing.
- 13.The value of getting personalization right—or wrong—is multiplying.
- 14.How To Measure Marketing ROI.
- 15.Model The ROI Of Enterprise Marketing Technology Investments.