
Key Takeaways
- Rank tracking measures eligibility, not revenue; treat it as one input inside a four-layer stack covering visibility, click, selection, and utilization to reach a CFO-ready conclusion.
- Click share follows position reliably, but SERP features and query type distort standard CTR curves, so pair average position with SERP-feature flags and compare modeled clicks against Search Console.
- Selection variance often explains why identical rankings produce different revenue: review volume outweighs star rating 1, and profile completeness independently shapes patient choice 4.
- Standardize the join key from keyword cluster to landing page to call tracking number to CRM source at onboarding; above roughly thirty clients, reconciliation hours otherwise overtake delivery hours.
Why Top-5 Visibility Still Loses the Revenue Argument
Rank tracking persists in client reviews because it demonstrates activity. A weekly change on a keyword grid provides a sense of progress. However, this approach falters when confronted with a CFO's fundamental question: what revenue did this movement generate?
The concentration of clicks on search engine results pages (SERPs) explains why agencies often prioritize position reports. A study comparing search behavior on Google and Bing revealed that the first result on Google captured 51.3% of clicks, while the top five results accounted for over 86% of clicks. Furthermore, 97.11% of clicks remained on the first page of results 10. While this study examined aggregate click behavior across general queries, it strongly suggests that ranking improvements are significant—losing positions below the top five results in a substantial reduction in traffic.
However, this same data does not directly predict revenue. A law firm and a dental practice could both rank second for their target terms in the same city and experience vastly different revenue outcomes. Click share is a function of the SERP, but booked revenue depends on what happens after the click: whether the business profile is compelling, if the intake team responds promptly, if the caller is qualified, and if the appointment is kept.
Agencies reporting only on position changes, without integrating downstream data, are focusing on the top of the funnel, while clients are evaluating the bottom line. This article will treat rank tracking as one measurable component within a four-layer framework—visibility, click, selection, and utilization—and demonstrate how delivery teams can integrate these layers across a client portfolio without increasing analyst headcount per account.
The Four-Layer Measurement Stack: Visibility, Click, Selection, Utilization
Visibility as a Revenue Precursor, Not a Revenue Metric
Visibility is crucial in revenue discussions because search is the primary starting point for high-intent demand. A review of health information-seeking behavior found that 83% of consumers used general search engines like Google or Yahoo as their initial entry point, with 78% reporting a success rate above 60% for these searches 2. This indicates that search engines are dominant at the top of the funnel for most verticals agencies serve.
Visibility secures a place at the revenue table, but it is not a revenue metric itself.
An agency reporting keyword position without accompanying downstream data is merely confirming eligibility. The client became eligible to be chosen. Whether selection occurred, if the intake team answered the call, or if the caller matched the ideal-patient profile—none of this information resides in a rank tracker. A dental practice ranking third for its most valuable implant term will still struggle with revenue if its Google Business Profile (GBP) is incomplete, its phone goes to voicemail after 5 p.m., or its intake team fails to pre-qualify callers. Research on healthcare digital marketing emphasizes that effective measurement requires linking online engagement metrics with acquisition and retention outcomes, rather than stopping at engagement alone 5.
For delivery teams, the practical implication is clear: rank data belongs at the beginning of a client report, explaining the supply of qualified impressions. It does not belong at the end, where the revenue conclusion is drawn.
Click Behavior: Where Rank Data Actually Predicts Traffic
Click behavior is the one layer where rank data largely fulfills agency claims. Position consistently determines click share across general query types, and the impact is significant enough that even a single position gain within the top five can lead to a material change in traffic 10.
Delivery teams should approach this layer as a modeling exercise rather than a reporting one. Given a keyword set with average position, search volume, and established CTR curves, a skilled SEO lead can generate a reliable estimate of incremental clicks resulting from a rank improvement. This estimate represents traffic generated by visibility, expressed in units the client can compare against actual Search Console data.
Two important caveats ensure accuracy at this layer. First, click distribution changes with SERP features. A featured snippet, local pack, knowledge panel, or AI overview compresses the click-through rate for the traditional ten blue links below it, none of which are reflected in a standard rank tracker. Second, the click-share figures commonly cited are derived from studies of general query behavior. Branded queries, transactional queries within a local pack, and long-tail informational queries exhibit different behaviors. An agency reporting modeled clicks without considering SERP composition is presenting misleading data.
The operational takeaway: pair average position with a SERP-feature flag for each tracked keyword, and report modeled clicks alongside observed clicks from Search Console. Discrepancies between the two should be treated as diagnostic insights, not anomalies to be concealed.
Selection Behavior: How Reviews and Profile Features Impact Top-3 Results
Selection behavior is where rank tracking's predictive power significantly diminishes, and where academic literature offers valuable insights for reframing client discussions. A top-3 organic result competes with the local pack above it, paid results alongside it, and—within each of these—reputation signals that operate independently of rank.
Content analysis of two online healthcare communities found that the number of reviews was more influential than the overall star rating in affecting patient decisions. This research also highlighted how online services complement offline appointments in shaping outpatient visit volume 1. This finding is critical because it challenges the common agency shorthand: a 4.8-star average is not the primary advantage; review volume is. A provider with 4.6 stars and 800 reviews is likely to be chosen over a provider with 4.9 stars and 40 reviews, even from the same SERP position.
Profile features also play a significant role. A study on physician selection in online health communities identified several profile attributes that positively and measurably influenced selection behavior, and confirmed that online word-of-mouth positively affected patient choice 4. For agencies, this means a complete Google Business Profile with accurate hours, services, staff photos, and current posts is not merely a hygiene task; it is a conversion asset that determines whether a top-3 ranking generates a call.
This layer is where delivery teams should enforce standardization across a client portfolio. Review acquisition cadence, response rates to negative reviews, GBP field completeness, and profile photo currency are all auditable per client and can be aggregated at the portfolio level. When a client questions why two of their locations with identical rankings produce different call volumes, this layer often provides the answer more effectively than backlinks or on-page SEO. Reporting that treats reviews and profile features as separate deliverables, rather than as economic inputs to rank-conversion, overlooks a key argument for retainer value.
Utilization: Turning Exposure Into Bookings, Calls, and Revenue
Utilization is the layer clients truly value and pay for. It is also the layer most agencies under-measure because it typically resides outside SEO tools—in call platforms, scheduling systems, and CRMs that report on different schedules.
Research on exposure-to-utilization is instructive. Greater exposure to online health information is associated with increased utilization of health services among specific populations, though this varies by demographic and condition 8. The elasticity is not uniform; two clients with similar visibility gains can experience different booking curves depending on who is searching and what existing barriers lie between the click and the appointment.
What delivery teams should instrument at this layer is more focused than most attribution models suggest. In dental practice growth research, appointment bookings and treatment acceptance are identified as the key ROI metrics for evaluating digital marketing performance 9. A retrospective analysis of orthodontic practices linked enhanced digital presence to increased new patient starts and revenue growth 6. Neither study elevates sessions, impressions, or position to the primary ROI unit; both emphasize booked appointments and completed treatments.
The operational translation: every tracked keyword set should have a defined utilization event associated with it—a booked appointment for a dental client, a completed intake call for a behavioral health client, or a signed retainer for a law firm. Report the utilization event alongside rank movement in the same view, not on separate slides weeks apart. When the utilization event is clearly defined per client and instrumented consistently, the four-layer stack forms a cohesive narrative that a CFO can readily evaluate: visibility increased, clicks followed, selection was strong, and bookings improved.
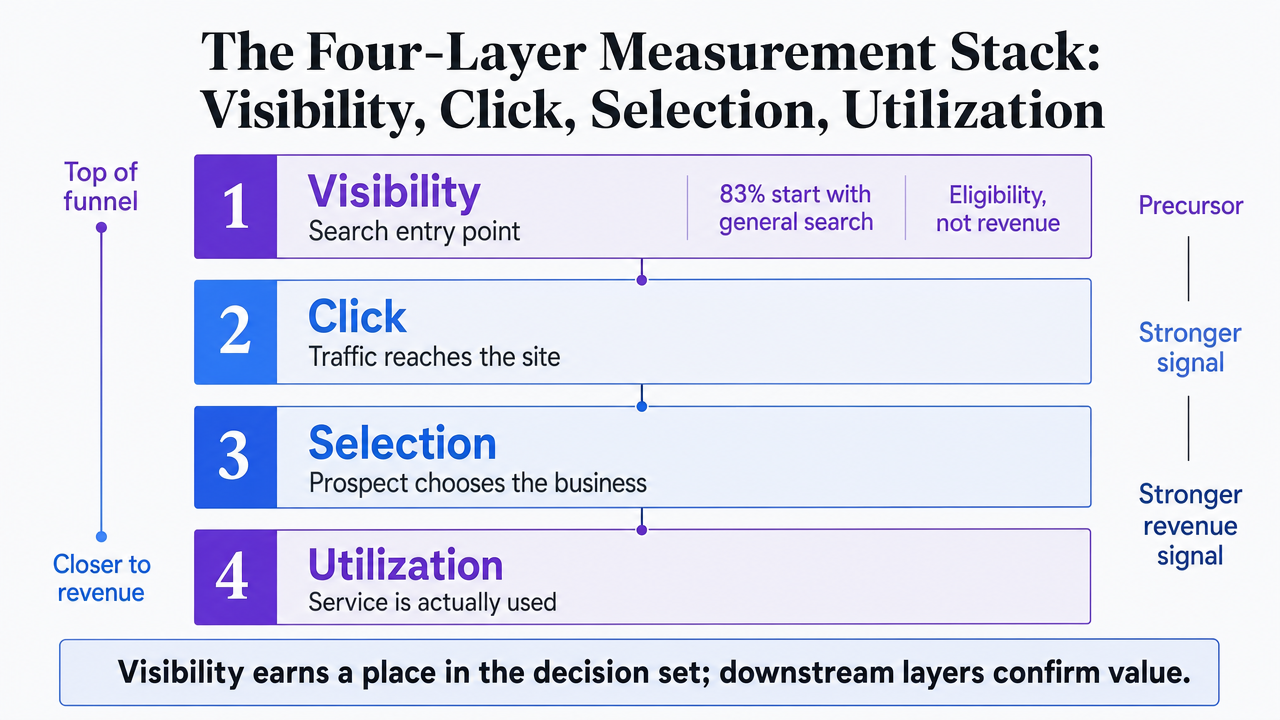 Visualize the four-layer framework that structures the entire article: Visibility, Click, Selection, Utilization. This directly maps to the section's explicit framework and each subsection
Connect Organic Rankings Directly to Client Revenue
Measure how keyword movements impact client revenue with real data during a full-access trial.
Wiring Rank Data to Downstream Conversion Events
The Instrumentation Chain: GSC, GBP, Call Tracking, CRM
The four-layer stack is effective only when it maps to specific data sources for each client, in a fixed order, with a defined join key. Delivery teams that neglect this ordering treat every client as unique, rebuilding the data pipeline for each account.
The robust data chain involves:
- Search Console for tracked keyword position and organic clicks,
- Google Business Profile Insights for local-pack impressions and profile-driven actions (like directions requests and click-to-call),
- a call tracking platform for inbound phone volume with dynamic number insertion linked to organic sources, and
- the client's CRM or practice management system for the utilization event that completes the loop.
Research on healthcare digital marketing underscores this requirement: measurement must connect online engagement metrics with acquisition and retention outcomes, not merely engagement 5. In dental contexts, this means focusing on booked appointments and treatment acceptance rather than sessions 9.
The join key is more critical than the specific tools chosen. A tracked keyword cluster needs a corresponding landing page URL, which needs a matching dynamic call tracking number, which in turn needs a matching CRM source field. If any link in this chain is missing, client reports default to correlation masquerading as attribution—e.g., "rank rose, calls rose, therefore..." Delivery teams should audit this chain for each client during onboarding and standardize the join key format before the first report is generated. This initial effort prevents the reconciliation burden that accumulates across a portfolio, a topic discussed later in this article.
Vertical Carve-Out: Behavioral Health and Regulated Attribution
Behavioral health presents a unique challenge to the standard instrumentation chain, requiring a different attribution logic for agencies serving this vertical. The typical assumption—that a booked appointment can be traced back to a specific keyword via pixel-based tracking and CRM handoff—conflicts with privacy and stigma considerations that are central to behavioral health, as highlighted in research. Peer-reviewed work on behavioral health marketing emphasizes that digital efforts must be evaluated based on service utilization and clinical engagement, not just reach, and that conventional tracking practices raise specific concerns within this vertical 7.
The operational adjustment is to shift attribution upstream from individual conversion events to the aggregate utilization curve. Instead of linking one caller to one keyword, delivery teams should report on tracked keyword visibility alongside the total qualified intake volume for the reporting period, benchmarked against a stable baseline. The unit of analysis becomes weekly or monthly intake relative to modeled organic exposure, rather than a per-caller path.
Call tracking remains viable if the platform supports compliant configurations—no recording, restricted Protected Health Information (PHI) capture, and tokenized session identifiers. However, the CRM join simplifies to counts rather than identified records. Agencies reporting behavioral health results should clearly state this constraint upfront, as the client's compliance officer will certainly raise it if the report does not. The measurement stack still holds; the join key transforms from an identifier to a time period.
Access Barriers and the Uneven Revenue Elasticity of Rank Gains
Identical rank movements can lead to different revenue outcomes across clients, and this variance isn't always explained by profile quality or intake performance. Access barriers between the click and the appointment also play a role. Research on online health information seeking and healthcare access directly states that differences in access shape whether search visibility translates into visits, and the post-pandemic reliance on the internet has made this mediation more apparent 3. Another paper on search-to-utilization pathways adds that the relationship between information exposure and service use varies by demographic and condition 8.
For delivery teams, this means the revenue elasticity of a rank gain is client-specific and, within a client, segment-specific. A dental group serving a metro area with commercial insurance will experience a different booking response from a position-two gain than the same group serving a Medicaid-heavy submarket, even if the keyword, SERP, and profile are virtually identical.
The operational implication is to segment reporting by geography or service line where the client's business shows significant variance, and to report elasticity as observed rather than assumed. When a rank gain does not produce the modeled booking lift, access variance should be the first hypothesis to test, not the last.
Portfolio Instrumentation for Agencies Running 25 to 75 Clients
If An Agency Manages Multiple Clients: The Reconciliation Tax
This section shifts focus from single-client measurement to agency operations. The target reader is now the delivery lead managing 25 to 75 accounts, not the strategist preparing a single quarterly review.
For a single client, the four-layer stack is a manageable weekly routine. For forty clients, it becomes a reconciliation burden that compounds with each reporting cycle. Each account typically has its own rank tracker subscription, Search Console property, Google Business Profile access, call tracking numbers, CRM or practice management export, and a unique reporting template that a client success manager manually compiles before each Quarterly Business Review (QBR). While the stack is defensible per account, it becomes unmanageable across a portfolio.
The hidden cost isn't tool expenditure; it's the analyst hours spent reconciling data that should have shared a common join key from the outset. Delivery teams often find themselves copying rank exports into spreadsheets, re-mapping call tracking labels to keyword clusters, and reconciling CRM source fields inconsistently entered by intake staff. Research on healthcare digital marketing emphasizes the need for measurement to link engagement metrics to acquisition and retention outcomes to evaluate ROI 5. In dental settings, the key outcome units are booked appointments and treatment acceptance, not sessions or positions 9. The instrumentation itself is consistent across clients; only the reconciliation is bespoke, primarily because most agencies fail to standardize it.
Hours-Per-Client Economics of a Consolidated Rank-to-Revenue Workflow
The economic argument for consolidation is more easily framed in hours than in dollars, as hours are a variable an agency operations lead directly controls. Instead of modeling hypothetical vendor prices, delivery teams should quantify the reconciliation burden in analyst time per client per month and let the portfolio-level math reveal the true cost.
A practical framework uses four variables, which the reader should derive from their own operations:
- the number of clients managed,
- the number of tools per client in the rank-to-revenue chain,
- the analyst hours per client per month spent reconciling these tools, and
- the equivalent hours under a consolidated workflow where the join key is defined once.
The comparison table below uses placeholders instead of arbitrary figures.
| Variable | Fragmented per-client stack | Consolidated workflow |
|---|---|---|
| Tools in the rank-to-revenue chain per client | Rank tracker + call tracking + CRM connector + reporting tool (4 vendor logins) | One governed workflow with a fixed join key |
| Analyst hours per client per month for reconciliation | H hours (agency-measured) | H′ hours after standardization |
| Portfolio hours per month at N clients | N × H | N × H′ |
| Vendor relationships to manage at N clients | Up to 4N | 1 workflow, N accounts inside it |
Agencies that calculate 'H' from timesheets almost invariably find the reconciliation figure to be larger than the delivery figure once the portfolio exceeds approximately thirty clients. This inversion highlights the economic case: analyst hours that should be dedicated to selection-layer work—such as review acquisition cadence, GBP field completeness, and profile-driven actions linked to selection behavior 4—are instead consumed by stitching together data exports.
The operational strategy is to standardize the join key format before scaling the client roster, not after. A tracked keyword cluster must link to a landing page URL, which connects to a dynamic call tracking number, which then ties to a CRM source field with a consistent taxonomy. When this chain is enforced during onboarding, the marginal cost of adding the fortieth client to a portfolio approaches that of adding the tenth. If not, every new client increases the average hours per client, silently eroding the profit margin on the retainer.
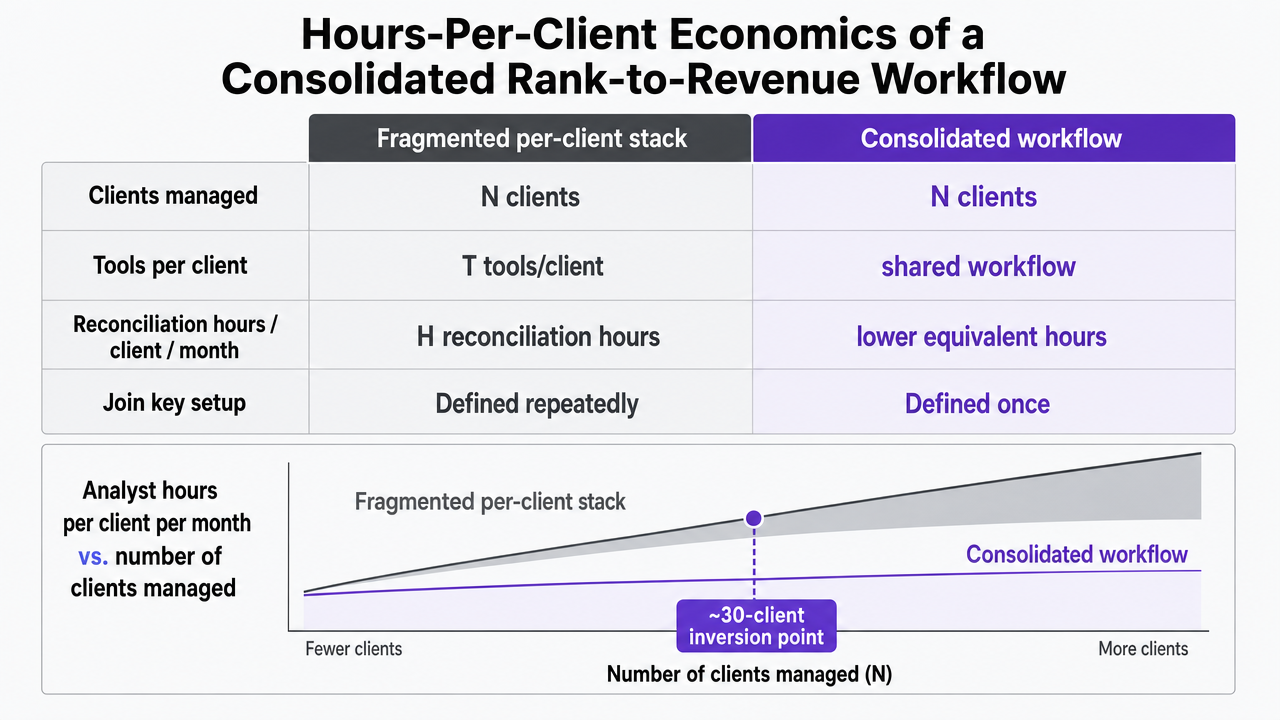 Render the comparison table from this section as a side-by-side operating-model infographic contrasting fragmented per-client stacks against a consolidated workflow, reinforcing the ~30-client inversion point mentioned in the prose
See How Tighter Rank Tracking Correlates Directly with Client Revenue Impact
Discuss how to operationalize rank tracking that ties keyword performance to actual revenue metrics—enabling your team to quantify, report, and scale SEO value for every client engagement.
What Agency Leads Report to Clients Instead of Position Changes
A client-facing report that moves beyond position changes must address three key questions sequentially: did visibility grow for important terms, did that visibility convert into contact events, and did those contact events become qualified pipeline in the CRM? Position changes belong within the first question, not as the primary focus of the report.
A practical reporting structure would begin with tracked keyword clusters, presented as impression share and organic clicks against a baseline, with SERP-feature composition noted for each cluster. The middle section would report profile-driven actions from Google Business Profile—click-to-call, directions requests, website clicks from local listings—as these are the selection-layer outputs influenced by reputation and profile completeness 4. The report would conclude with the utilization event central to the client's business: booked appointments and treatment acceptance for dental accounts 9, new patient starts for orthodontic and healthcare accounts 6, or qualified retainers for law firms.
One metric effectively conveys the narrative across all three layers: the cost per utilization event attributed to organic channels. When this metric improves for the client, the retainer's value is self-evident. If it does not, the report clearly indicates which layer—visibility, click, selection, or utilization—is underperforming, thereby defining the focus for the next reporting cycle. Position changes are relegated to an appendix, where they serve as supporting detail.
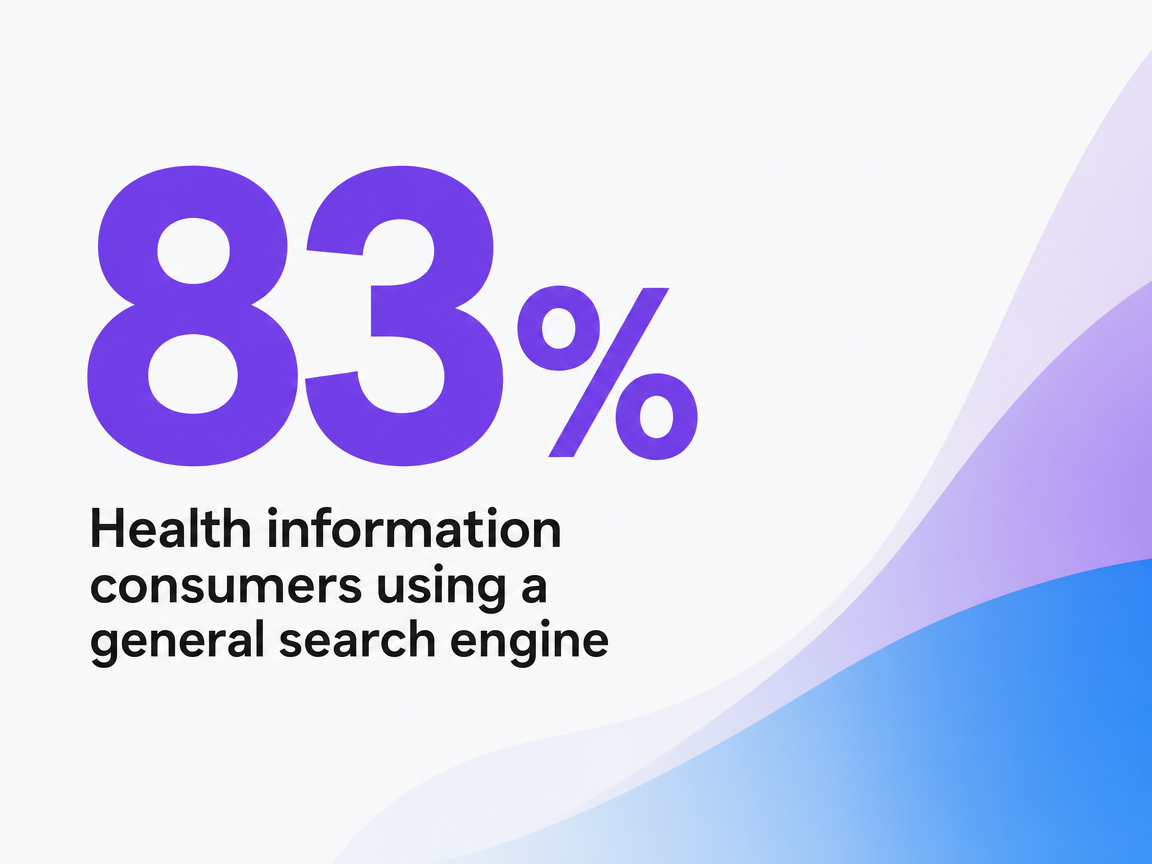 Health information consumers using a general search engine
Health information consumers using a general search engine
Frequently Asked Questions
References
- 1.How Online Reviews and Services Affect Physician Outpatient Visits: Content Analysis of Evidence From Two Online Health Care Communities.
- 2.Online Health Information Seeking Behavior.
- 3.Online health information seeking behavior, healthcare access, and social determinants of health.
- 4.Patient's behavior of selection physician in online health communities.
- 5.Digital Marketing Strategies for Healthcare Organizations.
- 6.Digital Marketing and Orthodontic Practice Growth: A Retrospective Analysis.
- 7.Digital Marketing and Patient Engagement in Behavioral Health.
- 8.Impact of Online Search Behavior on Health Information Seeking and Utilization.
- 9.Digital Strategies for Dental Practice Growth.
- 10.You are how (and where) you search? Comparative analysis ....