
Key Takeaways
- Structure client reports in three layers: outcomes like pipeline and revenue on the cover, engagement signals in the middle, and rankings at the base as diagnostic context rather than the scorecard.
- Raw position numbers no longer function as a standalone KPI because personalization, device variance, SERP features, and diverging tool methodologies mean a single integer never describes a stable reality 4.
- Rank data earns its place only when cohort movement triggers a dated hypothesis, a shipped action, and a confirmation check against engagement or pipeline signals in the same reporting cycle.
- For heads of SEO running 25 to 100 accounts, manual rank narratives quietly consume retainer margin, so cohort standardization and stakeholder-tiered deliverables are where reporting labor actually compresses 7.
The reporting artifact clients demand and experts distrust
Every agency SEO lead has watched the same scene play out. A client opens the monthly deck, scrolls past the traffic charts and pipeline attribution, and stops at the keyword ranking table. The conversation that follows is not about qualified leads or category coverage. It is about why term #14 slipped from position 3 to position 6, and whether the agency is still earning its retainer.
That instinct sits in direct conflict with what practitioners have been publishing for years. Industry commentary has argued that rankings function as noise rather than signal, calling their use as a standalone KPI effectively dead given personalized results, device variance, and diverging tool methodologies 4. A parallel practitioner critique lists nine reasons rankings misrepresent SEO performance, from volatility to algorithm churn to the snapshot problem 3. Google's own guidance steers teams toward user value and content quality rather than position-chasing 10.
Yet clients still ask. Agencies still send. The traditional ranking report remains a standard artifact in the client relationship, and templates cataloging its formats continue to circulate as a working reference for account teams 1, 2. The head of SEO managing a book of 20 to 100 accounts does not get to choose one side of that argument. The job is to run both truths inside a single deliverable.
A three-layer reporting hierarchy that survives client pressure
Outcomes layer: revenue, pipeline, and qualified leads on the cover slide
The cover slide of every client deliverable should answer one question: did the SEO program move money this month. Stakeholder research on progressive reporting to senior decision-makers is direct on this point. C-suite and upper management conversations line up to market penetration, share of voice, and revenue, not to the mechanics of individual keyword positions 7. That is what belongs at the top of the deck, regardless of what the client asked to see when the report was scoped.
For a law firm account, that means signed matters and qualified consultation calls attributed to organic. For a DSO, new patient bookings by location. For home services, booked estimates and cost per qualified lead by service line. The metrics are vertical-specific, but the discipline is the same: the first artifact the client encounters carries pipeline language, not position language.
This inversion also protects the retention conversation. When the outcomes layer opens the deck, a client scrolling to the ranking table later is scrolling into diagnostic context, not into the scorecard. The account team has already framed the month in terms the client's own leadership uses to evaluate marketing spend, which is where the SEO program is actually judged 7.
Engagement layer: traffic quality, intent signals, and behavior
Beneath outcomes sits the layer that explains them. Sessions by intent cluster, assisted conversions, scroll depth on money pages, form abandonment, returning visitor share, and branded versus non-branded query mix all belong here. This is where the report shows whether the traffic organic delivered was the right traffic, not just more of it.
Practitioner commentary on traditional SEO metrics makes the case for this middle layer explicitly. Rankings and raw traffic counts do not always reflect user intent or content quality, and reports built only on those signals give an incomplete picture of performance 9. An account manager who can point to a 12 percent lift in consultation-page sessions from mid-funnel query clusters is telling a story the outcomes layer needs to be believable.
Google's own guidance reinforces the framing. Its Search documentation directs teams toward helpful content, usability, and meeting user needs rather than chasing individual positions 10. The engagement layer is where that guidance shows up in a report: engagement rate on pillar pages, internal search behavior, conversion path analysis. It is also where the diagnostic layer earns its keep, because a ranking movement without a corresponding engagement shift is often not a movement worth acting on.
Diagnostic layer: rankings, SERP features, and keyword cohorts
Rankings live at the base of the hierarchy, and they earn their place by explaining the two layers above them. This is the section the client asked for. It is also the section that generates the next month's work.
A defensible diagnostic layer does not lead with a flat table of 200 tracked terms. It groups keywords into cohorts tied to business lines, then reports movement at the cohort level:
- commercial-intent terms for the primary service,
- informational terms feeding the middle of the funnel,
- competitor-defense terms, and
- local pack terms where applicable.
Each cohort carries a short narrative about what moved and why, and each cohort ties back to a specific engagement or outcome signal in the layers above.
SERP feature presence belongs in the same layer. Whether the client owns the featured snippet, appears in the People Also Ask block, shows up in the local pack, or is cited inside an AI Overview changes what a position number means. Traditional practitioner templates catalog keyword-specific and overall ranking snapshots as standard formats 1, 2, but the modern diagnostic layer treats each ranked term as a bundle of position, feature presence, and click-through reality rather than a single integer. That is what makes rankings useful as a signal-detection tool rather than a scorecard.
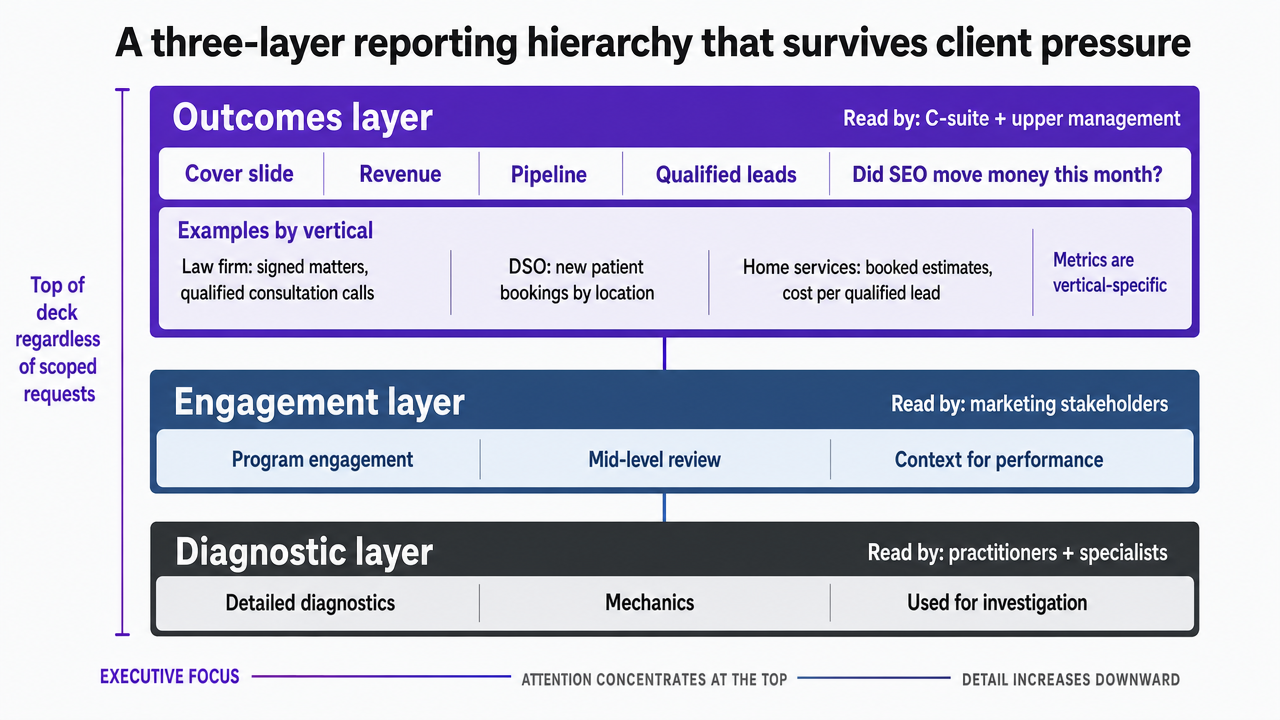 Visualize the three-layer reporting hierarchy (outcomes, engagement, diagnostic) described in the section, showing what belongs at each layer and which stakeholder reads it
Why raw rank stopped functioning as a KPI
Personalization, device variance, and the collapse of a single 'true' position
There is no single position anymore. A term that reads as #3 in the agency's tracker may render as #1 on a logged-in mobile session in the client's home ZIP code, #7 on an incognito desktop query in a neighboring metro, and absent from the first screen entirely when an AI Overview absorbs the query intent. Practitioner analysis of this fragmentation is direct: personalized search, device variation, click-through effects, and diverging tool methodologies have made per-se rankings unreliable as an actual KPI 4.
The nine-reason breakdown of the same problem catalogs the confounders separately: rankings are a snapshot in time, they move with algorithm updates, they distort under penalties and manual actions, and they cannot be evaluated in isolation from the query environment they live in 3. Each failure mode compounds the next. A term tracked at desktop-national-incognito settings is measuring something the client's actual customer never sees.
The operational consequence for an agency reporting stack is not to abandon rank data. It is to stop presenting a single integer as if it described a stable reality. Cohort-level movement, tracked against the same environment settings month over month, is the honest read.
The visibility-to-traffic gap: what a 2024 repository study actually shows
The assumption underneath the traditional ranking report is that higher positions produce more traffic in a roughly linear way. A peer-reviewed 2024 analysis in Scientometrics tested that assumption in a specific setting: open-access scholarly publications in institutional repositories, where the authors define Academic-SEO as optimizing scholarly literature to appear in top SERP positions for relevant terms 6. The finding was that strong search visibility drove comparatively few actual visits from Google Search to those repositories.
The scope matters. This is not a commercial-market study of law firm intake pages or DSO location pages. It is a scholarly-content finding, in a niche where searcher intent and click behavior differ from consumer service verticals. What transfers is the structural point: visibility and traffic are not the same variable, and a report that treats rank movement as a traffic proxy is asserting a relationship the empirical record does not always support 6. Client reports built on that assumption invite awkward quarterly conversations when positions rise and sessions do not.
Proxy metrics that read like measurements but are estimates
Domain authority, keyword difficulty, SEO scores, visibility indexes. These sit next to rank numbers in most agency templates and carry the same visual weight, which is a problem. They are not measurements from Google. They are third-party tool estimates built on incomplete data and proprietary assumptions, and treating them as objective truths misleads clients about what the report is actually saying 5.
The discipline is simple. When a proxy metric appears in a client deliverable, it carries a short note about what tool produced it, what the score is estimating, and how the methodology can shift between vendor updates. Triangulating across multiple sources, rather than anchoring a narrative to one vendor's number, keeps the report defensible when a client's in-house analyst pulls a different figure from a different platform 5.
Validate your ranking insights with live client data
Experience full-scale ranking report automation and publish actual client-facing results during your trial period.
The diagnostic loop: turning ranking movement into an action
A ranking report earns its budget line when a position change produces a specific piece of work. Movement without a follow-on action is trivia. The loop that makes rank data operational has four steps, and each one has to close inside a single reporting cycle for the discipline to hold.
- Step one: a cohort moves. Commercial-intent terms for the primary service drop three positions on average, or a competitor-defense cluster gains ground, or informational terms feeding the funnel middle stall. The trigger is the cohort delta, not any single keyword.
- Step two: the account team writes a hypothesis. The drop correlates with a competitor publishing three new comparison pages. The stall correlates with an AI Overview absorbing the query intent. The gain correlates with an internal linking pass shipped six weeks earlier. Hypotheses are written down and dated, which is what separates diagnosis from post-hoc storytelling.
- Step three: an action ships. Content refresh, technical fix, internal linking change, SERP-feature targeting, or a decision to deprioritize the cohort entirely. Every hypothesis maps to one action or an explicit decision not to act.
- Step four: the outcome metric confirms or contradicts. Sessions from that cohort, assisted conversions, or booked leads by service line, checked against the engagement and outcomes layers above. If rank moved and no engagement signal followed, the report says so plainly, consistent with guidance that rankings alone give an incomplete picture of performance 9.
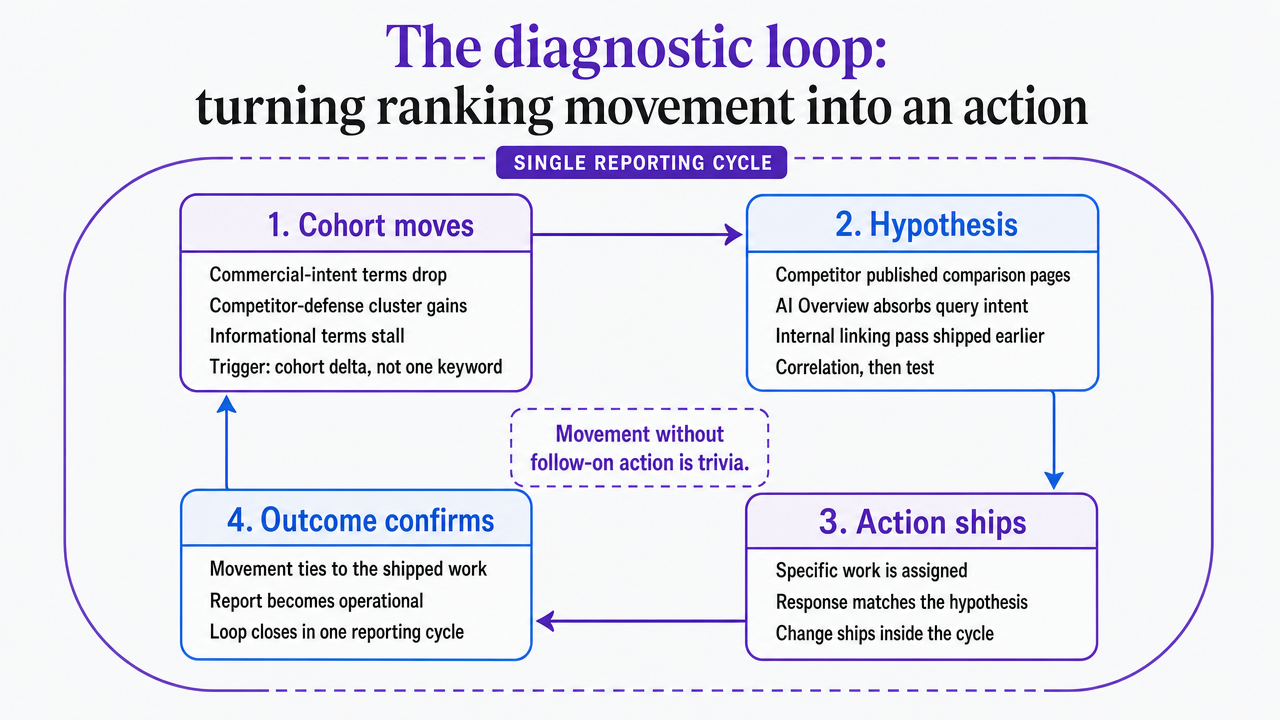 Visualize the four-step diagnostic loop (cohort moves, hypothesis, action ships, outcome confirms) as a closed cycle that fits within a single reporting cycle
Segmenting the deliverable by stakeholder tier
The marketing manager view: keyword cohorts and content next steps
The marketing manager who owns the SEO relationship day-to-day is reading the deck for one reason: what ships next. Their reporting view leads with keyword cohort movement tied to specific content actions. Commercial-intent terms for the primary service line, informational cohorts feeding the funnel middle, competitor-defense clusters, and local-pack terms each get a movement number and a named next action.
This is the audience for the diagnostic layer at full resolution. Cohort deltas, SERP feature changes, and hypothesis notes from the prior cycle all belong in front of this reader, because they are the person who has to sell the internal linking pass or the pillar-page refresh to their own team. Traditional keyword-specific report formats still serve here 1, but framed as inputs to a content roadmap rather than a scorecard. The takeaway artifact this tier needs is a dated action list, not a chart of positions.
The VP view: share of voice, category coverage, and pipeline attribution
One tier up, the marketing VP is reading for category position and program ROI. Individual keyword movement is noise at this altitude. Share of voice across the priority category, coverage gaps against named competitors, assisted conversion contribution from organic, and pipeline attribution by service line are the metrics that carry the meeting.
Stakeholder research on progressive reporting is explicit that senior marketing leaders line up to share of voice and revenue rather than positional detail 7. The VP view compresses the diagnostic layer into a category-level read: which service lines are gaining ground, which are losing it, and what the program is spending analyst hours on this quarter. Client-report guidance that anchors deliverables in visibility, traffic, and conversions maps directly to this tier 2. The artifact this reader needs is a one-page category scorecard with a short narrative on where budget is producing pipeline and where it is not.
The C-suite view: market penetration and revenue contribution
At the executive tier, the ranking report effectively disappears. C-suite conversations line up to market penetration, share of voice, and revenue, and progressive reporting guidance is direct that this audience should not be walked through the mechanics of SEO execution 7. The deliverable at the QBR or board update is a three- to five-line read on what organic contributed to pipeline, how the category position moved, and what the next quarter's investment is targeting.
Cohort tables, SERP feature breakdowns, and tool-estimate scores do not belong in this view. They live in the appendix if they appear at all. The account team's job at this tier is to translate the diagnostic and engagement layers into a business narrative the CFO would recognize, consistent with the user-first, outcomes-first framing that Google's own guidance points teams toward 10. The artifact is a revenue-contribution statement with a category-position footnote, not a report.
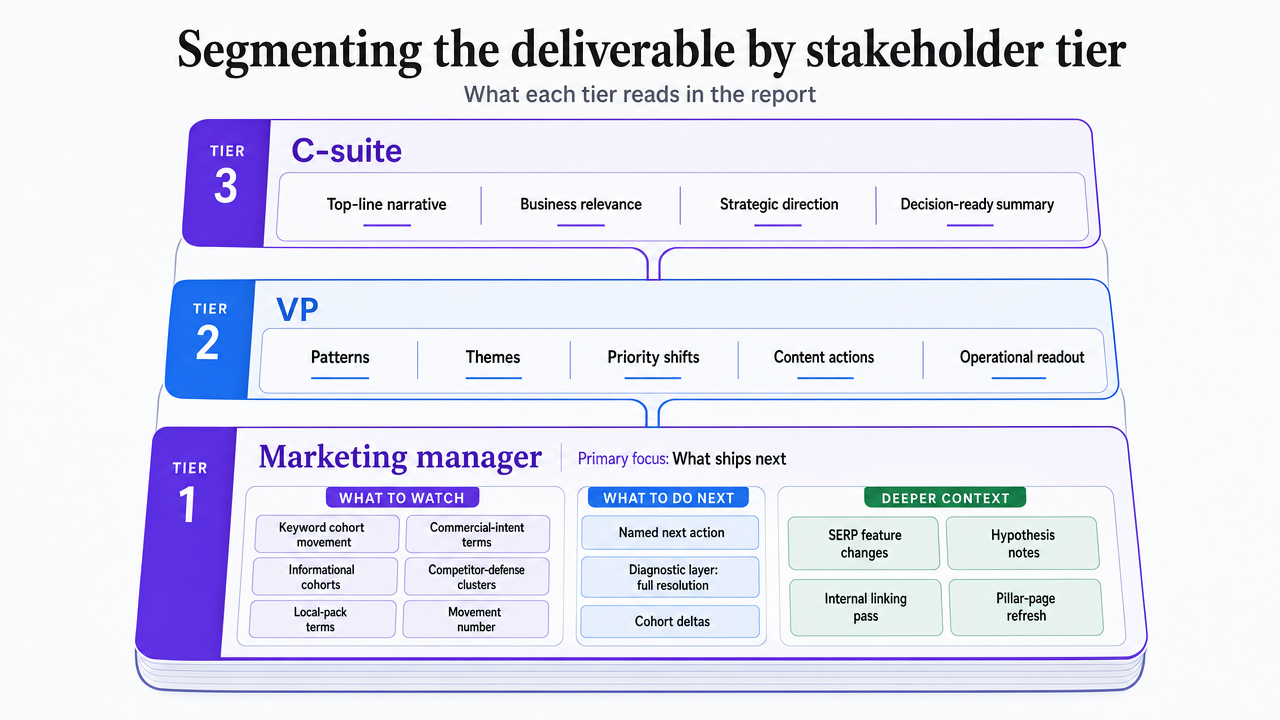 Comparison infographic showing the three stakeholder tiers (marketing manager, VP, C-suite) and what each tier reads in the report, aligning with the section's operating framework
If the head of SEO manages a client portfolio: reporting labor as margin math
Audience shift: this section is written for the head of SEO running the P&L on a client book, not for the analyst producing a single deck. The question stops being what belongs in the report and starts being what the report costs to produce across 10, 25, 50, or 100 accounts.
Traditional ranking-report formats — overall snapshots, keyword-specific tables, cohort narratives — remain standard artifacts in the client relationship 1, 2. Each one carries an analyst-hours line item. When that line item is manual across a growing book, the reporting stack becomes the largest hidden cost inside a retainer.
The worksheet below is deliberately variable-only. Agency leads populate their own analyst-hours range, their own blended rate, and their own retainer band. The output is reporting labor as a percent of retainer, which is the number that actually decides whether the current process scales.
| Client count | Analyst hrs / client / mo (rank narrative) | Monthly reporting labor | Labor as % of $2,500 retainer | Labor as % of $5,000 retainer |
|---|---|---|---|---|
| 10 | H hrs | 10 × H × R | (10 × H × R) / $25,000 | (10 × H × R) / $50,000 |
| 25 | H hrs | 25 × H × R | (25 × H × R) / $62,500 | (25 × H × R) / $125,000 |
| 50 | H hrs | 50 × H × R | (50 × H × R) / $125,000 | (50 × H × R) / $250,000 |
| 100 | H hrs | 100 × H × R | (100 × H × R) / $250,000 | (100 × H × R) / $500,000 |
H : the analyst hours per client per month spent on rank narrative alone: pulling positions, writing cohort commentary, reconciling tool discrepancies, and formatting the diagnostic layer.
R : the blended internal rate.
The head of SEO who has never measured H directly usually finds it larger than expected, because the hours hide inside general reporting time rather than a named line item.
Two operational reads follow from the worksheet. First, at 50 or 100 accounts, even modest H values push reporting labor into a percentage of retainer that competes directly with content and technical execution budget. Second, the marginal cost of adding a client rises non-linearly when the diagnostic layer is produced by hand, because tool reconciliation and cohort narrative do not compress with scale the way templated outcome dashboards do. Consolidating the reporting stack — moving from manual rank narratives to a system that produces the diagnostic layer against standardized cohorts — is where the margin math shifts.
See How Unified Ranking Reports Drive Scalable SEO Results for Agency Portfolios
Request a walkthrough of integrated, client-ready ranking reports that surface actionable insights, automate tracking, and support agency-wide SEO oversight—purpose-built for high-volume, multi-client environments.
Holding the line when a client says 'just show me where we rank'
The request itself is not the problem. The problem is what the account manager does in the next thirty seconds. Agreeing to reorder the deck around a position table concedes the framing that rank equals performance, which is the concession that makes the retention conversation harder every quarter that follows.
The line that holds is short. Rank is in the deck, and it lives in the diagnostic section because that is where it explains what moved. Positions get pulled forward when the client walks the deck, not when the deck is built. The account team then walks the ranking table with the same discipline it applied to the outcomes layer: cohort deltas rather than individual terms, SERP feature context rather than raw integers, and a hypothesis for every material movement, consistent with practitioner analysis that rank as a standalone KPI does not survive personalization and tool methodology drift 4.
When the client presses harder, the counter is empirical, not defensive. Higher visibility does not automatically produce traffic — a peer-reviewed 2024 analysis of institutional repositories showed strong SERP visibility driving comparatively few actual visits, and while the scope is scholarly content rather than commercial service verticals, the structural point transfers 6. That is the sentence that reframes the meeting.
What a defensible ranking report looks like next quarter
The redesign is not a template swap. It is a decision about what the deck is for. A defensible ranking report next quarter opens with pipeline contribution and category position, walks the client through engagement signals that explain the outcomes, and reaches the diagnostic layer as the section that generates the next month's work rather than the section that grades the last one.
Three commitments make that structure hold:
- Rank data appears in cohorts tied to business lines, not as a flat table of tracked terms.
- Every proxy metric that appears in the deck carries a one-line note about what tool produced it and what the score is estimating 5.
- Every material cohort movement carries a dated hypothesis and a named action, so the report reads as a working document rather than a monthly performance review.
The head of SEO who runs that redesign across a client book gets two things back. Analyst hours compress because cohort narratives standardize where individual keyword commentary does not. And the retention conversation shifts, because the deck the client is scrolling now speaks the language their own leadership uses to decide what marketing spend is worth 7. Platforms like Vectoron exist to consolidate that reporting stack under an approval-first workflow, but the discipline is the deliverable, not the tooling.
Frequently Asked Questions
References
- 1.5 easy reports to help you understand your ranking.
- 2.SEO Report Templates - 6 Best Examples to Copy Right Now.
- 3.9 Reasons Not To Use Rankings As Your Google SEO KPI.
- 4.The Case Against Keyword Rankings.
- 5.Metrics That Lie.
- 6.Open access publications drive few visits from Google Search results to institutional repositories - Scientometrics.
- 7.SEO Stakeholder Management.
- 8.Is Relevance Relevant? User Relevance Ratings May Not Predict ....
- 9.The Limitations of Traditional SEO Metrics.
- 10.Search Engine Optimization (SEO) Starter Guide.