
Key Takeaways
- SERP volatility is structural, driven by frequent core updates and query-, location-, and device-specific ranking systems, so tool selection should prioritize filtering noise over index size.
- Separate directional tracking for weekly editorial work from decision-grade tracking reserved for revenue-tied clusters where budget defense requires daily samples and variance bands 11.
- Aggregate positions mislead because geography drives inconsistent results in 97.76% of queries 9, personalization reshapes roughly 40% of first pages 8, and Search Console reports impression-weighted averages no single searcher actually sees.
- Distinguish algorithmic events from drift by overlaying Search Status Dashboard rollout windows on rank timelines, and flag manual actions separately since spam enforcement demands a policy fix rather than a content review 3, 4.
- Require geo-grid density matched to service radius, distinct device segmentation, AI Overview and pack presence as separate fields, 24 months of raw daily samples, and API exports that join rank data to pipeline in a warehouse 5.
- Portfolio operators managing multiple locations should consolidate on a unified tracking model with standardized grids and surface fields, since fragmented per-location stacks force manual reconciliation across incompatible SERP baselines 9.
- Run selection internally as a weighted scoring exercise, validated by pulling a raw export across a confirmed core update window and comparing two candidate tools on the same query set for thirty days 1.
Volatility Is the Baseline, Not the Exception
Google confirms it runs "significant, broad changes to our search algorithms and systems" several times a year through core updates, with rollouts often stretching across days or weeks on the official Search Status Dashboard 1, 3. Ranking is not a single score but the output of multiple automated systems evaluating hundreds of billions of pages, returning results in a fraction of a second, and tuned differently by query, location, device, and user context 2. This inherent structure guarantees movement. A demand generation leader who treats a weekly rank report as a stable measurement is misinterpreting a moving average of a constantly evolving system.
The volatility problem has expanded beyond traditional organic listings. Google's guidance states that AI Overviews and AI Mode draw from the same Search index and ranking systems, utilizing a query fan-out technique that can surface "a wider and more diverse set of helpful links" than a classic results page 5. This documentation has been updated to clarify that AI Overviews are included in Search Console performance reporting 6. Ranking now encompasses organic listings, local packs, image results, video carousels, and AI-generated answers, each drawing on overlapping but distinct signals.
Tool selection must acknowledge this reality. The primary question is not which platform boasts the largest keyword index, but rather which platform can filter noise from a system designed for constant change. The goal is to provide a demand generation team with a signal reliable enough to justify budget allocations. This article approaches rank tracking as a measurement design challenge within known volatility, rather than a simple software procurement.
Directional Tracking vs. Decision-Grade Tracking
The Two Tiers of Rank Measurement
Not every ranking report requires the scrutiny of a CFO. Some reports aim to determine if a content investment is moving in the right direction, while others are designed to justify budget lines. The IAB's 2026 visibility framework for AI-era measurement distinguishes between directional and decision-grade signals, emphasizing that decision-grade work demands higher rigor and reproducibility 11. This distinction applies directly to classic rank tracking in volatile SERPs.
Directional tracking is the default output of most dashboards, typically showing a single tracked location, a weekly average position, and a trend arrow. It answers whether a program is progressing. This level of data is sufficient for weekly stand-ups or content team reviews and is cost-effective for tracking thousands of keywords.
Decision-grade tracking, however, involves a different design. Inputs expand from a single location to a geo-grid covering the actual service footprint. The cadence tightens from a weekly average to daily samples, incorporating variance bands wide enough to account for personalization and rollout noise. Outputs shift from a dashboard tile to a defensible record, indicating when a movement began, its consistency across locations and devices, and its alignment with known update windows on the Search Status Dashboard 3. A demand generation leader defending a budget to a CMO requires this second tier, whereas a content editor prioritizing briefs can rely on the first.
When a Demand Gen Team Actually Needs Decision-Grade Signal
Most weekly rank reviews do not necessitate decision-grade rigor. Editorial calendars, internal link audits, and topic-cluster planning function effectively with directional data. The need for decision-grade tracking arises when a ranking movement is poised to impact financial expenditure.
Four scenarios typically require decision-grade data for a demand generation team:
- When a proposed reduction in organic investment is based on a perceived decline.
- When a proposed increase in spend on a specific cluster is due to apparent ranking improvements.
- During attribution discussions with finance where organic performance is credited or blamed for pipeline fluctuations.
- In a post-mortem analysis of a confirmed core or spam update, where the team must differentiate algorithmic impact from concurrent site changes 1.
Each of these conversations hinges on the robustness of the underlying rank data. A single-location weekly average is insufficient. Personalization, geographic variance, and query fan-out across AI surfaces all introduce noise that a lightly sampled dataset can misinterpret as significant movement 5. The practical rule for demand generation leaders is to broadly employ directional tracking and reserve decision-grade tracking for specific query sets directly linked to pipeline, revenue, and budget defense.
Why Aggregate Rankings Mislead
Geography, Personalization, and Surface Variance
A single average position obscures the fact that the same query yields different results for different users. The Bobble study, a peer-reviewed experiment replaying a large set of real queries from geographically distributed vantage points, reported that 97.76% of queries produced at least one inconsistent set of organic results due to geographic location 9. Geography was a dominant factor, not a minor one. For a demand generation team tracking rank from a single default location, this implies the reported position may not reflect what a prospect just fifteen miles away actually sees.
Personalization further complicates this. An academic study exploring how cookies, search history, and browsing history influence Google results found that Google adapts approximately 40% of its first results page on average based on user profile signals 8. While this study is exploratory, the consistent direction indicates that a logged-in user with query history experiences a different first page than a clean-session crawler. Rank trackers that emulate anonymous browsers present a version of a SERP that few actual searchers encounter.
Variance also extends across different search surfaces. Peer-reviewed research on Google image results for COVID-19 imagery revealed that only 46% of images matched on average when the same query was run from different locations 10. Image, video, and local surfaces can diverge independently from traditional blue links. A tool that only reports organic position for a query triggering an image pack or a local module is measuring only a fraction of the visible ranking landscape.
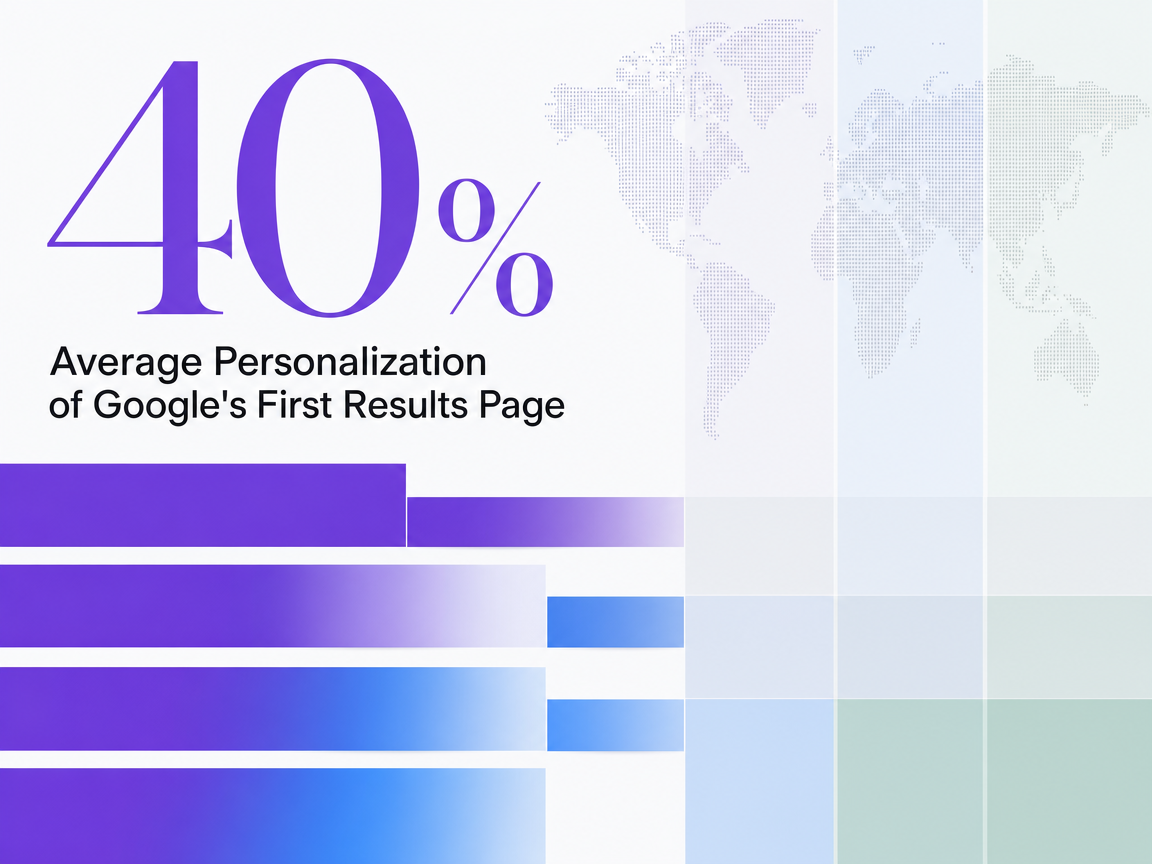 Average Personalization of Google's First Results Page
Average Personalization of Google's First Results Page
What Search Console Actually Reports
Search Console is a foundational tool for many demand generation teams, yet its data is frequently misinterpreted. The average position figure is an impression-weighted average across every query, device, country, and search feature where a URL appeared. It does not represent the position a specific user saw at a specific moment. For instance, a URL ranking first in one metro and eighth across ten others might show an average position around six, a number that doesn't accurately describe any actual searcher's experience.
Google's documentation also clarified that AI Overviews are now included in Search Console performance reporting 6. This integrates a new surface into existing impression and click totals, potentially shifting baselines without any changes to the site itself. Interpreting a Search Console trend line as a stable measurement across this boundary can lead to misidentifying false movement.
While essential for query discovery and click data, Search Console is not the ideal instrument for defending a budget decision on a specific cluster in a specific market. That task requires a rank tracker that samples the actual SERP at defined locations and devices, on a defined cadence, with surface types recorded alongside the position.
Test SERP ranking accuracy risk-free this week
Monitor real keyword movements and validate volatility insights on your live content with zero commitment.
Distinguishing Algorithmic Events from Ordinary Drift
Reading Core Update Windows
Most ranking movement is not an algorithmic event. Shifts can occur due to changes in query mix, competitor publishing, reassignment of a featured snippet, or expansion of an image pack. Attributing every drop to a core update can lead to overcorrection, while misinterpreting a genuine algorithmic quality shift as ordinary drift can result in an inadequate response. A rank tracker's role during an update window is to help differentiate these scenarios.
Google's guidance explicitly advises site owners to wait until a rollout completes and compare the correct date ranges before analyzing a drop 1. The Search Status Dashboard lists rollout start and end dates for each ranking event, which should be overlaid directly onto the rank tracker's timeline 3. Movement that begins before a confirmed rollout and persists after its conclusion is likely ordinary drift. Conversely, movement that starts within the update window, spans multiple locations and devices in the same direction, and continues after the dashboard marks the event complete is a strong candidate for an algorithmic shift.
The March 2024 core update exemplifies the importance of confirmed event scale. Google projected this update would reduce low-quality, unoriginal content by roughly 40%, later reporting an actual reduction of 45% 7. A rank tracker that cannot link a site's decline to a rollout of this magnitude leaves a demand generation leader uncertain whether the loss is due to content quality, technical regression, or normal competitive turnover. The tool should clearly display the update boundary, pre- and post-rollout baselines, and cluster-level patterns in a single view.
Separating Enforcement Signal from Ranking Drift
Not every ranking loss is algorithmic. Google's spam policies state that violating sites "may rank lower in results or not appear in results at all," with enforcement occurring as an algorithmic spam action or a manual action delivered via Search Console 4. These events present differently in data than a core update. A manual action typically affects specific URLs or directories rather than the entire domain and appears in the Search Console manual actions report on a defined date, not spread across a multi-week rollout window.
A rank tracker should flag these signals distinctly. A sudden, cluster-specific disappearance from results, coinciding with a Search Console notification and unrelated to any active rollout on the Search Status Dashboard, indicates enforcement rather than drift 3. Misinterpreting this pattern as a core-update loss would lead the team into a content-quality review when the actual solution is a policy fix and a reconsideration request. The operational takeaway for demand generation leaders is to require a tool that records manual-action dates and dashboard-confirmed rollout windows on the same timeline as tracked positions, ensuring response paths are chosen based on evidence, not assumption.
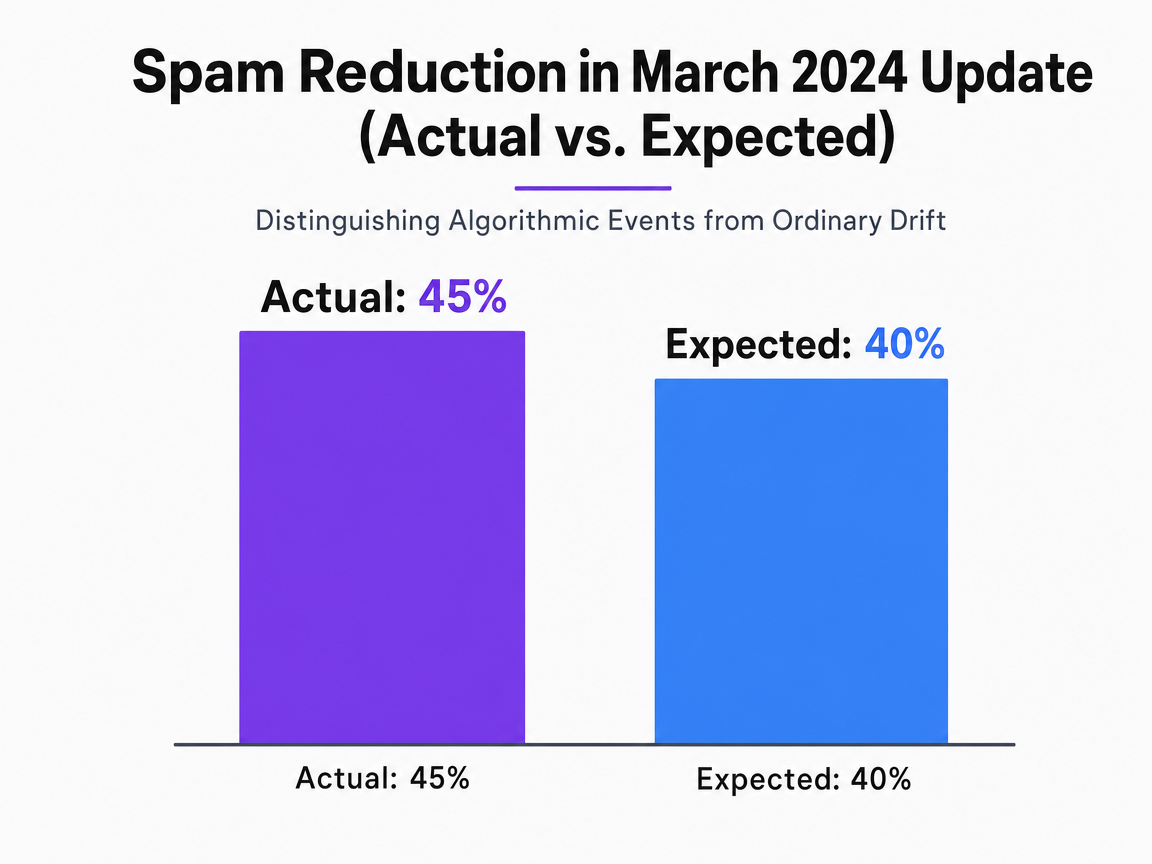 Spam Reduction in March 2024 Update (Actual vs. Expected)
Compares the actual spam reduction percentage achieved by Google's March 2024 update against the initially projected percentage.
Selection Criteria for a Ranking SEO Tool Under Volatility
Geo-Grid Coverage and Device Segmentation
A tool that samples only one location per market provides an incomplete picture. The Bobble study's finding that geography causes inconsistent organic results in the vast majority of tested queries establishes a baseline: single-point tracking cannot accurately represent a multi-zip service footprint 9. For a demand generation leader managing a metro campaign, the tool needs a geo-grid dense enough to capture intra-metro variance, not just a city centroid.
Practical density depends on the service radius. A dental group serving a ten-mile catchment can typically resolve movement with a grid spaced every two to three miles around each location. A home-services brand covering an entire metro requires wider coverage but at zip-code-level granularity, as queries with local intent can shift results block by block. The tool should allow the team to define grid points by coordinates or zip codes and maintain these points consistently across reporting periods for accurate week-over-week comparisons.
Device segmentation is equally crucial. Mobile and desktop SERPs display different features, pack compositions, and AI-triggered elements. A rank tracker that averages these two segments overlooks the primary segment for most local queries.
AI Surface Tracking as Part of the Ranking Surface
AI Overviews are not a separate channel. Google's guidance indicates that AI Overviews and AI Mode utilize the same Search index and ranking systems, potentially employing a query fan-out technique to surface a broader and more diverse set of helpful links than a classic results page 5. A rank tracker reporting a position of ten while the query triggers an AI Overview citing a competitor at the top of the visible surface is providing an inaccurate depiction of the user's experience.
The measurement challenge also extends to Search Console. Google's documentation confirms that AI Overviews are now included in Search Console performance reporting, meaning impression and click baselines now incorporate a surface that previously did not exist 6. A chosen tool should record AI Overview presence, whether the tracked domain appears as a supporting link, and the position of the classic organic result underneath, as three distinct fields for the same query.
Image and video packs warrant similar treatment. The COVID-19 imagery study found only a 46% average overlap of Google image results across locations, indicating that image-pack presence and composition vary by market in ways a blue-link-only tracker cannot detect 10. Multi-surface tracking is now a fundamental requirement, not a premium feature.
Historical Baselines Anchored to Known Volatility Windows
A rank tracker lacking a robust historical archive cannot answer a CMO's critical question: what did the site rank for this cluster the week before the last core update began? The Search Status Dashboard provides start and end dates for every ranking event, and these boundaries must be visible on the same timeline as tracked positions 3. Without this, the team risks comparing current rank to a smoothed average that already incorporates the very event they are trying to isolate.
Two archive requirements are crucial for decision-grade work:
- Raw daily samples retained for at least twenty-four months, enabling the reconstruction of pre- and post-rollout baselines for any confirmed event.
- Annotated event overlays for core updates, spam updates, and product launches, linked to the dashboard record rather than a vendor's interpretation 1.
A tool that only stores rolling weekly averages compresses the precise evidence a demand generation leader needs during a post-mortem.
Export Depth, API Cadence, and Revenue Alignment
Ranking data confined to a dashboard cannot be linked to pipeline. A demand generation leader measured on closed revenue needs raw position data integrated with lead events, opportunity stages, and revenue outcomes within the same data warehouse used by the rest of the go-to-market team. This necessitates an API with per-keyword, per-location, per-device granularity at a daily cadence, not merely a weekly CSV export limited to top-line summaries.
Three export capabilities distinguish tools built for reporting from those designed for attribution:
- Per-sample records including date, location coordinates, device, SERP surface, and position, allowing warehouse queries to filter to the exact segment tied to a campaign.
- Event-level fields for AI Overview presence, local pack presence, and featured snippet ownership, making surface changes queryable alongside position changes 5.
- Historical backfill through the API, not just forward-looking data from the connection date, ensuring baselines around prior update windows remain accessible 3.
The IAB's distinction between directional and decision-grade applies directly here. A tool that generates trend charts within its own UI supports directional review. A tool that exports reproducible, per-sample records into a warehouse supports decision-grade defense of a budget line 11.
Evaluate SERP Volatility With Precision—See Real Ranking Shifts in Your Market
Connect with our team to access a comparative walkthrough of leading ranking SEO tools, including live data on keyword fluctuations and actionable reporting workflows designed for complex, multi-location campaigns.
If You Manage Multiple Locations: Consolidating Rank Tracking Across a Portfolio
This section addresses portfolio operators managing dental DSOs, multi-branch home services, senior living groups, and multi-market legal practices. Their rank-tracking challenge differs from that of a single-brand demand generation team. The unit of measurement is not one site across one metro, but dozens of locations, each with its own geo-grid, device split, and local-pack composition, all contributing to a single revenue report.
The operational question centers on where tracking efforts are concentrated. Three consolidation models yield distinct overhead profiles, with key variables being keywords tracked per location, geo-grid points per location, weekly review hours, and monthly reporting consolidation hours.
| Consolidation Model | Keywords / Location | Geo-Grid Points / Location | Weekly Review Hours | Monthly Reporting Consolidation |
|---|---|---|---|---|
| Enterprise rank tracker, per-keyword or per-location tiers | Capped by tier | Fixed by plan | Centralized, moderate | Single export, low |
| Fragmented per-location tool stacks | Varies by site | Varies by vendor | Distributed, high | Manual reconciliation, high |
| Unified AI-coordinated tracking with centralized approval | Standardized | Standardized grid | Centralized, low | Warehouse join, low |
Fragmented stacks primarily fail in reporting consolidation. Each location reports rank using a different schema, cadence, and geo-baseline, leading the portfolio marketing lead to spend significant time reconciling formats instead of interpreting movement. The Bobble study's finding that geography drives inconsistent results in nearly every tested query means these reconciled rows are also measuring different SERPs, not the same SERP across different sites 9. A unified model standardizes the grid and surface fields before data reaches the warehouse, where lead and revenue joins occur.
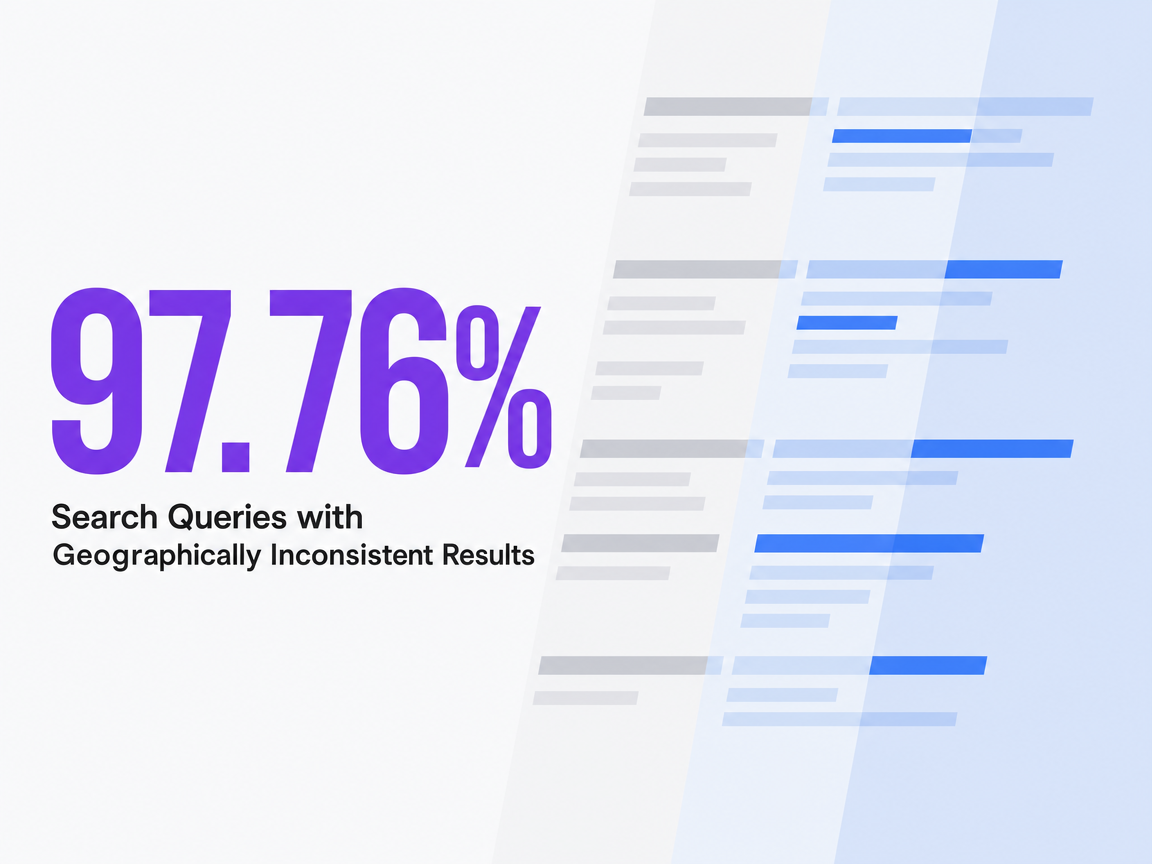 Search Queries with Geographically Inconsistent Results
Search Queries with Geographically Inconsistent Results
Running the Selection Framework Internally
A demand generation team can execute this selection process within a two-week timeframe without external consultation. The task is a scoring exercise, not a vendor bake-off. Each candidate tool is evaluated against the criteria outlined in this article:
- Geo-grid density matched to the service footprint
- Distinct device segmentation
- Recording of AI Overview presence as a separate field
- A historical archive of daily raw samples with event overlays linked to the Search Status Dashboard
- An API that exports per-sample records into the data warehouse where lead and pipeline data reside 3, 5
The scoring process should incorporate weights reflecting the tool's actual usage. Teams defending budgets to finance will prioritize export depth and historical baseline retention over interface aesthetics. Teams conducting weekly editorial reviews will value coverage breadth and cadence more than warehouse joins. Each criterion receives a score, weighted appropriately, resulting in a defensible total rather than a mere feature checklist.
Two validation steps distinguish a genuine selection from a demo-driven one:
- Request a raw export of a live account covering a confirmed core update window to verify the presence of daily samples, surface fields, and event boundaries 1.
- Run the same tracked query set through two candidate tools for thirty days and compare the variance in reported position at the same location and device.
A tool designed for volatile SERPs will show closer agreement with a manual SERP check than one built for aggregate dashboards. This comparison is where a platform like Vectoron, engineered to coordinate ranking signal with the broader marketing execution stack, demonstrates its value against traditional agency-plus-point-tools models.
Frequently Asked Questions
References
- 1.Google Search's Core Updates.
- 2.A Guide to Google Search Ranking Systems.
- 3.History for Ranking | Google Search Status Dashboard.
- 4.Spam Policies for Google Web Search.
- 5.AI Features and Your Website | Google Search Central.
- 6.Latest Google Search Documentation Updates | Google Search Central | What's new | Google for Developers.
- 7.New ways we’re tackling spammy, low-quality content on Search.
- 8.Personalised Filter Bias with Google and DuckDuckGo: An Exploratory Study.
- 9.Exposing Inconsistent Web Search Results with Bobble.
- 10.Do you see what I see? Images of the COVID-19 pandemic through the lens of Google.
- 11.IAB | “Measuring Visibility in the AI Era” Helps Navigate AI- ....