Key Takeaways
- A seven-stage lifecycle funnel covering awareness through advocacy fits SaaS economics because retention and expansion, not contract signature, determine whether acquisition cost is ever recovered 12.
- Activation rate, product-qualified leads, and net revenue retention have replaced MQL volume as the metrics that actually predict billed revenue and should govern pipeline reviews 12.
- Healthy unit economics sit at a 3:1 LTV:CAC floor with 5:1 signaling efficiency, against median CAC of $702 and payback under 12 months SMB, 18 months mid-market 15, 5, 11.
- Focus next on consolidating SEO, paid, and link programs around shared keyword maps, a unified asset library, and three to five revenue events resolved through multi-touch attribution 7.
The funnel is now a revenue operating system, not a diagram
The most useful question a SaaS marketing leader can ask in 2026 is not "what are the stages of our funnel," but "which revenue events does our funnel actually move, and at what cost." The diagram on the strategy deck has stopped describing how the business runs. The funnel that matters is the one wired into recurring revenue, expansion, and retention — the cyclical lifecycle that begins again every time a customer renews, upgrades, or refers another buyer 1.
That shift has consequences. A SaaS funnel that ends at conversion misprices the work. It treats a signed contract as the finish line when the contract is closer to a starting position, because retention and expansion drive the majority of long-term revenue in a subscription business 12. Net revenue retention, activation rate, and product-qualified leads now sit alongside CAC and conversion rate as first-class metrics, not back-office reporting.
The teams compounding fastest treat the funnel as an operating system: one plan covering SEO, paid, and link acquisition, one shared definition of revenue events, and one attribution model that connects channel spend to recurring revenue rather than to MQLs 7. The rest of this analysis works through that operating system stage by stage — what each stage measures, what benchmark separates a working funnel from a leaking one, and where the coordination cost between channels quietly erodes payback.
Three stages, six stages, or seven: picking the model that matches SaaS economics
The research disagrees on how many stages a SaaS funnel should have, and that disagreement is not academic.
- A three-stage model collapses awareness, consideration, and conversion into a clean pipeline view 13.
- A five-stage model extends to loyalty and advocacy, recognizing that buyers keep consuming vendor content after the contract is signed 14.
- A seven-stage model breaks out onboarding, adoption, and retention as discrete phases with their own metrics and campaigns 17.
For SaaS at scale, the seven-stage lifecycle is the correct model. The three-stage frame describes a transactional sale. SaaS is not a transactional sale. The contract initiates a relationship in which onboarding determines activation, adoption determines retention, and retention determines whether the original CAC was ever recovered. Each of those phases has its own drop-off curve and its own owner inside the company. Collapsing them into "conversion" hides the failures that actually destroy unit economics.
The six-phase variant — Awareness, Consideration, Adoption, Expansion, Renewal, and Advocacy — captures most of the same logic by treating renewal as a distinct event rather than a passive outcome 4. Either model works. The three-stage model does not, because it produces a marketing organization that stops measuring itself at the moment the customer becomes expensive to lose.
There is a practical consequence to picking the longer model: it forces marketing to share metrics with customer success and product. Activation rate, feature adoption, and net revenue retention become marketing-adjacent KPIs rather than someone else's reporting 12. That is the operating shift the rest of this analysis assumes — a funnel that reports on revenue events the company actually bills against, not on lead volume the sales team will discount by Friday.
 B2B Buyers Viewing at Least 5 Pieces of Vendor Content
B2B Buyers Viewing at Least 5 Pieces of Vendor Content
Stage-by-stage: the lifecycle funnel and the metric that governs each stage
Awareness: branded search lift and the TOFU content the team should not be writing
Awareness is the stage most often confused with reach. Reach is cheap. Awareness that compounds is the share of in-market buyers who recognize a category name and a brand name at the same time — measurable through branded search volume, direct traffic to category pages, and assisted conversions from non-branded keywords months later. Top-of-funnel content should educate against a specific problem, not promote a product 16.
The TOFU content the team should not be writing is the listicle that has no original benchmark, no proprietary data, and no point of view on the category. It ranks for a quarter, then erodes. Benchmark reports, original analysis of customer data, and category-defining frameworks are the formats that earn link equity and create the branded search lift that shows up in pipeline two or three quarters later 3.
Channel mix at this stage runs on long-tail SEO, paid social against tightly defined ICP audiences, partnerships, and PR — all measured against the same downstream events, not against impressions. The TOFU question worth answering each quarter is which awareness assets correlate with a measurable lift in branded search and direct demo requests. Everything else is reporting noise. Awareness is the only stage where the right metric is partially a lagging indicator, which is why it gets defunded first under quarterly pressure and rebuilt last.
Consideration: where buyer content depth becomes a structural constraint
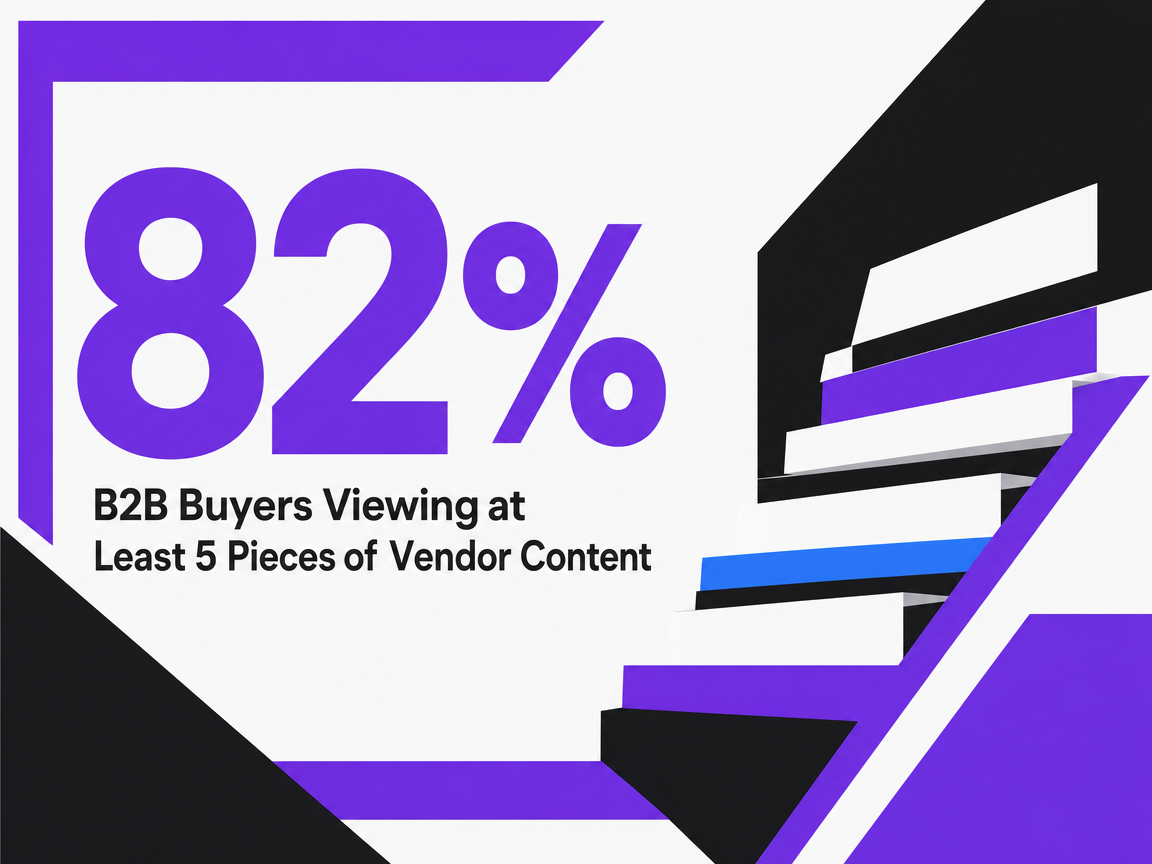
Consideration is the stage where most SaaS funnels quietly fail. The buyer has named the problem, started shortlisting categories, and begun consuming vendor material in volume. In one study of B2B buyer content consumption, 82% of buyers viewed at least five pieces of content from a specific vendor before purchase 14. That figure describes vendor-specific content depth in a defined buying cycle — not total content consumed across the market — but the implication holds: a shortlisted vendor who cannot supply five distinct, high-quality consideration assets is materially under-equipped for the deal.
Five pieces of content per vendor is a structural constraint, not a creative goal. It means the consideration library has to include:
- comparison guides
- solution-by-use-case pages
- technical deep-dives
- customer evidence
- an ROI tool that produces a defensible number 3
Each asset addresses a different stakeholder — economic buyer, technical evaluator, end user, procurement — and each has to be findable through organic search, paid retargeting, and sales-led outreach without contradicting the others.
The MOFU metric that governs this stage is the MQL-to-SQL conversion rate, but the more useful operating metric is the average number of vendor-supplied assets a closed-won opportunity consumed before the demo. Most SaaS teams cannot answer that question because their analytics stack treats content engagement and CRM stage progression as separate datasets 6. Closing that gap is the highest-leverage analytics investment available to a mid-funnel team. Without it, consideration content gets produced by volume, not by deal-stage need, and the library accumulates orphan assets that never get cited in a sales conversation.
Decision: a 2–3% website conversion ceiling and what actually moves it
The average B2B website converts at 2–3% in 2026 15. That number is the ceiling, not the floor, for most SaaS decision-stage optimization work. A site already converting at 2.5% will not double through copy testing. It moves through structural changes: transparent pricing, a self-serve trial path, calculators that produce a defensible ROI number, and removing the form fields that exist only because a sales operations process needs them 10.
Pricing transparency is the single largest decision-stage lever and the one most SaaS teams resist longest. Buyers who cannot see a price assume the price is high and the sales process is long, and they self-select out before a demo is ever scheduled. Published pricing tiers — or at minimum, published starting points and ROI calculators that map company size to expected investment — cut decision-stage drop-off in a way no headline test will 10.
The metric that governs this stage is demo-to-opportunity conversion rate, layered with win rate. Win rate is where the consideration library shows up: deals that consumed strong technical and customer-evidence content close at materially higher rates than deals that arrived through a form fill alone 3. The decision stage is also where paid spend has the shortest feedback loop and the highest political pressure to over-allocate. The discipline is to fund the stage in proportion to its conversion ceiling, not to its visibility on the weekly pipeline call.
Onboarding and adoption: activation rate and PQLs replace MQL-era reporting
Onboarding starts the moment a contract is signed or a trial begins, and the metric that governs it is activation rate — the percentage of new accounts that reach a defined value milestone within a defined window. The definition is product-specific and non-negotiable: it has to describe the behavior that statistically predicts retention, not the behavior that is easy to instrument. A team that cannot name its activation event in one sentence does not yet have one 12.
Adoption follows activation and is measured through feature adoption breadth, weekly active accounts as a share of paid accounts, and the conversion of free or trial users into paying ones. This is where product-qualified leads enter the metric stack. A PQL is a user whose in-product behavior signals readiness to expand or convert — a usage threshold crossed, a power feature engaged, a second seat invited. PQLs are the post-MQL metric SaaS marketing organizations should be running pipeline reviews against, because they correlate directly with revenue events rather than with form completions 12.
The operating shift at this stage is organizational. Onboarding and adoption sit at the seam between marketing, customer success, and product, and the metric ownership has to be explicit. Marketing teams that publish activation rate and PQL volume on the same dashboard as MQL volume have started the work. Teams still reporting MQL-to-SQL ratios without an activation column are reporting on a funnel that ended two stages ago 8.
Expansion and advocacy: why NRR rewrites the CAC math
Net revenue retention is the metric that turns acquisition spend into a defensible investment. A SaaS business with 120% NRR recovers its CAC and then some without acquiring a single new logo; a business with 90% NRR has to acquire net-new revenue every quarter just to stand still. Expansion is the stage that produces that delta, and it runs on the same instrumentation marketing already owns: in-product messaging, lifecycle email, usage-triggered campaigns, and account-based work targeted at existing customers 12.
The CAC math changes once expansion revenue is included in the denominator. Blended CAC ratios — calculated against new plus expansion revenue rather than new logos alone — improve materially over acquisition-only views, which is why investor benchmarks have moved toward blended definitions 19. A marketing organization that reports only on new-logo CAC is presenting its work as less efficient than it actually is, and is under-funding the campaigns that generate the most profitable revenue in the business.
Advocacy closes the loop. Referral-sourced pipeline, review velocity on category sites, and customer-led content all sit downstream of an adoption motion that actually delivers value. The metric is referral-sourced pipeline as a share of total pipeline, and the leading indicator is NPS or product-satisfaction scores among activated accounts 4. Treating advocacy as a discrete funnel stage — with its own budget, owner, and quarterly target — is what separates SaaS companies that compound from those that re-acquire the same revenue every year.
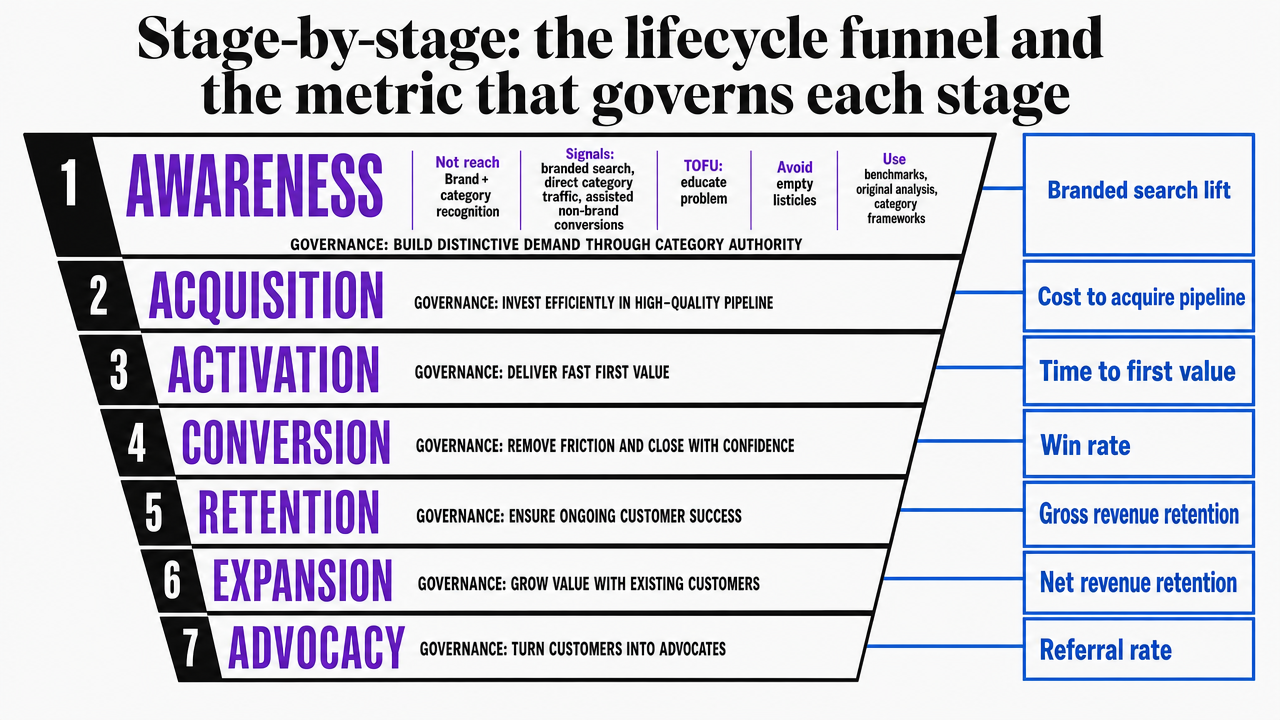 Visualize the seven-stage SaaS lifecycle funnel with the primary metric governing each stage, directly supporting the section's stage-by-stage breakdown
Test a Unified SaaS Funnel Execution Platform
Experience coordinated SEO, PPC, and content workflows driving measurable pipeline impact from day one of your trial.
The unit economics that decide whether the funnel is working
Three numbers decide whether the funnel is a growth engine or a treadmill: CAC, LTV:CAC, and payback period. The 2026 benchmark for median B2B SaaS CAC is $702, with a healthy LTV:CAC floor of 3:1 and an efficiency threshold of 5:1 or higher 15, 5. Payback discipline is segment-specific — under 12 months for SMB-focused businesses and under 18 months for mid-market, with the gap reflecting how much working capital each segment can tolerate before recovery 11.
LTV itself varies by an order of magnitude across segments. SMB LTV typically lands in the $15K–$40K range, while enterprise LTV runs from $300K to over $1M per account 11. That spread matters because the same funnel investment produces wildly different unit economics depending on which segment it serves, and a marketing team optimizing for blended CAC across mixed segments is averaging away the signal that should drive budget allocation. The mid-market segment in particular tends to get under-funded because its CAC sits above SMB while its LTV sits below enterprise, making payback math look worse than either neighbor on a single dashboard view.
The 3:1 ratio is the threshold below which the business is acquiring revenue it cannot profitably retain. The 5:1 ratio is where capital efficiency starts compounding — every dollar of acquisition spend returns five dollars of customer value over the contract life, leaving margin for product investment and expansion campaigns. Most SaaS businesses sit between these two ratios, which is the operating range where marketing decisions actually matter 5.
One caveat worth naming: these benchmarks describe acquisition economics. A marketing organization measuring only new-logo CAC against new-logo LTV is reporting on roughly half the revenue it influences. Expansion attribution changes the denominator, and the next section makes that change explicit through a stage-by-stage table tied to the same sources.
Stage-to-metric economics table
The table below consolidates each lifecycle stage to its primary metric and the benchmark range a SaaS marketing organization can hold itself against. Every figure is drawn from the research map; ranges left as directional reflect metrics that are product-specific rather than benchmarked at the industry level.
| Stage | Primary Metric | Benchmark Range | Source |
|---|---|---|---|
| Awareness | Branded search lift, assisted conversions | Directional; lagging indicator | 16 |
| Consideration | Vendor assets per closed-won deal | 5+ assets per shortlisted vendor | 14 |
| Decision | Website conversion rate | 2–3% average B2B | 15 |
| Onboarding | Activation rate | Product-specific milestone | 12 |
| Adoption | PQL volume, feature adoption | Product-specific | 12 |
| Expansion | Net revenue retention | 120%+ best-in-class | 19 |
| Advocacy | Referral-sourced pipeline share | Directional; tracked quarterly | 4 |
| Unit economics | CAC, LTV:CAC, payback | $702 median CAC; 3:1 floor, 5:1 efficient; <12mo SMB, <18mo mid-market | 15, 5, 11 |
Read across the rows and the funding logic becomes legible: the stages with the loudest dashboards are not always the stages with the largest economic leverage.
See How Unified Funnel Analytics Accelerate SaaS Revenue Growth
Request a walkthrough of integrated funnel reporting designed for SaaS teams needing precise coordination across SEO, paid, and content channels—built to surface actionable, account-level insights that drive measurable pipeline impact.
The coordination tax: what fragmented SEO, paid, and link programs cost in cycle time
Every SaaS marketing org running SEO, paid, and backlinks through separate vendors or pods is paying a coordination tax. It rarely shows up as a line item, but it is visible in cycle time: the weeks between a keyword brief landing with the content team and the corresponding paid campaign going live, the months between a backlink target list and the supporting pillar page being indexed, the quarter that passes before paid bids are adjusted to reflect what SEO has already learned about converting intent.
The tax compounds because each program is measured against a different objective:
- SEO reports on rankings and organic traffic.
- Paid reports on CPL and ROAS.
- Backlinks report on domain authority and referring domains.
None of those metrics share a denominator with recurring revenue, which means none of them tell the VP whether the three programs are actually working on the same pipeline 6. The result is parallel optimization against parallel KPIs, with the integration work — keyword alignment, landing page consistency, link targets that reinforce paid landing pages — left to whoever has time at the end of the week.
What this costs is straightforward. Buyers who consume vendor content in volume during consideration expect that content to be coherent across channels 14. A prospect who clicks a paid ad and lands on a page whose messaging contradicts the organic result two positions above it is a prospect already discounting the vendor. A backlink campaign earning placements for a category term the paid team is not bidding on, or for a topic the content team has not yet built a destination for, is link equity flowing into pages that do not convert.
The operating answer is not more meetings. It is shared inputs: one keyword and intent map that drives both SEO briefs and paid keyword lists, one shared library of decision-stage assets that paid traffic and organic traffic both terminate at, one revenue-event taxonomy that lets every channel report against the same downstream definitions 3. Teams that consolidate those inputs typically find that 20–30% of their channel spend was working against itself — bidding on terms where organic already ranked, or producing content for topics paid was already winning conversions on at a lower cost per acquisition. The compounding only starts once the three programs are reading from the same plan.
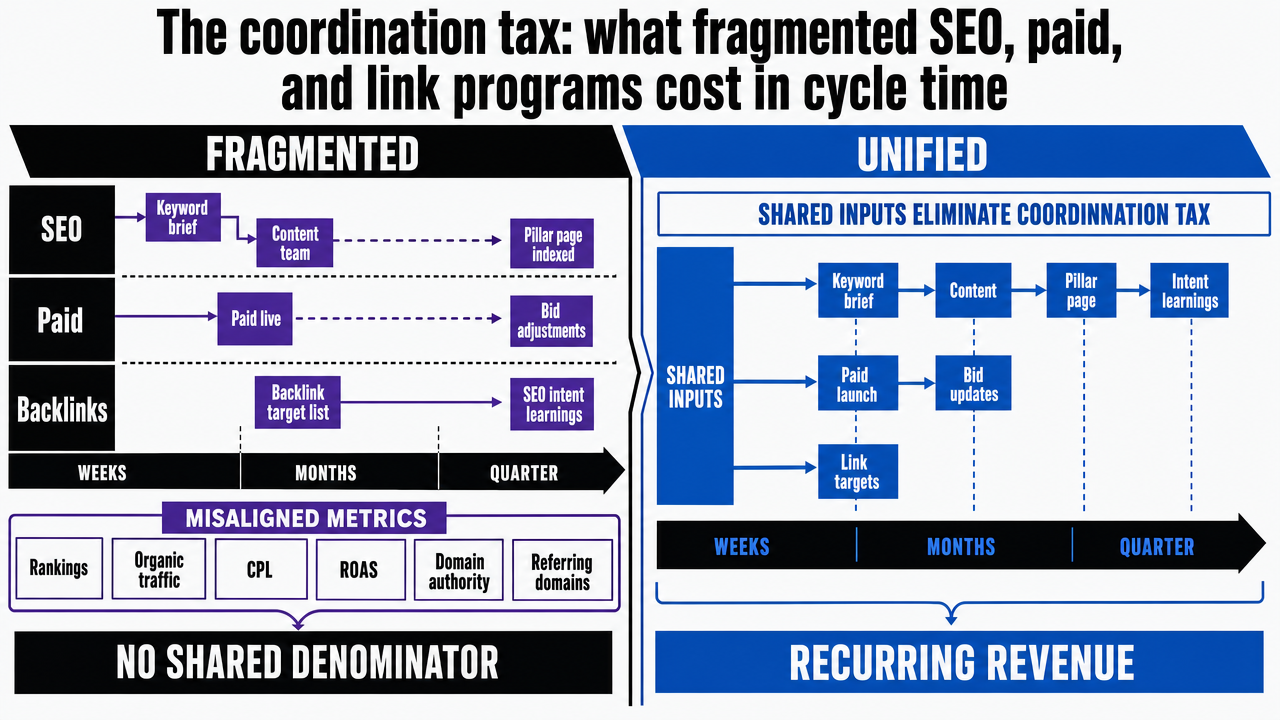 Visualize the comparison between fragmented vs unified channel operations described in the section, showing how shared inputs eliminate the coordination tax
Revenue attribution: three to five events, not thirty
Most SaaS attribution stacks fail at the same point: they try to track everything and end up trusting nothing. The discipline that separates a working revenue attribution model from a dashboard nobody uses is event selection. Three to five events that directly connect to revenue — not thirty engagement signals that correlate with intent — are what an attribution model should resolve against 7.
The candidate event list for a SaaS funnel is shorter than most teams expect:
- Demo requested
- Trial started
- Paid conversion
- Expansion event (seat add, tier upgrade, or product cross-sell)
- Renewal
Those five cover the revenue surface of nearly every subscription business. Everything else — content downloads, webinar attendance, pricing-page visits — is an upstream signal that should feed the model, not a destination event the model resolves against 7.
Model choice follows event selection. First-touch attribution overweights awareness and undervalues the consideration library that does the actual closing work. Last-touch overweights the demo form and erases the months of organic content and paid retargeting that produced the click. Multi-touch is the model SaaS funnels need, but only once the event taxonomy is clean — running multi-touch attribution against thirty noisy events produces an answer that looks rigorous and is, in practice, random 7.
The implementation sequence is straightforward:
- Define the revenue events first.
- Instrument them in one analytics system.
- Connect that system to the CRM and billing platform.
- Layer the attribution model on top.
Most teams reverse the order, picking a tool before defining the events, and spend two quarters reconciling data they should have agreed on in a one-hour meeting.
Frequently Asked Questions
References
- 1.The 5 Stages Of A Successful B2B SaaS Marketing Funnel.
- 2.B2B SaaS Marketing Funnel: Building Your Strategy Beyond AIDA.
- 3.B2B SaaS marketing funnel strategy for scalable revenue growth.
- 4.Mapping The B2B SaaS Customer Journey To Improve It.
- 5.Best SaaS Metrics for Customer Acquisition Funnel Success.
- 6.B2B SaaS Funnel Metrics: Benchmarks for Success.
- 7.Revenue Attribution in SaaS: Methods, Metrics, and Implementation.
- 8.A winning SaaS customer journey: From signup to success.
- 9.B2B Customer Journeys: Key Changes in 2024.
- 10.How to Align SaaS Marketing Content with the Buyer's Journey.
- 11.B2B SaaS LTV Benchmarks — 939 Companies by Segment ....
- 12.SaaS Marketing Funnel: Stages, Metrics & Growth Strategies.
- 13.How to Create an Effective B2B SaaS Marketing Funnel?.
- 14.The B2B Customer Journey: Stages, Mapping & Strategies.
- 15.Latest B2B Marketing Benchmarks 2026: CAC, ROI, Conversion Stats.
- 16.Awareness Stage of Marketing Funnel: 2026 Steps & Examples.
- 17.B2B Customer Journey Mapping: Complete Guide for Advertisers.
- 18.Awareness to Advocacy: Stages of A B2B Customer Journey.
- 19.B2B SaaS Marketing Benchmarks: CAC & Conversion | Understory.