
Key Takeaways
- Organic search drives revenue through three mechanisms: qualified pipeline volume, compressed CAC from higher-intent conversions, and citation visibility inside AI answer engines that now shape purchase decisions 7.
- Cutting SEO to fund paid search degrades paid performance, because organic clicks lift the utility of paid clicks 3.5 times more strongly than the reverse 9.
- In high-LTV service categories, payback should be modeled against customer lifetime value — one acquired case or contract often clears an entire year of program cost, reframing the CFO conversation from cost justification to opportunity cost.
- Fund content depth on bottom-funnel commercial queries, the authority foundation that feeds AI overviews, a written attribution model held constant for a full fiscal cycle, and execution capacity matched to the roadmap.
The CFO Question SEO Budgets Keep Failing
Most SEO budgets die in one meeting. A CFO asks how much booked revenue the last twelve months of organic search work produced, and the marketing team returns with rankings, sessions, and domain authority scores. None of those numbers close the loop to cash. The budget gets cut, or held flat while paid channels absorb the growth mandate.
This is the wrong fight to lose. Forrester's Total Economic Impact analysis of SEO investments concludes that organic search is not optional for any company operating a website — it drives measurable traffic, leads, and revenue when programs are evaluated against business outcomes rather than visibility metrics 1. The gap is not whether SEO produces revenue. The gap is whether marketing leaders can show the mechanism.
McKinsey's work on B2B growth adds a second pressure point. Firms with advanced marketing analytics are meaningfully more likely to outperform their market on revenue growth, yet many B2B organizations still lack the data infrastructure to connect digital marketing activity to booked pipeline 11. The measurement problem is what puts SEO on the discretionary line, not the underlying economics.
The sections that follow lay out a defensible answer to the CFO question. Three mechanisms link organic search promotion to revenue:
- Qualified pipeline volume
- Conversion economics that compress customer acquisition cost
- Visibility inside AI-mediated search surfaces
Each mechanism carries evidence a marketing VP can present without asking the finance team to take anything on faith.
Three Mechanisms That Link Organic Search to Booked Revenue
Mechanism One: Qualified Pipeline Volume at the Top of the Funnel
The first mechanism is the simplest to defend and the easiest to measure. Organic search sits upstream of the digital revenue pool that now dominates B2B commerce. McKinsey's 2026 analysis of B2B economics reports that 71% of B2B companies operate e-commerce, and among those firms, roughly one-third of total revenue flows through digital channels 3. That figure defines the addressable pool. The channel that most reliably feeds it is search.
Search is where buyer research begins in categories where the buyer will not accept a cold call. This is even more pronounced in high-stakes service categories. A Stanford Law Review analysis of how consumers find legal help cites American Bar Association polling showing that when respondents used the internet to find a lawyer, an overwhelming majority first visited Google 10. The same pattern holds across healthcare, home services, and senior living, where the first move is a search box, not a referral form.
Academic work on ranking dynamics adds a second layer. Systematic SEO does not just win incremental clicks. It determines which organizations even appear inside the consideration set for a given keyword landscape 6. The firms that dominate the queries buyers actually type are the firms whose pipeline reflects that dominance three quarters later.
For a marketing VP, the argument reduces to a single sentence. Organic search feeds a revenue pool of known size, in categories where buyers self-select through the search interface, and where ranking position controls entry into the consideration set. That is not a traffic story. It is a pipeline story with a defensible denominator.
Mechanism Two: Conversion Economics and CAC Advantage
Pipeline volume is only half of the revenue equation. The other half is what happens after the click. Organic search leads convert differently than paid or outbound-sourced leads because the intent that produced the click is deeper. A prospect who types a bottom-funnel query and lands on a specific answer has already done part of the sales team's work.
McKinsey's research on B2B sales transformation quantifies the downstream effect. When B2B organizations increase the relevance and engagement of their digital content — the content SEO promotion is designed to surface — revenue rises 5 to 10 percent and sales productivity rises 20 to 25 percent 4. Two caveats matter. The study measures content relevance broadly across digital surfaces, not SEO in isolation. And the productivity gain reflects sales team throughput, meaning the same headcount closes more revenue.
Both effects compress customer acquisition cost. A lead that arrives pre-qualified by the content it consumed on the way in requires fewer sales cycles to close. A sales team that spends less time educating prospects can handle more of them. When a CFO asks why organic CAC keeps trending below paid CAC in the year-over-year report, the mechanism is not mystical. It is the intent gradient built into how search works.
The implication for budget defense is direct. SEO does not just produce leads at a lower media cost than paid channels. It produces leads that consume less sales capacity per closed deal. Marketing VPs who track cost per opportunity and cost per closed deal — rather than cost per click or cost per MQL — see the gap widen as content depth compounds.
This is the mechanism that turns SEO from a traffic line item into a margin story. It also explains why organic contribution grows faster than organic spend once a program is past its ramp period.
Mechanism Three: Visibility Inside AI Answer Engines
The third mechanism is the one most SEO revenue arguments still get wrong. Search is no longer only ten blue links. Roughly 50% of Google searches now display AI-generated summaries, and McKinsey projects that $750 billion in US revenue will funnel through AI-powered search by 2028 7. In the same analysis, 44% of AI search users identify AI answers as their primary source of insight for purchase decisions 7. The scope matters: this is a projection built on current adoption trajectories, not a measured outcome, and it aggregates across consumer and B2B categories. Even discounted heavily, it describes a revenue displacement that a marketing VP cannot ignore in the next budget cycle.
The strategic point is that AI answer engines do not invent their citations. They pull from the same underlying content and authority signals that classic SEO has always optimized. A page that ranks in the top organic results, carries topical depth, and structures its answers cleanly is dramatically more likely to be surfaced inside an AI overview than a thin marketing page targeting the same query. SEO promotion is now the input layer for two revenue surfaces at once — the classic SERP and the generative answer.
What this changes for the marketing VP is the measurement question, not the underlying activity. The content, technical, and authority work that produced organic pipeline in 2022 is still what produces visibility inside AI answers in 2026. The metrics have to expand. Impression share inside AI overviews, citation frequency in generative answers, and referral behavior from AI-driven sessions all belong in the same dashboard as ranking positions and organic sessions.
A marketing team that treats AI search as a separate program will underfund the underlying content authority that powers both surfaces. A team that treats SEO as the input to both surfaces will show up in the queries where a growing share of revenue is being decided. The mechanism is not new. The revenue surface is.
The Digital Leader Premium and the Size of the Prize
The clearest single data point a marketing VP can bring to a budget conversation is the gap between B2B digital leaders and their peers. McKinsey's cross-industry analysis finds that B2B organizations classified as digital leaders drive five times more revenue growth than the peer set 2. The scope matters. This is a comparison of digital marketing and sales leadership overall — the full stack of demand generation, digital selling, analytics maturity, and channel integration — not SEO measured in isolation. Search is one input among several that produces the leader designation.
Even with that caveat, the implication travels. The firms pulling ahead are not the ones running better paid campaigns or hiring more sellers. They are the ones whose digital infrastructure produces compounding advantage across every buyer touchpoint. Organic search is a load-bearing part of that infrastructure because it feeds the top of the funnel, shapes what a prospect encounters during self-directed research, and controls what surfaces inside the AI-mediated queries covered in the previous section.
The size of the prize is worth stating plainly. If a company's addressable market is growing at market rate, and digital leaders are capturing revenue growth at a multiple of that rate, the delta accrues to whichever firms invest in the digital fundamentals early enough to compound. SEO is not the only lever inside that delta, but it is one of the few that produces durable share once won. A ranked page holds its position for months or years without paying media costs on every impression.
For the marketing VP building the case, the framing is not that SEO alone produces five times the growth. The framing is that leader-class digital performance requires organic search to be funded as a system, not as a discretionary line item.
 Revenue Growth of B2B Digital Leaders vs. Peers
Revenue Growth of B2B Digital Leaders vs. Peers
Test end-to-end SEO impact on real traffic
See how SEO-driven content influences pipeline and revenue with live campaigns during your trial period.
Why Organic and Paid Should Be Modeled Together, Not Traded Off
The trade-off framing is where most SEO budgets get squeezed. A CFO looks at a channel mix report, sees paid search producing attributable revenue on a two-week lag and organic producing softer numbers on a six-month lag, and reallocates. The move looks rational. The underlying economics say it is not.
A firm-level experimental study on the interaction between organic and paid search — the Ghose and Yang work published through NYU Stern — measured what happens when paid search is toggled on and off across matched conditions. Turning paid search on produced a 54% incremental revenue lift, moving total revenue from $435K to $682K in the tested firm 9. That is the number PPC teams cite when defending their line item. The more interesting finding sits one layer deeper. The impact of organic clicks on the utility of paid clicks is 3.5 times stronger than the reverse 9. Prospects who encounter a brand organically first, then see it again in paid, convert at rates that neither channel produces alone.
The scope needs stating. The study measures a single firm across controlled conditions, not a cross-industry benchmark. The magnitude will vary by category, brand strength, and query mix. What travels is the direction. Organic and paid are not substitutes competing for the same click. They are complements where organic authority raises the ceiling on what paid can convert.
The budget implication is specific. Cutting SEO to fund paid does not preserve the revenue the paid channel was producing before the cut — it degrades it, because the organic presence that was priming paid clicks disappears. A marketing VP defending a mixed budget should model the two channels as one system with cross-channel elasticity, not as two lines with separate ROI hurdles. The right question for the CFO is not which channel produces more revenue per dollar in isolation. It is what happens to blended CAC when either channel is starved.
Payback Horizons in High-LTV Service Categories
The standard hedge on SEO timelines — six to twelve months before meaningful returns — is the wrong frame for high-LTV service categories. The right frame is payback expressed against customer lifetime value, not against media spend in the same quarter.
Consider what a single acquired customer is worth in the verticals where organic search dominates the buyer's first move. A personal injury case, a dental implant patient, a senior living resident, a multi-year home services contract, a mid-market B2B software account — each carries a lifetime value that in most cases exceeds an entire year of program-level SEO spend. When one incremental customer per quarter clears the full annual investment, the payback math looks nothing like the payback math for a commodity e-commerce category.
The Forrester analysis of SEO ROI applies its Total Economic Impact framework precisely because ranking positions, sessions, and lead counts do not settle the question on their own 1. What settles it is incremental revenue net of program cost, modeled across a multi-year window where ranked pages continue producing without incremental media outlay. A page that reaches position one for a high-intent commercial query in month nine keeps producing in months ten through thirty-six. The media cost of each subsequent impression is zero.
This is why payback should be modeled as break-even against LTV, not against monthly spend. A useful discipline: express the program hurdle as the number of net-new customers required per quarter to cover twelve months of SEO investment, then compare that number to the current organic-sourced close rate. In categories where one qualified case or one signed contract clears the hurdle, the argument moves from cost justification to opportunity cost of underinvestment.
If You Manage Multiple Locations: The Consolidation Economics of SEO Execution
This section shifts scope. The reader here runs marketing across a portfolio — a DSO with forty practices, a personal injury firm across a dozen metros, a home services brand with regional operating companies, a senior living operator with a hundred communities. The revenue mechanics from the earlier sections still apply. The execution model does not.
Multi-location SEO breaks the traditional agency retainer in a specific way. Per-location content depth, technical hygiene across dozens of location pages, and citation and review management scale multiplicatively, not linearly. The volume of small decisions — which practice needs a new service page, which market has decayed rankings, which location's Google Business Profile is stale — exceeds what a retainer team can triage without adding hours faster than the operator can add locations.
The cost structure most portfolios inherit looks like this:
| Function | Traditional Model | Consolidated Execution Model ||---|---|---|| Strategy and roadmap | Agency retainer | Single platform, per-location roadmap || Per-location content production | Freelance writers or content shop | Same platform, per-location cadence || Technical SEO audits | Specialist vendor | Same platform, continuous monitoring || Local citations and reviews | Point solution subscription | Same platform, local layer || Reporting and attribution | Internal analyst hours | Same platform, unified dashboard || Vendor coordination overhead | Recurring PM hours per month | Approval workflow, no coordination |
The variables that decide the consolidation math are the retainer range per vendor, per-location content volume required to hold rankings, and the internal hours currently spent coordinating between vendors. Portfolios with more than roughly a dozen locations tend to find the coordination overhead alone — briefing cycles, status calls, cross-vendor conflicts — exceeds the content production cost by the time the location count doubles again. The revenue argument from earlier sections only cashes in if execution can keep pace with the ranking positions the strategy calls for.
See How Leading Teams Quantify SEO’s Direct Impact on Revenue
Request a walkthrough of unified workflows that tie SEO promotion activities to down-funnel metrics—pipeline, bookings, and revenue—without expanding your team or adding new vendors.
Building an Attribution Model Your CFO Will Accept
A CFO does not need marketing to solve last-touch attribution perfectly. A CFO needs marketing to draw a consistent, auditable line from organic activity to booked revenue that holds up across quarters. The model below is deliberately simple, because complexity is what causes finance teams to distrust the output.
Start with four layers, each with its own owner and its own source of truth:
- Layer one is organic sessions and impressions inside both classic SERPs and AI overviews, pulled from analytics and search console data.
- Layer two is organic-sourced conversions on the site — form fills, calls, chats, bookings — captured at the session level with the entry channel preserved.
- Layer three is the sales-qualified opportunity, tagged in the CRM with the original acquisition channel intact through the pipeline.
- Layer four is booked revenue, closed in the system of record and joined back to the originating session.
The attribution weight applied between layers is where most models fail. A defensible starting point: credit organic search with full pipeline attribution for self-sourced leads where organic was the first touch, and partial credit under a documented multi-touch rule where organic assisted a paid or referral path. The Ghose and Yang experimental evidence on cross-channel utility supports assisted credit as a real economic effect, not a courtesy allocation 9. Document the rule in writing. Freeze it for a full fiscal cycle. Report the same way every month.
What this produces is not a perfect number. It is a stable one. A stable attribution model, held constant across quarters, gives the CFO a trendline. A trendline is what unlocks continued funding.
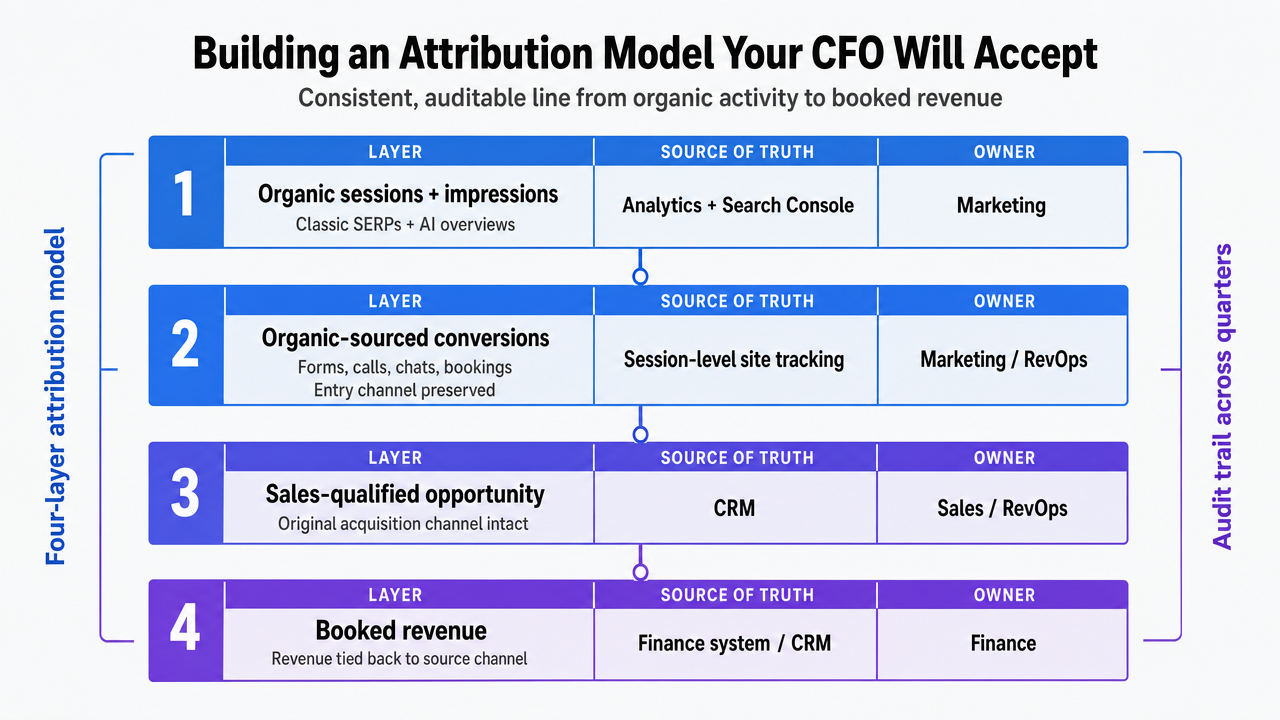 Visualize the four-layer attribution model described in the section, translating the written framework into a scannable process infographic that maps each layer to its data source and owner
What Marketing VPs Should Fund Next Quarter
Four funding priorities carry the strongest revenue math heading into next quarter:
- First, content depth on the queries that decide purchase — the bottom-funnel commercial terms where a ranked page compounds without incremental media cost and where organic-sourced leads convert with less sales capacity per deal 4.
- Second, the technical and authority foundation that determines citation frequency inside AI overviews, because the same signals now serve two revenue surfaces at once 7.
- Third, an attribution model documented in writing and held constant for a full fiscal cycle, so the trendline the CFO sees is stable rather than seasonally re-engineered.
- Fourth, execution capacity that matches the roadmap the strategy calls for — the coordination overhead of stitching together retainers, freelancers, and point vendors is where most programs stall before the ranked pages ever ship.
The marketing VPs who defend and expand organic budgets next year will be the ones who present SEO as a revenue system with a documented mechanism, not a tactic bundle. Platforms like Vectoron were built for that operating model — approval-first execution across content, technical, and authority work, tied to the pipeline data that makes the CFO conversation shorter.
Frequently Asked Questions
References
- 1.The ROI Of SEO.
- 2.How B2B digital leaders drive five times more revenue growth than their peers.
- 3.The surprising economics of B2B growth.
- 4.Future of B2B sales: The big reframe.
- 5.Examining the Impact of Ranking on Consumer Behavior and Search Engine Revenue: Evidence from Field Experiments.
- 6.The SEO effect. Mapping the optimized landscape around a keyword.
- 7.New front door to the internet: Winning in the age of AI search.
- 8.Search engine Performance optimization: methods and ....
- 9.Analyzing the Relationship Between Organic and Sponsored Search Advertising: Firm-Level Experiments.
- 10.The User Experience of the Internet as a Legal Help Service.
- 11.The new B2B growth equation.