
Key Takeaways
- An SEO report earns finance credibility only when GSC, GA4, and the CRM share join keys, and the first organic touch is stamped on the contact record at creation and locked against overwrites2, 3.
- Lead the executive view with four metrics: organic-sourced pipeline, organic-influenced pipeline, organic revenue with pipeline velocity, and content decay, while treating lead volume as context rather than a headline number6, 12.
- Present multi-touch attribution as the primary contribution figure, keep first-touch as the sourced number beside it, and use last-touch only to diagnose conversion pages so middle-funnel content stays visible1, 3.
- Next quarter, lock the source field at contact creation, publish written definitions for sourced and influenced pipeline, and rebuild the report's top around revenue, sourced, influenced, and velocity tiles1, 12.
Why the current SEO report gets ignored in the boardroom
Most SEO reports often fail to resonate with finance teams because they focus on metrics like rankings and impressions rather than pipeline and revenue. This creates a disconnect when compared to other channels like paid media, which directly report on cost per opportunity and closed-won revenue.
To bridge this gap, a robust data stack combining Google Search Console (GSC), GA4, and the CRM is essential. This integration allows for the attribution of keywords to closed deals, transforming SEO reports from traffic-focused documents into financial instruments2. Without this CRM connection, teams report on traffic instead of money, making it difficult to justify budget in executive reviews2. A lead becomes attributable only when its first organic touch lives on the same record as the closed-won amount3. This article outlines how to build such a report, covering the necessary data stack, key metrics, attribution models, and reporting cadences.
The reporting architecture that survives a CFO review
The minimum data stack: GSC, GA4, and the CRM
Tying a keyword ranking to a closed deal requires a unified view across multiple platforms. Google Search Console provides query and impression data, GA4 offers session, landing page, and event data, while the CRM stores contact, opportunity, and revenue information. Integrating these three systems allows reports to answer the CFO's core question: what pipeline originated from specific search behaviors2?
This integration is not merely conceptual; it relies on capturing specific physical keys when a session converts into a contact. GSC identifies the query and landing page. GA4 provides the session identifier and conversion event (e.g., form submission, call connection). The CRM then stores the contact record, opportunity, and ultimately, the closed-won amount. The critical handoff occurs when the first-touch source field on the contact record is populated by GA4. Without this crucial step at contact creation, the attribution trail ends prematurely at the form.
The primary failure point in most reporting is this handoff, not the data collection itself. While GSC, GA4, and CRM systems are typically present in martech stacks, the critical missing piece is the field mapping that transfers organic source, first landing page, and query context from analytics to the CRM contact record, preserving it throughout the lead lifecycle. This mapping is what elevates a simple dashboard to a comprehensive attribution system2. A reporting architecture designed for finance scrutiny treats these three systems as a single dataset with defined join keys, rather than disparate data sources.
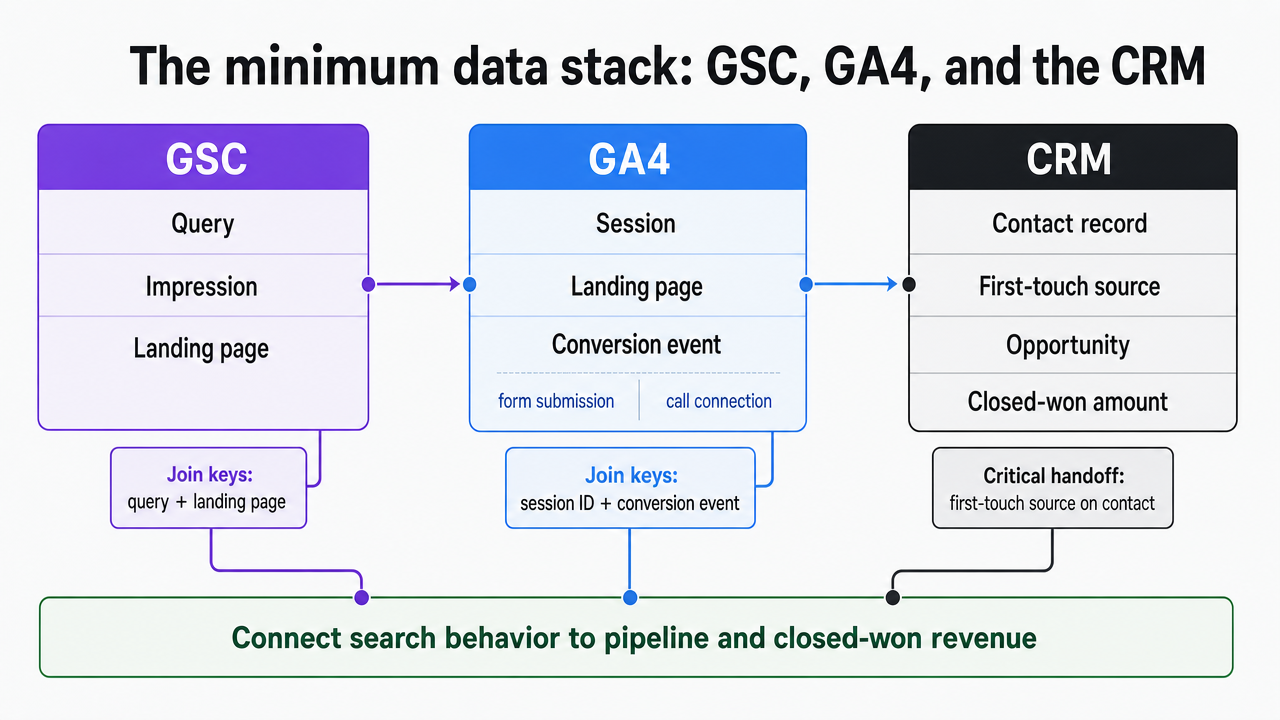 Visualize the three-system data stack and the join keys that flow between GSC, GA4, and the CRM to connect a query to closed-won revenue, directly supporting the section's argument
Stamping the source: how organic touch lives on the CRM record
The integrity of attribution reports hinges on accurately stamping the source when a lead enters the CRM. If a lead lacks a source stamp, all subsequent reports will inherit this data gap. A lead is only truly attributable when its initial organic touch is recorded on the same CRM record that eventually tracks the closed-won amount3.
"Stamping the source" involves three key actions at the point of form submission or call connection:
- the first organic landing page is written to a contact-level field;
- the referring query, if available from GSC or GA4, is captured; and
- the acquisition channel is set to "organic" and locked to prevent overwriting by subsequent sales touches.
This three-step process ensures that the first organic landing page is recorded, written to the CRM, and that measurement focuses on won revenue rather than just leads6. The most common failure occurs in the middle step, where marketing operations creates sophisticated GA4 dashboards, but the CRM's source field remains blank or is overwritten.
Once the source stamp is reliable, the report can accurately group opportunities by their original acquisition channel, providing finance with a credible pipeline-created figure per channel. Without this reliable stamping, the report remains a directional narrative rather than verifiable data.
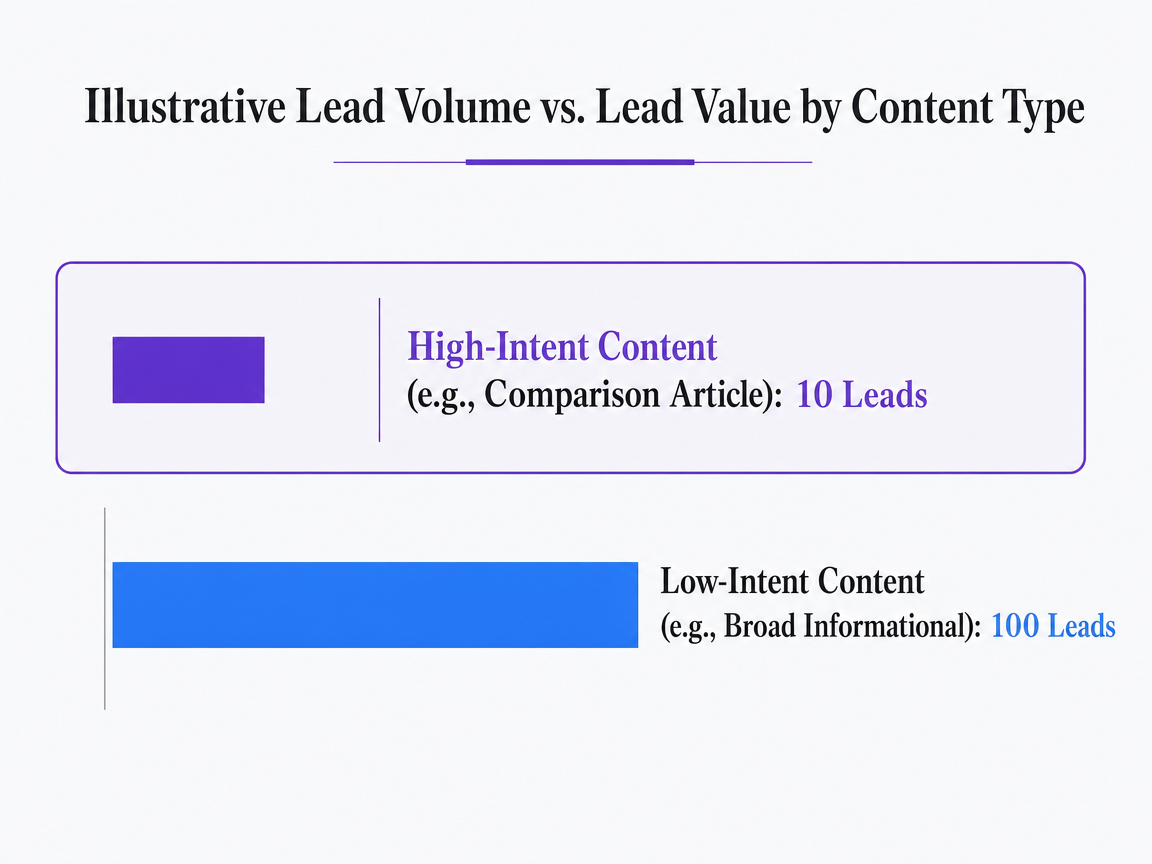 Illustrative Lead Volume vs. Lead Value by Content Type
This data illustrates that a smaller volume of leads (10) from high-intent content like a comparison article can be more valuable than a larger volume (100) from broader, top-of-funnel content. The chart should emphasize the quality vs. quantity trade-off.
The four metrics that belong at the top of the report
Organic-sourced pipeline, defined for a spec doc
Organic-sourced pipeline represents the total opportunity value from contacts where organic search was identified as the initial source that created the contact or account1. This precise definition should be included verbatim in any specification document. Clear definitions like this streamline discussions about credit allocation, especially when the first-touch source field is established as the single source of truth.
Reporting teams should present this as a rolling figure: the total pipeline value from opportunities where the primary contact's first touch was organic search, filtered by the current reporting window7. Two safeguards ensure accuracy: first, the source stamp is set at contact creation and protected from later overwrites; second, the opportunity amount reflects the current stage value, not an initial estimate, maintaining data integrity as deals evolve.
Organic-sourced pipeline is highly valued by finance because it directly maps to channel budgets and clearly identifies which channel introduced an account. This metric will be the first that reporting teams are asked to explain, making a pre-defined written definition crucial before dashboard development.
Organic-influenced pipeline, and why it is not double counting
Organic-influenced pipeline refers to opportunity value where organic search played a significant role as a touchpoint during the deal cycle, even if the initial source was different1. For instance, a prospect initially acquired through a paid ad who later returns via multiple organic sessions to comparison pages and pricing FAQs before a demo would contribute to influenced pipeline, not sourced.
While finance teams may perceive this as double counting, it is not, provided both sourced and influenced figures are reported separately and never combined. Sourced pipeline identifies the channel that introduced the account, while influenced pipeline highlights the content consumed during the decision-making process. Both metrics are important and inform different budgetary discussions.
Reporting influenced pipeline is practical because it safeguards middle-of-funnel content from being undervalued by last-touch attribution models. A single figure for organic-assisted opportunity value, calculated across all deals where organic was a documented touchpoint, ensures this content remains visible and its contribution recognized in reviews9.
Organic revenue, pipeline velocity, and content decay
Organic revenue represents the closed-won amount from opportunities attributed to organic search based on the chosen reporting model. This is the metric that CFOs prioritize. Reports that emphasize business impact typically feature organic-attributed revenue, organic lead volume, and conversion value prominently, treating other metrics as supporting context12.
Pipeline velocity measures the speed at which organic-sourced opportunities progress through the sales funnel. In B2B, this typically involves stages from organic visit to MQL, SQL, opportunity, and finally, closed-won, with each transition timestamped9. Analyzing velocity reveals whether organic-sourced deals close faster or slower than those from other channels, providing strong evidence for expanding specific content clusters. When comparison-stage content demonstrably shortens the path from opportunity to closed-won, the velocity difference serves as key evidence.
Content decay tracks pages that were previously performing well but are now declining in rankings and conversions. This metric, alongside organic revenue, organic lead volume, and technical health status, is one of the four non-negotiables for client-facing reports12. Decay acts as a leading indicator: a page losing impressions this month signals potential pipeline loss next quarter, and the report should flag this trend before it impacts revenue figures.
Why lead volume misleads: quality over count
Lead volume, while frequently carried over from older reports, can be misleading. It's crucial to measure won revenue rather than just lead count, as ten high-quality leads from a comparison article can be more valuable than a hundred from a broad informational piece6.
This distinction holds up under scrutiny: ten high-intent leads from a bottom-of-funnel comparison page are fundamentally different assets from a hundred low-intent leads from a general informational post, even if the lead count appears similar. The pipeline value per lead can differ by an order of magnitude, with content generating fewer leads often contributing more significantly to revenue6.
Consequently, lead volume should be relegated to a contextual role in reports. Instead, pipeline value per lead, segmented by content cluster or landing page, should guide budget allocation for content production. When this metric is visible, the rationale for prioritizing comparison and evaluation content over thin informational content becomes self-evident.
Test Real-Time SEO Reporting on Live Campaigns
Evaluate actual pipeline impact by generating and publishing SEO reports on your own data during the trial.
Attribution model choice, shown on a single deal
First-touch, last-touch, and multi-touch on the same opportunity
Attribution model debates are best resolved with concrete examples. Consider a $50,000 opportunity that closed last quarter. The account's first interaction was an organic session on a comparison article, followed two weeks later by another organic visit to a pricing FAQ. Ten days after that, a sales rep initiated contact via email. The prospect then downloaded a gated guide from a paid LinkedIn ad, attended a webinar, and finally submitted a demo request directly on the site. This represents six touches across five channels for one closed deal.
Under a first-touch attribution model, organic would receive full credit for the $50,000, as the comparison article initiated the contact record. In contrast, last-touch attribution would assign zero credit to organic, as the direct visit to the demo request page is considered the closing touch. With a linear multi-touch model, credit is distributed proportionally: since three of the six touches were organic, organic would be credited with approximately $25,000 of pipeline contribution9.
The underlying activity remains constant across all scenarios; only the accounting changes. This distinction is crucial for reporting teams to convey to finance before discussing model preferences. Pipeline contribution is defined as the dollar value of opportunities where organic was a documented touchpoint, segmented by sourced versus assisted9. This segmentation protects organic from the "last-touch trap," where top-of-funnel content appears valueless because it doesn't directly lead to the final conversion click3.
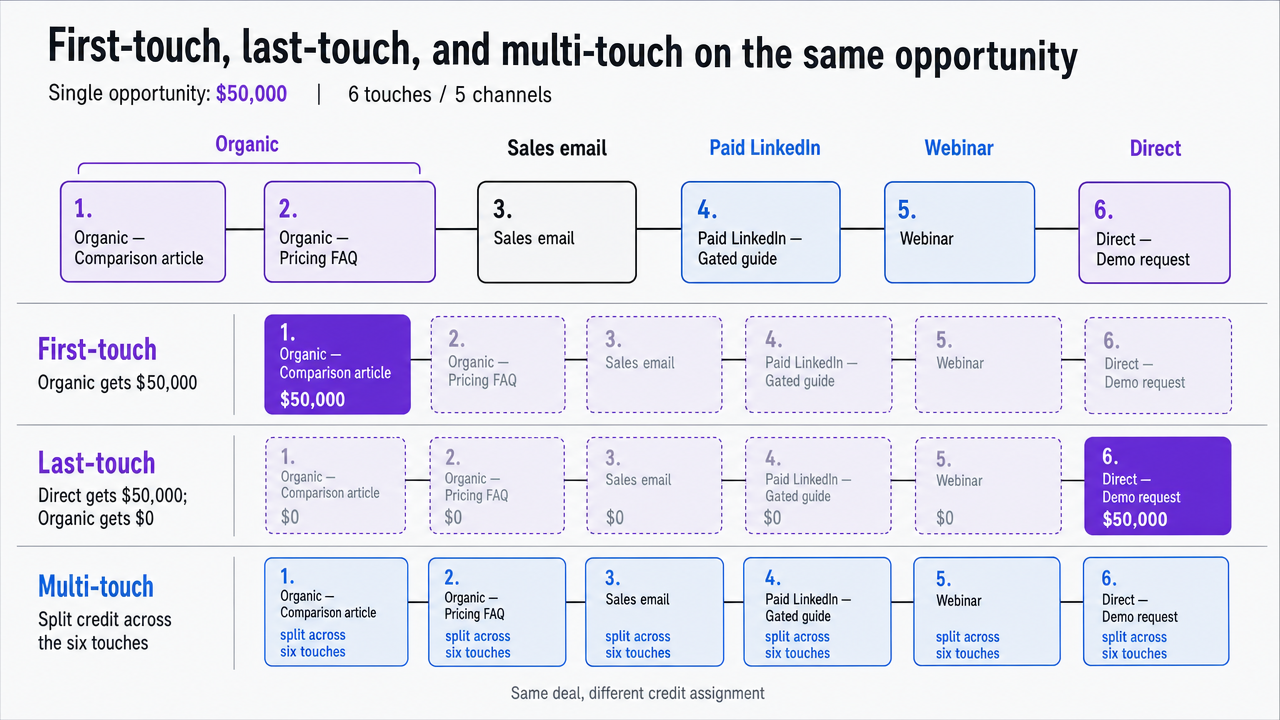 Illustrate the section's worked example of a single $50,000 opportunity credited differently under three attribution models, making the accounting difference concrete for readers
Which model to lead with, and which to keep as a diagnostic
Multi-touch attribution should be prioritized in reports. It accurately reflects the complex buying journey of B2B accounts and ensures that assisted content remains visible within the pipeline figures, rather than being isolated in separate reports1.
First-touch attribution should be retained in the report as the sourced pipeline figure, presented alongside multi-touch rather than as an alternative. Sourced attribution identifies the channel that introduced the account, while multi-touch quantifies organic's contribution across the entire journey. Both numbers should be displayed, but never summed together.
Last-touch attribution should be relegated to a diagnostic tool, useful only for evaluating the performance of specific conversion pages at the point of intent. Over-reliance on last-touch obscures the middle of the funnel, making comparison and evaluation content seem expendable, despite often being strong predictors of close rates3. Reporting teams should be able to succinctly defend their model choices to the CFO: first-touch for channel introduction, multi-touch for overall contribution, and last-touch for conversion page diagnostics.
Reporting cadence by audience
Reporting cadence is a strategic design choice, not merely a scheduling preference. The same underlying data can generate four distinct reports, each tailored to a specific audience and frequency. Mismatched cadences can quickly erode trust in the reported numbers. A dashboard should feature 4 to 6 primary KPI scorecards with period-over-period comparisons, with the specific KPIs determined by the audience4.
Weekly reports are best suited for the SEO lead. These reports are operational, focusing on query movement, indexation, top-page traffic changes, and critical decay flags requiring immediate attention. Pipeline metrics do not fluctuate significantly enough within a week to warrant inclusion, as this would introduce unnecessary noise that the reporting team would then have to explain4.
Monthly reports are appropriate for the marketing director. These should prominently feature organic-sourced pipeline, organic-influenced pipeline, lead volume by content cluster, and content decay trends. This cadence aligns with content investment decisions, enabling reallocation between clusters without waiting for a full quarterly review12.
Quarterly reports are designed for the VP and C-suite. These should be concise, featuring four key tiles: organic revenue, organic-sourced pipeline, pipeline velocity compared to other channels, and technical health status. All other details should be moved to an appendix. Executive stakeholders prefer reports that lead with business impact and are brief12. The quarterly review is also the appropriate forum to formally defend attribution model choices, ensuring finance sees consistent definitions across cycles.
What to cut from the current report
Space at the top of an executive report is a premium, and every metric included must justify its presence by influencing a decision. Any metric that doesn't meet this criterion belongs in an appendix or should be removed entirely.
Average keyword position, for example, should be cut from executive reports. It fluctuates weekly, has a loose correlation with clicks, and is irrelevant in financial discussions. It's suitable for the SEO lead's operational view but not for directors or VPs12. Similarly, backlink counts are useful for diagnosing technical health issues but are not a headline metric for demonstrating pipeline impact.
Bounce rate and time on page should be moved to the appendix. These are proxy metrics that GA4 no longer measures as older reports assumed, and they don't directly map to CRM stages. Impressions should only be included if paired with click-through rate and query intent, as impressions alone can overemphasize broad informational content that generates low-value leads6.
Volatile month-over-month deltas should be replaced with trend lines. A single month's fluctuation in organic sessions rarely warrants a budget change. Reporting on trends helps executives focus on meaningful signals rather than short-term noise11. "Vanity wins," such as featured snippets or new referring domains, should be relegated to supporting slides.
The guiding principle is simple: if a metric cannot be directly tied to pipeline, revenue, or a decision the reader will make this quarter, it does not belong on the first page of an executive report12.
Get a Data-Backed SEO Report That Connects Rankings to Pipeline Impact
Request a sample report that quantifies how organic search activity translates to qualified pipeline, with transparent metrics and channel attribution for enterprise-scale marketing teams.
If the pipeline arrives by phone: multi-location operators
The reporting framework discussed so far primarily assumes form fills and demo requests. However, for multi-location service operators like law firms, DSOs, home services, senior living communities, and healthcare groups, a significant portion of organic-sourced pipeline originates from phone calls to specific locations. If reports fail to account for this, the organic channel's contribution will be underestimated, potentially leading to misallocated content investments.
The solution involves integrating a call intelligence layer into the existing attribution spine. Dynamic number insertion on organic landing pages assigns a unique tracked phone number for each session. This ensures that a phone call carries the same first-touch source, landing page, and query context as a form submission would3. The tracked call event then fires in GA4, the qualified-call disposition is written to the CRM contact record, and the location is stamped on the opportunity. From this point, organic-sourced pipeline by location can be segmented into sourced versus assisted, just like form-driven funnels9.
Once this data is integrated, the economic impact becomes clear. The value of one additional organic-sourced qualified call per location per month can be calculated using the following formula:
| Input | Variable |
|---|---|
| Qualified calls added per location per month | C |
| Close rate on qualified calls | R |
| Average deal value | V |
| Locations in the portfolio | L |
| Annual pipeline lift | C × R × V × L × 12 |
Plugging in a portfolio's specific close rate (R) and average deal value (V) transforms the SEO report from a marketing artifact into a financial document. It's crucial to measure won revenue, not just call volume, for the same reason lead count can be misleading: one hundred calls from a generic service page may be less valuable than ten calls from a location-specific comparison page6.
What to build next quarter
The immediate task for the next quarter is not a dashboard redesign, but rather a fundamental wiring job within the CRM. Three key changes will elevate an SEO report from a mere filing-cabinet document to a credible piece of pipeline evidence for finance.
- Lock the first-touch source field at contact creation and regularly audit to prevent sales edits from overwriting it.
- Publish written definitions for both organic-sourced pipeline and organic-influenced pipeline in a specification document that marketing operations, finance, and RevOps all approve. This prevents metric definitions from shifting between quarters1.
- Rebuild the executive report's top section around four core tiles: organic revenue, sourced pipeline, influenced pipeline, and pipeline velocity, demoting all other metrics to an appendix12.
Teams that implement these changes will shift from defending organic against other channels to strategically reallocating budget between content clusters based on pipeline value per lead. This is the kind of conversation that adds significant value in a Quarterly Business Review. Platforms like Vectoron can streamline execution once this robust reporting infrastructure is in place, but establishing the infrastructure itself is what secures future investment.
Frequently Asked Questions
References
- 1.SEO Pipeline Attribution: Prove Revenue From Organic.
- 2.B2B SaaS SEO: Connect Rankings to Pipeline.
- 3.How to Attribute SEO to Pipeline (B2B SaaS Method).
- 4.SEO Reporting: Client Dashboard & Metrics Guide.
- 5.How to build standout SEO reports: 11 tips from agency marketers.
- 6.SEO Attribution for B2B - Customer Impact.
- 7.How to Measure Pipeline Impact in SaaS with B2B SEO Attribution.
- 8.How should SEO integrate with marketing attribution?.
- 9.SEO ROI for B2B SaaS: How to Measure Pipeline Impact.
- 10.Create an SEO Reports That Prove Your Value & Keep Clients Happy.
- 11.34 Tips for Delivering Powerful SEO Reports For Clients.
- 12.How to Create SEO Reports for Clients That Actually Get Read.