
Key Takeaways
- Rank-only reports fail renewal because CFOs need the translation from position to impressions, pipeline, and cost per acquired lead, not upward arrows disconnected from booked revenue.
- A defensible report stacks three layers: visibility (impressions, CTR, intent), pipeline (organic-sourced conversions from CRM), and unit economics (fully loaded CPL benchmarked against paid on the same query set).
- Paid and organic listings substitute for each other, so annotate paid spend changes and discount overlapping queries when modeling revenue, or click movement gets misread as SEO performance 2.
- Every quantitative claim needs scope, attribution window, and a clear label separating measured outcomes from modeled estimates, since FTC substantiation standards travel with figures reused in case studies and board decks 9, 10.
Why Rank-Only Reports Lose Renewals
A ranking report that only presents position data fails to address the client's core financial questions. Finance teams are concerned with pipeline, revenue, and cost per acquired customer, not just keyword movement. Rank in isolation is a leading indicator disconnected from profit and loss. Credible evaluation extends beyond position to include relevance, precision, and user experience signals like response quality and satisfaction 1. Reports showing only upward arrows without downstream metrics provide no justification for continued spend.
Agency reporting often fails at renewal due to three recurring issues:
- reporting rankings without impressions and click data,
- reporting traffic without organic-sourced leads or bookings, and
- reporting pipeline without unit economics.
This prevents comparison with other channels like paid search or social. Successful reports, conversely, use rank as a starting point for an argument that culminates in cost per acquired customer, citing evidence for each translation step to withstand scrutiny from financial stakeholders.
The Three-Layer ROI Proof Stack
Visibility: What Rank Actually Buys
Rank represents a claim on attention. Its value as evidence emerges only when combined with impressions generated by the ranked query set, click-through rates (CTR) at various position bands, and the underlying query intent. A report that omits this translation expects clients to accept position improvements as inherently valuable without demonstrating actual eyeballs and clicks delivered.
Empirical benchmarks provide a basis for this translation. For instance, in an integrated model of paid and organic listings, the mean CTR was 6.6% for paid search and 2.77% for organic, with mean conversion rates of 5.71% for paid versus 1.67% for organic 3. These figures, derived from a specific dataset, describe average behavior across a keyword portfolio and should be used as reasonable priors for modeling expected clicks, not as universal constants.
A robust visibility layer includes four key elements:
- position by keyword cluster (weighted by search volume),
- impressions served (from Search Console for organic and ads platforms for paid overlap),
- CTR segmented by position band, and
- query intent classification (branded, navigational, commercial-investigation, transactional) to account for differing conversion behaviors.
This layer answers what rank delivered in attention, serving as input for the next stage, not the final outcome.
Pipeline: From Impressions to Booked Demand
The pipeline layer is crucial for demonstrating ROI. Impressions and clicks are preliminary metrics; CFOs require evidence of organic-sourced leads, qualified calls, form submissions, and booked appointments. If the reporting system cannot attribute a lead back to an organic session on a specific ranked keyword cluster, the ranking report describes an unmeasurable system.
Credible search performance evaluation emphasizes relevance, precision, and user experience signals 1. This means the pipeline layer needs conversion-quality data alongside volume: identifying which organic leads qualified, which calls were booking-relevant, and which form fills came from target buyers. This ensures the report isn't just grading its own homework.
Four metrics are essential here:
- organic-sourced sessions to ranked pages (clustered with visibility data),
- conversion events defined by client priorities (e.g., consultation bookings, not whitepaper downloads),
- assisted conversions (reported separately), and
- lead quality dispositions (ideally from the client's CRM or call intelligence).
This layer also includes transparent disclosures regarding attribution windows, the share of organic leads untraceable to specific clusters due to query data limitations, and the proportion of assisted conversions. Such disclosures differentiate a defensible report from one easily dismissed as "marketing math."
Unit Economics: CPL, Revenue per Cluster, and the Paid Benchmark
The third layer determines whether a ranking report secures contract renewal or is deemed a vanity metric. Unit economics involves cost per organic-sourced lead (CPL), revenue attributed to ranked keyword clusters, and a direct comparison to the client's paid search CPL for similar leads.
This comparison, while sometimes unflattering to organic, is vital for honest reporting. Analysis of organic versus sponsored performance has shown paid search often outperforms organic in conversion rate, average order value, and per-visit profit, with mean profit from paid listings being roughly 3.1 times higher in a specific dataset 5. This highlights that organic and paid channels should be evaluated against channel-appropriate expectations, not identical benchmarks.
Clients often pose the wrong comparison question. The relevant inquiry isn't whether organic CPL is lower than paid CPL (which it usually is), but whether the fully loaded cost of the retainer, divided by qualified organic leads, yields a CPL within the client's target range and trends positively. Also, whether revenue from top-ranked clusters grows faster than the underlying spend.
The unit economics layer should present four data points:
- fully loaded organic CPL (including retainer and production costs),
- paid CPL for comparable queries as a benchmark,
- revenue per ranked cluster (linked to CRM close data), and
- a rolling twelve-month trend for each metric.
Presenting these lines transforms a ranking report into a defense of the retainer.
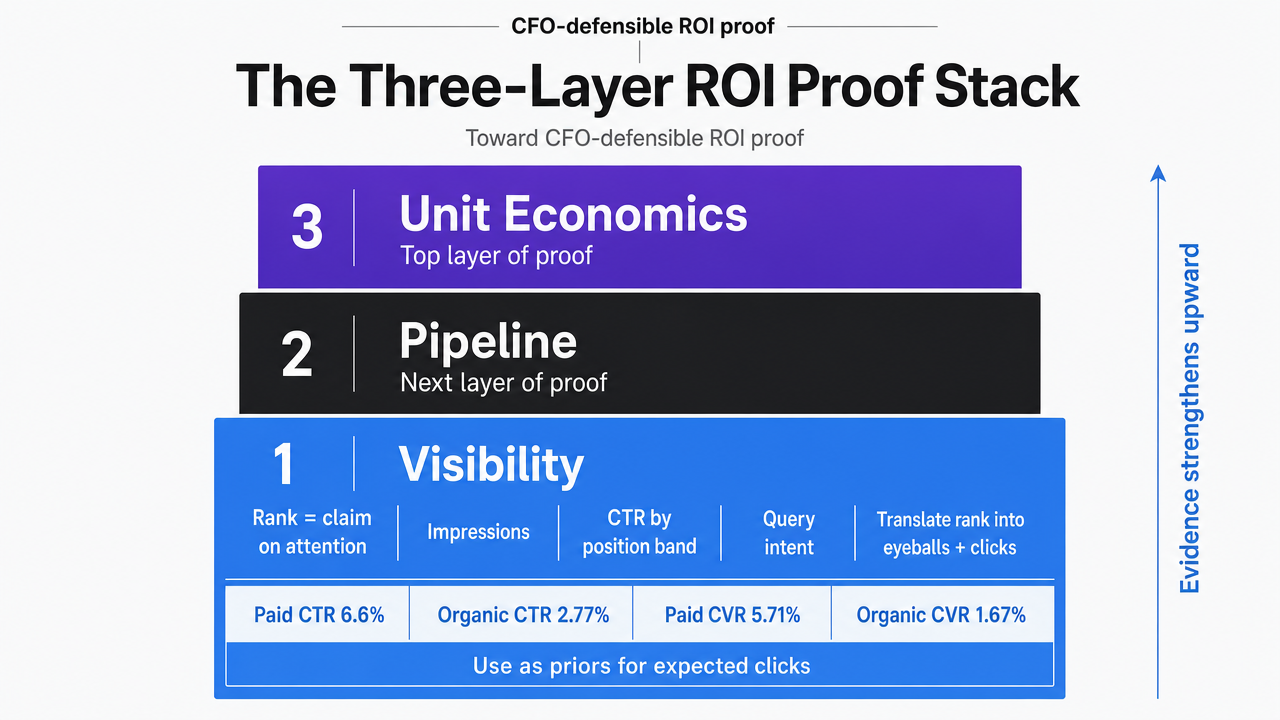 Visualize the three-layer stack (Visibility, Pipeline, Unit Economics) that structures the entire section, showing what each layer contains and how they build on each other toward CFO-defensible ROI proof
The Substitution Problem Most Ranking Reports Ignore
A ranking report that treats organic search as an isolated system will inflate the retainer's impact. When clients run paid search on overlapping queries, the channels interact, trading demand. Field experiments on sponsored search indicate that users exposed to ads spend significantly more on sponsored listings and less on organic listings within the same query environment 2. This substitution effect is stable enough to invalidate ROI narratives that disregard it.
For search engine ranking reports, this means that if a client's paid budget increased, some organic click loss is due to substitution, not SEO underperformance. Conversely, if paid spend decreased, organic click gains might be demand shifting to free listings, not a rankings victory. Reports that attribute these movements solely to organic performance misinterpret the signal.
Three adjustments address this: report organic and paid impressions and clicks for the same query set, not disjoint keyword lists; flag periods with significant paid spend changes and annotate organic numbers accordingly; and when modeling revenue from rank movement, discount estimates for queries where paid ran concurrently, rather than claiming full uplift. This last step is crucial for CFO review.
Validate Ranking Improvements With Actual Published Content
Test live ranking reports and measure true SEO impact before making a long-term commitment.
Modeling Rank Movement into Revenue Without Overclaiming
With the three layers established, the challenge becomes accurately attributing revenue to specific rank changes. The correct approach avoids both refusing to model (leaving clients to guess SEO's value) and modeling with false precision (inviting finance to disprove the report). The defensible middle ground involves applying empirical priors to the client's own funnel data.
Research on sponsored search's rank-to-conversion relationship found that improving rank significantly increased conversion, and a CTR increase from 0 to 1 boosted conversion by 63.31% in the studied dataset 4. While this study focused on paid listings in electronic markets, its directional insights are valuable. A ranking report can adopt this relationship's shape, then use the client's specific CTR-by-position and conversion-rate data to build an auditable model.
Three modeling rules ensure defensibility:
- forecast a revenue range, not a point estimate, using conservative CTR assumptions at the low end and observed account CTR at the high end;
- discount projected clicks on queries with concurrent paid activity due to substitution effects 2; and
- separate branded from non-branded queries, as their conversion behaviors differ significantly.
The final rule, often overlooked, is to present the modeled revenue range alongside actual CRM-attributed revenue for the same period and explain any discrepancies. This transparency enhances credibility rather than diminishing it.
FTC Substantiation as a Reporting Design Constraint
A search engine ranking report constitutes a performance claim. The Federal Trade Commission (FTC) mandates that advertising claims be truthful, non-deceptive, and evidence-based 9. This standard applies not only to client-published marketing materials but also to agency performance narratives, especially when they influence retainer decisions, referrals, or case studies. The FTC's online advertising guidance confirms that digital marketing communications carry the same truth-in-advertising obligations, including clear disclosures 10.
For agencies serving regulated industries like law firms or healthcare providers, this guidance is critical. A ranking report that attributes revenue to organic search without disclosing attribution windows, model assumptions, or concurrent paid activity can become the basis for a client-published claim that finance or legal teams cannot defend.
Three design choices ensure a ranking report meets substantiation standards:
- every quantitative claim must include a scope statement (what was measured, over what period, with what attribution method);
- modeled figures must be clearly labeled as models with input assumptions, not presented as measured outcomes; and
- comparative statements must cite the underlying data source.
This approach makes the report reusable, with substantiation readily available if a client's marketing director wants to incorporate data points into case studies or board decks.
If You Manage a Portfolio: Reporting Labor Economics Across Accounts
For agency SEO leads managing numerous accounts or in-house portfolio operators overseeing multi-location brands, the focus shifts from a single report to the monthly cost of producing defensible reports across the entire portfolio without eroding margins.
Reporting labor often undermines retainer economics. A comprehensive, three-layer report with cited assumptions, attribution disclosures, and reconciled CRM data demands significantly more time from a senior strategist than a simple rank-and-traffic export. Multiplying this time by the number of accounts and monthly cadence reveals how reporting rigor, while essential for renewals, can become a major cost center.
The variables are straightforward:
H : senior-strategist hours per report
A : active accounts
R : fully loaded blended hourly rate
Monthly reporting labor cost = H × A × R. The table below illustrates how different delivery models impact a 40-account portfolio:
| Delivery model | Hours per report (H) | Accounts (A) | Monthly hours | Notes |
|---|---|---|---|---|
| Hand-built senior strategist deck | H | 40 | 40H | Highest defensibility, highest labor drag |
| Templated deck with analyst assembly | ~0.5H | 40 | 20H | Cuts hours; templates often strip the substantiation that survives CFO review |
| AI-coordinated execution with strategist approval | Variable; strategist time concentrated on review and exception handling | 40 | Depends on approval load | Directional benchmark: Vectoron trial pricing at $599/mo per workflow |
Many agencies operate with templated decks and analyst assembly, which often sacrifices the non-negotiable substantiation required by FTC guidance 9. Hand-built decks protect the client narrative but severely impact contribution margin. The optimal solution, as offered by platforms like Vectoron, involves shifting strategist hours from assembly to judgment, allowing coordinated execution to handle layer joins, CRM reconciliation, and citation attachments before strategist approval. This approach enables portfolio operators to maintain reporting rigor while preserving margins.
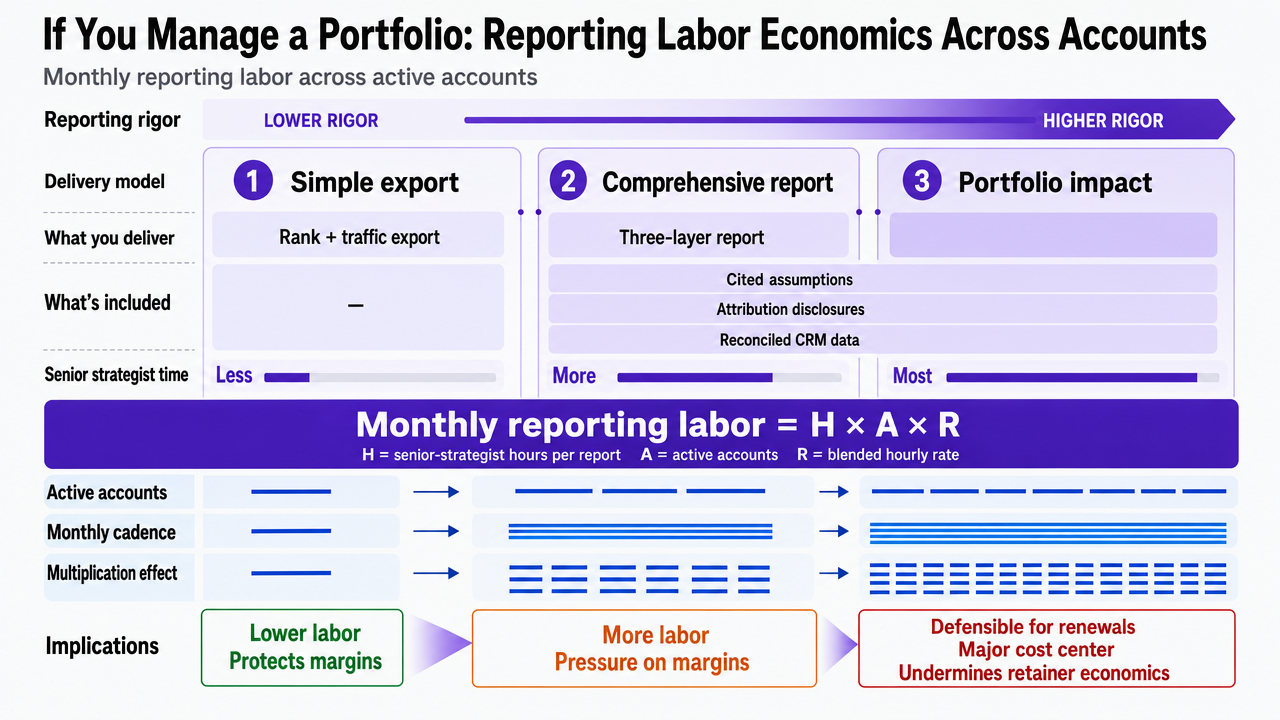 Turn the section's comparison table of three delivery models into a scannable side-by-side infographic so portfolio operators can quickly see the labor and defensibility trade-offs
Quantify SEO Impact with Precise Ranking Reports Aligned to Revenue
Connect with our team to see how automated ranking reports map search performance to client ROI, enabling scalable, data-backed reporting for multi-location and high-stakes accounts.
Local and Reputation Signals in a Ranking Report
For clients with physical locations, a search engine ranking report that focuses solely on "ten blue links" overlooks a significant portion of the search landscape. Local pack presence, map results, and review-driven ranking factors operate alongside traditional organic positions and contribute to revenue. Ignoring these elements understates the impact of visibility efforts.
Empirical evidence supports the link between reputation and revenue. A study using Yelp data found that a one-star increase in Yelp rating led to a 5 to 9 percent revenue increase, particularly for independent restaurants 6, 7. While the exact percentage may not generalize to all verticals, this study defensibly establishes a directional link between rating movement and revenue. This justifies including review acquisition and response cadence in the same report as position tracking for local businesses.
Three additions integrate local signals without overstating their impact:
- local pack position by geo-modified query (reported alongside organic position for comparison),
- review velocity, average rating, and response rate per location (linked to client booking or call data), and
- a per-location view for multi-site clients to identify underperformers.
These elements provide a more complete picture of local search performance.
A Report Structure That Survives a CFO Review
A defensible reporting deck follows a fixed order and maintains a clear evidence trail, which finance reviewers scrutinize when narratives appear overly optimistic. The structure aligns with the three-layer stack previously discussed.
The initial page defines the scope: reporting window, attribution method, measured query set, and any significant changes in paid spend. The second page covers the visibility layer, presenting position by cluster, impressions, and CTR by position band, sourced from Search Console for organic and ads platforms for paid overlap. The third page details the pipeline, including organic-sourced conversions, separately reported assisted conversions, and lead-quality dispositions from the client's CRM.
The fourth page presents unit economics: fully loaded organic CPL, paid CPL for comparable queries as a benchmark, revenue per ranked cluster, and a rolling twelve-month trend. The fifth page reconciles modeled revenue against actual CRM-attributed revenue, explaining any discrepancies. This reconciliation is crucial as substantiation standards require modeled figures to be labeled with their input assumptions, not presented as measured outcomes 9, 10.
The final page is the exception log, detailing clusters that lost position and why, conversions untraceable to specific queries due to withheld search term data, and movements influenced by paid substitution rather than organic performance. This log transforms a ranking report into a document a CFO can confidently approve.
Frequently Asked Questions
References
- 1.Search engine performance optimization: methods and metrics.
- 2.Sponsored Search in Equilibrium: Evidence from Two Experiments.
- 3.Analyzing the Relationship Between Organic and Sponsored Search Advertising.
- 4.An Empirical Analysis of Keyword Advertising: sponsored search in electronic markets.
- 5.Comparing Performance Metrics in Organic Search with Sponsored Search.
- 6.Reviews, Reputation, and Revenue: The Case of Yelp.com.
- 7.The Yelp Factor: Are Consumer Reviews Good for Business?.
- 8.Crowdsourced reviews.
- 9.Advertising and Marketing.
- 10.Online Advertising and Marketing.