
Key Takeaways
- Treat rank tracking as a triage sensor rather than a client deliverable, using position deltas to filter noise before routing candidates to Search Console segmentation and external volatility checks.
- Movement alone is not a signal during update windows, where 83.1% of top-10 positions shifted in one 100,000-keyword sample 9; direction, duration, and concentration determine severity.
- Anchor triage tiers to Google's own scale: a position 2 to 4 drop stays in monitor, while a position 4 to 29 drop moves to investigate, and wait a full week post-update before acting 3.
- Extend coverage to hourly performance data, AI Overviews impressions, and Search Console Insights, since classic blue-link tracking no longer captures the full visibility picture 5, 6, 7.
The Diagnostic Case Against Weekly Rank Reports
Most agencies still treat rank tracking as a client deliverable: a Monday screenshot, a color-coded spreadsheet, a quarterly review slide. That framing wastes the instrument. Position data, when sampled at the right cadence and read against the right controls, is the earliest available signal that something has changed on a client's site, in the SERP itself, or in how Google is interpreting the query. It arrives days before organic sessions dip in analytics and weeks before a client emails asking why leads are down.
The academic literature is direct on the point. Search engine volatility is a structural property of commercial engines, not a bug in the tracker, and the same query returns different documents at different times as a matter of course 1. Location and time account for the largest share of that variance, which means a rank change observed in isolation is closer to weather than to diagnosis 2. A weekly report that lists positions without segmenting for those factors is not a signal system. It is a record of noise.
The operational question for a Head of SEO running a portfolio is narrower and more useful: which movements this morning warrant an analyst's time, and which are the SERP breathing? Google's own debugging guidance answers that question by segment, not by snapshot, walking practitioners through query, URL, country, device, and appearance before assigning cause 4. The rest of this piece builds the triage layer that sits on top of that guidance.
Why Stable Rankings Are a Myth Worth Retiring
The premise behind most client-facing rank reports is that top-10 positions are an achievement to defend and that movement inside that band is unusual. Update-window data contradicts both assumptions. Across a 100,000-keyword sample studied during a recent core update, 66.8% of top-3 positions changed, 83.1% of top-10 positions shifted, and roughly 15% of pages that had been in the top 10 dropped out of the top 100 entirely 9. Those are not fringe queries. They are the same competitive terms agencies pin to client dashboards.
Read carefully, the numbers reframe what an alert should mean. If four out of five top-10 slots move during a rollout, a single client falling from position 3 to position 5 on a tracked keyword is closer to the baseline than to an anomaly. The signal is not the movement itself. It is the direction, the duration, and whether the same movement is happening across the reference set of unrelated domains a Head of SEO tracks for exactly this purpose.
Two structural properties of the SERP compound the point. Volatility is a documented feature of commercial search engines, not a symptom of a broken tracker, and the same query returns different documents at different times as normal behavior 1. Location and time explain the largest share of that variance, which is why a rank sampled once, from one data center, on one afternoon, is a snapshot that no experienced operator should treat as a trend 2.
The operational consequence is straightforward. Alert thresholds set on absolute position ("notify me if any keyword drops") will fire constantly during update windows and drown the queue that matters. Thresholds tied to sustained movement across segmented samples will not. The next section builds the layered signal model that produces the second kind of alert.
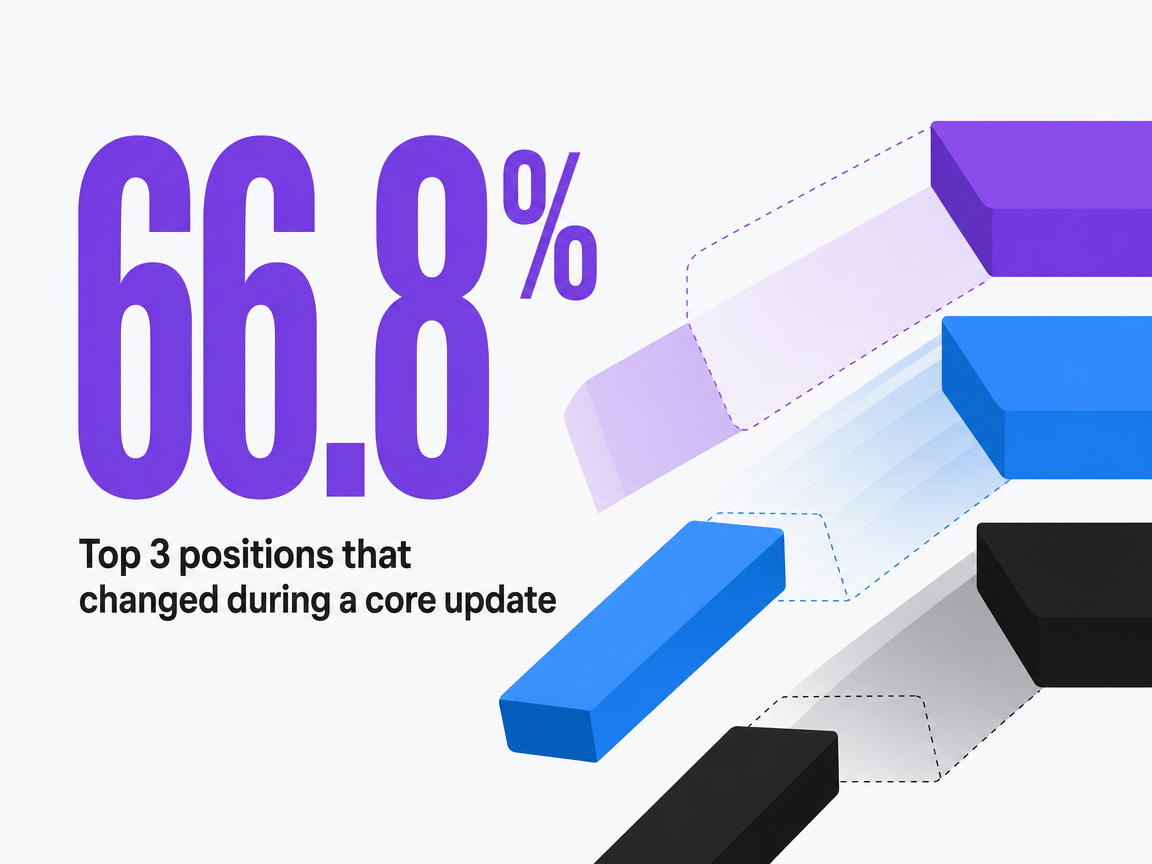 Top 3 positions that changed during a core update
Top 3 positions that changed during a core update
A Three-Layer Signal Model for Portfolio Monitoring
Layer 1: Position Deltas as the Coarse Filter
The first layer of the sensor network is the one most agencies already own and most agencies misuse. Position deltas from a rank tracker are best treated as a coarse filter: a mechanism for narrowing a portfolio of thousands of tracked keywords down to a working set of candidates that might warrant a second look. The filter's job is not to identify problems. It is to reject the majority of movement as within-range and route the residue upward.
Two design choices determine whether the filter works. The first is sampling. A single daily snapshot from one data center invites the exact volatility the volatility literature documents, where the same query returns different documents at different times and where location and time drive the largest share of variance 1, 2. Rank samples pulled from multiple locations, averaged across two or three consecutive days, and compared against a rolling seven or fourteen day baseline suppress most of that noise before an alert is ever generated.
The second is threshold design. Absolute position triggers ("alert on any drop") are useless during update windows. Delta triggers tied to sustained movement outside a keyword's own historical variance band are not. Group tracked terms by commercial value tier so the filter surfaces a position 3 to 6 drop on a money keyword ahead of a position 42 to 48 drop on a supporting term. Everything that clears the filter goes to Layer 2 for cause isolation, not to a client email.
Layer 2: GSC Segmentation for Cause Isolation
Once a candidate movement clears the coarse filter, the diagnostic work happens in Search Console. Layer 2 exists to answer a single question: is the change concentrated in a way that points to a specific cause, or is it distributed in a way that suggests broader ecosystem behavior? Google's own debugging workflow structures that inquiry by walking through the Performance report and segmenting by query, URL, country, device, and search appearance before assigning cause 4. The recommended comparisons are period over period and year over year, not raw week snapshots.
The segmentation dimensions do the diagnostic lifting:
- A drop that concentrates on a single URL cluster while sibling pages hold steady points toward a page-level content or technical issue.
- A drop that concentrates on mobile while desktop is flat points toward a rendering or Core Web Vitals problem.
- A drop that concentrates in one country while other markets are stable points toward a hreflang, localization, or SERP feature change rather than a site-wide algorithmic hit.
- A drop that spreads evenly across all five dimensions is the signature of an ecosystem event, and the correct response is to hold action and consult Layer 3.
Impression and CTR data belong in this layer too. A page that lost position but held impressions has usually surrendered a SERP feature or lost a snippet rather than lost relevance. A page that held position but lost impressions is watching demand contract, not visibility. A page that lost both is the only one that needs an urgent content review. Google's guidance is explicit about waiting for a sustained pattern rather than reacting to the first data point, particularly during update rollouts where early turbulence is not predictive of the final state 3. Layer 2 is where that discipline gets enforced.
Layer 3: External Volatility Indices as the Context Check
The third layer is the one that keeps agencies from burning analyst hours on problems that do not exist. External volatility indices from Semrush, Wincher, Zutrix, and similar sensors sit outside the client portfolio and read the SERP itself. Their function in the signal model is contextual: they tell an operator whether the movement flagged at Layer 1 and isolated at Layer 2 is happening inside a broader turbulence event. During the February 2026 Google Discover Core Update, for instance, multiple volatility tools registered elevated readings across the entire rollout window from February 5 through February 27, giving practitioners an external reference for interpreting site-specific anomalies during that period 8.
The rule of use is disciplined. If Layer 2 shows a movement distributed across queries, URLs, devices, and countries, and Layer 3 shows sensors lit up across multiple third-party trackers, the working hypothesis is ecosystem, not site. The correct response is to log the event, hold remediation, and wait for the pattern to stabilize before acting. If Layer 2 shows concentration on specific pages or segments and Layer 3 shows a quiet ecosystem, the working hypothesis is site-specific, and the account moves into diagnostic queue regardless of the calendar.
Volatility indices are context, not evidence. They confirm or deny the environment in which a signal appeared. Treating them as either an all-clear or an alarm collapses the model back into single-source reporting, which is what the three-layer stack exists to replace.
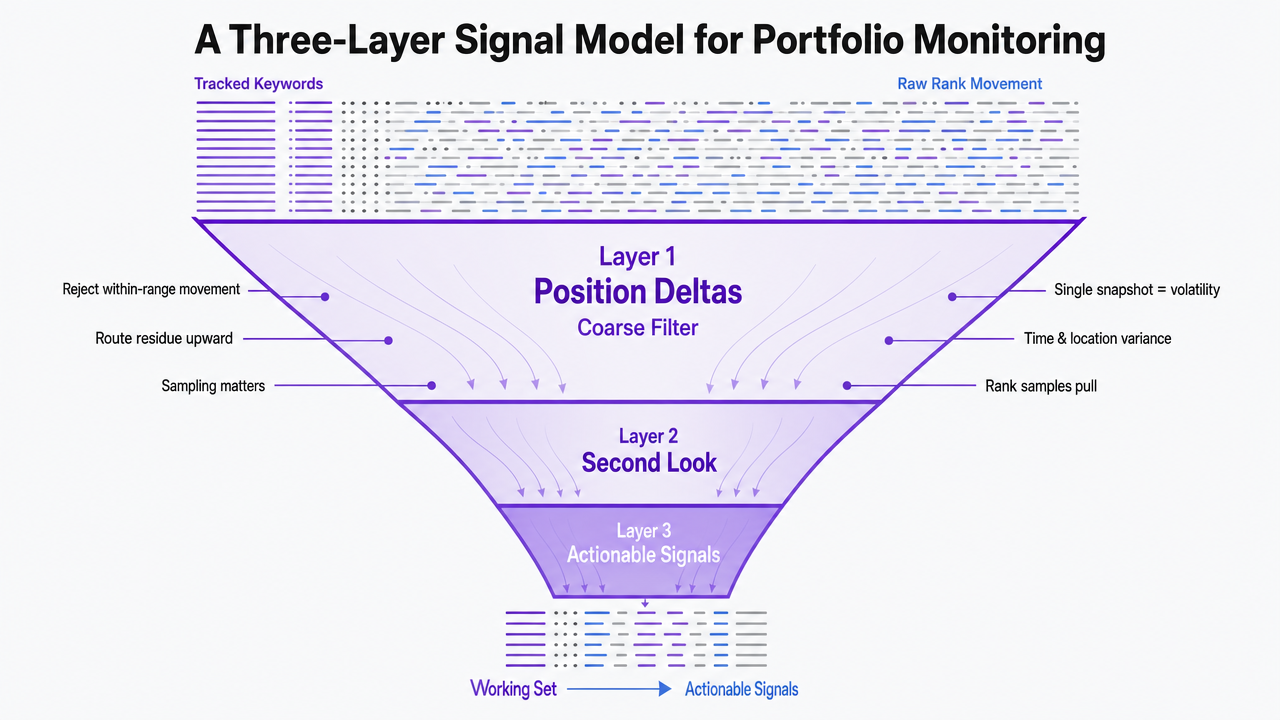 Visualize the three-layer signal model as a funnel showing how raw rank movement is filtered into actionable signals
Detect SERP Shifts Before Rankings Slip Further
Spot ranking drops instantly and take corrective action before organic traffic is impacted.
The Triage Framework: What to Investigate This Week
A working triage framework converts the three-layer signal model into a Monday queue with three states: monitor, investigate, escalate. Google's own core update guidance supplies the anchor. A drop from position 2 to position 4 is, in Google's language, a small movement that usually does not warrant drastic action, while a drop from position 4 to position 29 is a large movement that should trigger deeper assessment 3. Those two examples define the endpoints of a usable severity scale.
Monitor covers movements of roughly one to three positions inside a stable band, sustained for fewer than seven days, with no concentration signal in Layer 2 and elevated readings in Layer 3. The instruction is to log, tag, and wait. Google is explicit that at least a full week should pass after a core update completes before performance is analyzed, because early turbulence during rollouts is not predictive of the final state 3. Analyst time spent on monitor-tier movement during an active update window is time subtracted from accounts that have crossed a real threshold.
Investigate covers larger position changes, on the order of Google's four-to-twenty-nine example, or smaller movements that have persisted past the seven-day post-update window, or any movement where Layer 2 shows concentration on a single URL cluster, device class, or country. The analyst opens Search Console, runs the period-over-period comparison Google's debugging guidance prescribes, and works through query, URL, country, device, and appearance segmentation before forming a hypothesis 4. The output of this tier is a diagnosed cause, not a fix.
Escalate covers confirmed drops on commercially critical terms where Layer 2 has already isolated a specific cause, where impressions and clicks are moving together in the wrong direction, or where a page has dropped out of the top 20 on a money keyword. This is the tier that consumes senior time and, if warranted, triggers a client conversation before the client initiates one.
The framework's discipline is in what it refuses to escalate. A dental client sliding from position 3 to position 4 for a competitive local term during a documented volatility event stays in monitor, not investigate, until the update completes and the pattern holds. A home services page that falls from position 4 to position 22 for a service keyword during a quiet Layer 3 week goes straight to investigate, regardless of the calendar. The severity assignment is a function of magnitude, duration, concentration, and context, not of which client emails first.
Diagnosing a Confirmed Drop Without Guessing at Content
Once triage has moved an account into the investigate tier, the failure mode to avoid is jumping to a content rewrite. Most confirmed drops are not content problems. They are indexing, rendering, feature-loss, or demand problems wearing content-drop clothing, and the diagnostic sequence has to eliminate the cheaper causes first.
Google's traffic-drop workflow prescribes the order. Open the Performance report, click Average position, compare period over period and year over year, then segment the same delta by query, URL, country, device, and search appearance before forming a hypothesis about cause 4. The segmentation is the diagnosis. A page holding position but shedding impressions is losing a SERP feature or watching query demand contract, not losing relevance. A page holding impressions but shedding clicks has usually surrendered a rich result or been pushed below a new AI feature. Only a page shedding position, impressions, and clicks in the same direction earns a content review.
Technical causes get ruled out next. Coverage report, recent deployments, robots changes, hreflang, canonical drift, and Core Web Vitals status all sit upstream of any content hypothesis. Google's own guidance flags algorithmic updates, technical issues, security, spam, and shifts in user interest as the candidate cause set, and recommends Google Trends as the check for the last one before assuming site fault 4. A query whose global interest curve is falling explains a drop that no rewrite will reverse.
The analyst's output at the end of this sequence is a diagnosed cause with the evidence attached: which segment concentrated the loss, which upstream check confirmed or eliminated a technical trigger, and whether the query itself is still being asked. That artifact is what routes the account to remediation, to a client conversation, or back to monitor. Guessing at content skips the work that makes the fix defensible.
New Surface Area: Hourly Data, AI Overviews, and Insights
The instruments have changed enough in the last two years that any triage model built before 2024 is running on stale assumptions. Three Search Console developments in particular reshape where the sensor network needs coverage.
Hourly performance data is the first. Google rolled out a 24-hour view for the Search Console performance reports with only a few hours of delay, exposing clicks, impressions, CTR, and average position at hourly granularity across Search, Discover, and Google News 5. That collapses the detection window from days to hours for anything catastrophic, such as a deployment that blocks indexing or a robots.txt change that empties the index. It does not, however, change the guidance on interpretation. Hourly data invites the same volatility problem the sampling literature warns against, only compressed 1. The correct use is exception monitoring on a small set of critical URLs, not hourly dashboards for a portfolio.
The second is generative surface coverage. Google's performance reports now include dedicated views of impressions inside AI Overviews, AI Mode, and generative elements in Discover, with breakdowns by page, country, device, and date 6. Classic blue-link rank tracking no longer covers the full visibility picture, and a page holding position while shedding impressions may be losing citation share inside an AI feature rather than losing relevance.
The third is Search Console Insights, which surfaces trending clicks, impressions, top queries, and top pages against the prior period in one view 7. Its role in the stack is a portfolio-level exception feed that routes to Layer 2, not a replacement for it.
See Search Rank Drops Before They Impact Client KPIs
Request a demo to learn how real-time rank tracking and automated alerts help agencies identify and act on search volatility before it affects client pipeline or revenue.
If You Manage Multiple Client Portfolios: Triage Economics at Scale
The framework so far assumes a single account. The math changes when a Head of SEO owns 40 or 80 or 120 of them. At that scale, the question stops being how to diagnose a drop and becomes which drops earn the analyst hours available on any given Monday. Ecosystem events force the issue: during the March 2026 core update, 55% of tracked sites across Ahrefs and Semrush datasets registered measurable ranking changes within two weeks of the rollout, with heavily affected sites seeing 20–35% traffic drops 10. A portfolio operator whose review process treats every account the same way runs out of hours before the update finishes rolling.
The comparison below holds time-per-account and review frequency constant to show where manual review breaks. Time-per-account is an assumption, not a benchmark, and should be replaced with each team's own measured average.
| Portfolio size | Manual weekly review (45 min/account) | Signal-triggered review (10–15% of accounts clear the filter) |
|---|---|---|
| 10 accounts | 7.5 analyst-hours/week | ~1 analyst-hour/week |
| 25 accounts | 18.75 analyst-hours/week | ~2.5 analyst-hours/week |
| 50 accounts | 37.5 analyst-hours/week | ~5 analyst-hours/week |
| 100 accounts | 75 analyst-hours/week | ~10 analyst-hours/week |
The signal-triggered column assumes the Layer 1 coarse filter and Layer 3 context check together reject roughly 85–90% of raw movement as within-range or ecosystem-attributable, leaving a working queue that scales with actual incidents rather than account count. The exact rejection rate varies with keyword mix and update cadence, but the shape is the point: manual review is linear in portfolio size, and triage review is closer to linear in the number of real incidents.
Two operational consequences follow. Senior analyst time gets spent on the investigate and escalate tiers rather than on filter work an alerting layer can do overnight. And during weeks like March 2026, when more than half the portfolio moves at once, the triage stack absorbs the wave without forcing a hiring conversation or a slipped SLA.
Wiring the Sensor System Into a Monday-Morning Routine
The framework only pays off if it becomes a habit. A workable Monday routine for a Head of SEO running a portfolio starts before the browser opens: an overnight job pulls Layer 1 deltas, flags every keyword outside its rolling variance band, and groups the residue by account and commercial tier. The queue that greets the analyst is already filtered, already sorted, and already excludes movement that expired inside the seven-day observation window Google prescribes after a core update completes 3.
The first thirty minutes belong to Layer 3. A quick read of external volatility indices establishes whether the day's queue is riding an ecosystem event or a quiet SERP 8. That single check reassigns severity across the entire list before any account is opened. The next block is Layer 2 work inside Search Console: period-over-period comparisons segmented by query, URL, country, device, and appearance for every account that survived the filter 4. Search Console Insights runs alongside as a portfolio-level exception feed, catching accounts whose clicks or impressions trend flagged before rankings did 7.
By late morning, the queue has resolved into three lists: accounts to log, accounts in diagnostic work, and accounts that have crossed into a client conversation. That output, produced weekly against the same signal model, is what converts rank tracking from a report into an operating instrument.
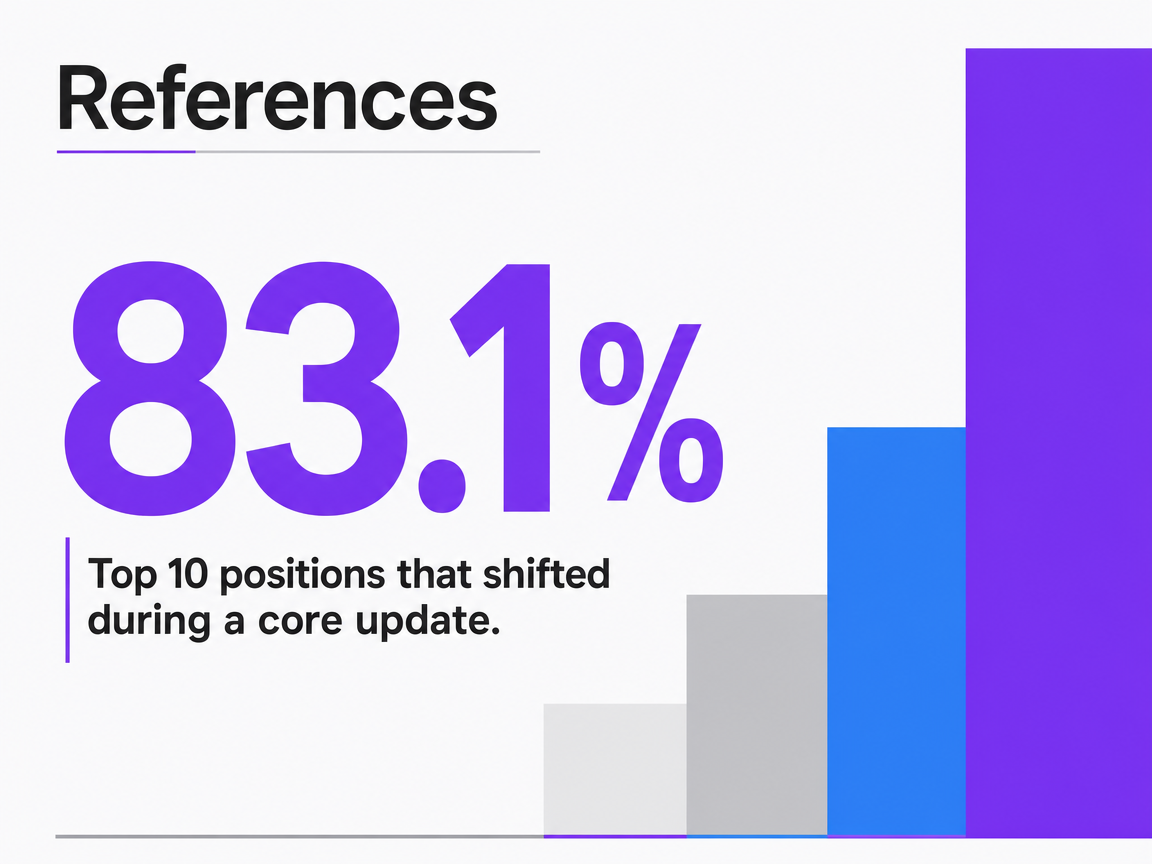 Top 10 positions that shifted during a core update
Top 10 positions that shifted during a core update
Frequently Asked Questions
References
- 1.On the Volatility of Commercial Search Engines and its Impact on the Evaluation of Retrieval Systems.
- 2.Measuring Web Search Engine Volatility (Faculdade de Engenharia da Universidade do Porto).
- 3.Google Search's Core Updates.
- 4.Debug Google Search Traffic Drops.
- 5.An improved way to view your recent performance data in Search Console.
- 6.Introducing Search Generative AI performance reports in Search Console.
- 7.The new Search Console Insights report is here.
- 8.Google Search Ranking Volatility Heated Into March.
- 9.SERP Volatility Tracker 2026: How Stable Are Rankings?.
- 10.Google March 2026 Core Update: Impact and Recovery Guide.