
Key Takeaways
- Blog SEO underperformance is usually a measurement problem, not a content problem — first-touch attribution and traffic dashboards hide the pipeline contribution leadership actually wants to see 2.
- Replace the traffic scorecard with a pipeline-linked sequence — Visibility through Revenue — and tier every URL as ICP-fit, educational, or awareness with one KPI per tier 6, 7.
- Report organic-sourced and organic-influenced pipeline side by side, backed by GA4 key events, hidden form fields, and a touch-history field written onto the opportunity record 9, 7.
- Fix instrumentation before increasing production: retag the library, wire CRM handoffs, and prioritize the editorial calendar from the top URLs on the influenced-pipeline ranking 8.
The measurement problem behind every underperforming blog program
A content manager can rank on page one for a hundred commercial keywords and still walk into a QBR unable to name the pipeline dollars those posts produced last quarter. The gap is rarely a content quality problem. It is a measurement problem, and it starts with the dashboard on the wall.
Most blog SEO reporting stacks were built when the goal was traffic. Sessions, keyword positions, bounce rate, average time on page. These metrics answer a question executives no longer ask. HubSpot's 2024 survey work shows a growing share of marketers now rank increasing revenue and generating qualified leads as their top content goals, above traffic or brand awareness 2. The reporting has not caught up with the mandate.
The underperformance is often an illusion created by first-touch attribution. When a blog post is credited only for the visits that convert on the same session, the program looks anemic. B2B buyers rarely convert on the first read of an educational post. They return, subscribe, read three more pieces, and eventually fill out a demo form from a branded search weeks later. That last click is what the dashboard sees.
The result is a familiar loop: leadership sees flat pipeline attribution, cuts the content budget, and the team is asked to prove ROI with the same instruments that hid it in the first place. The way out is not more posts. It is a different measurement model, one that treats the blog as a pipeline system with defined stages, CRM handoffs, and KPIs the finance team can read 1.
The pipeline-linked metric sequence that replaces the traffic dashboard
The operating model that turns a blog into a pipeline system is a sequence, not a scorecard. Content managers who want predictable revenue contribution from SEO for blog posts can borrow a specific eight-stage flow used in pipeline-focused SEO frameworks: Visibility → Intent → Engagement → Action → Account → Opportunity → Pipeline → Revenue 6. Each stage has a defined KPI, a defined data source, and a defined handoff. The sequence is the spine of the reporting.
Visibility is qualified organic visibility, not total impressions. It measures rankings and impressions on the queries that match ICP intent, filtered against a keyword list the content team maintains. Intent captures high-intent sessions: users who arrive on commercial or comparison content, or who trigger scroll depth and internal navigation patterns associated with buying research. Engagement records on-page behavior tied to conversion probability, such as returning sessions, resource downloads, and video completions.
Action is the first CRM-visible event. A form submission, a demo request, a trial signup, a chat handoff. This is where GA4 conversion events meet the CRM record, and where the blog stops being a marketing asset and becomes a pipeline input 3. Account layers in firmographic enrichment: does the lead match the ICP, and does it belong to a target account already in the pipeline? Opportunity is the moment sales creates a deal record tied back to the originating content touch.
Pipeline is the dollar value of open opportunities influenced by organic content, and Revenue is closed-won attributed to those touches 6. The two are reported separately. Pipeline is the leading indicator content managers can move quarter to quarter; revenue is the trailing confirmation that finance reads.
The value of the sequence is not that it is novel. It is that each stage forces a specific instrumentation decision. A team cannot report on Account without CRM enrichment. It cannot report on Opportunity without closed-loop attribution. Building the reporting exposes the gaps in the data stack, which is usually where the blog program is actually stuck. Once the sequence is wired, the traffic dashboard can be retired and every KPI on the new dashboard maps to a specific stage a CFO already understands.
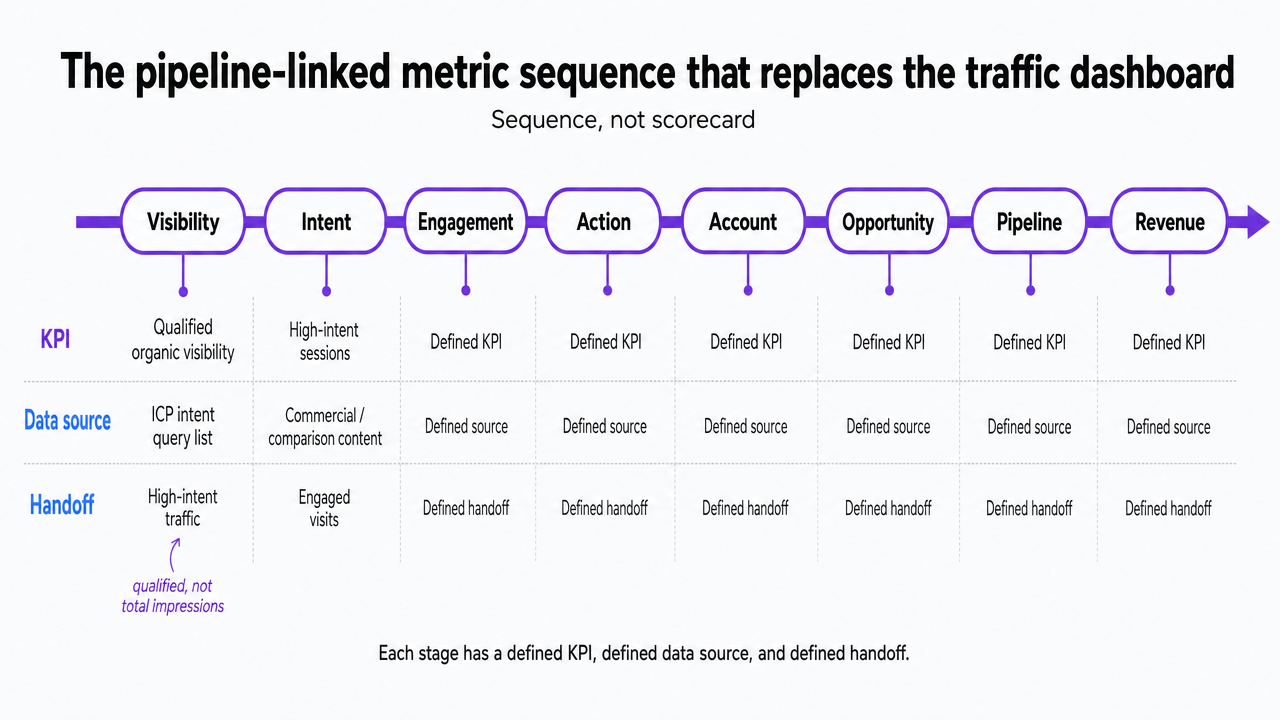 Visualize the eight-stage pipeline-linked sequence cited from ref_6, which is the operational spine of the section and article
Tiering blog content by ICP fit, not by topic cluster
Topic clusters are a production convenience. They help writers plan and interlink. They are the wrong unit for pipeline reporting. A cluster on a hot keyword can produce ten thousand sessions a month and zero opportunities, while a single comparison post read by fifty accounts a quarter can influence half the pipeline. Reporting sessions at the cluster level hides that difference.
A more useful classification sorts every blog URL into three tiers based on how close the reader is to a buying decision: ICP-fit, educational, and awareness 7. ICP-fit content targets commercial and comparison queries the buying committee runs when a purchase is on the table. Educational content answers the operational questions that decision-makers and their teams research once a problem is defined but before a solution is scoped. Awareness content sits at the top, targeting broad queries that pull in a mix of buyers, students, and adjacent roles.
Each tier gets one primary KPI, and only one.
- ICP-fit content is measured on pipeline influence, defined as the sum of opportunity value where an ICP-fit URL appears in the contact's touch history within the attribution window 7.
- Educational content is measured on MQL conversion rate: the percentage of organic sessions on that tier that produce a lifecycle-stage change to MQL within a defined window.
- Awareness content is measured on qualified organic visibility, meaning impressions and rankings on the keyword list the content team has validated as ICP-adjacent, not raw impression totals.
The point of the one-KPI-per-tier rule is scope discipline. When a VP asks why awareness traffic is flat, the answer is not that pipeline is down. When pipeline slips, the diagnosis moves straight to the ICP-fit tier and the CRM handoffs behind it. Content teams that report aggregate organic sessions cannot make that call, because the tiers are averaged into one number that moves for reasons no one can trace.
Retagging an existing library into these three tiers usually takes a content manager one working week. It requires a spreadsheet of URLs, an ICP definition the sales team agrees to, and a shared CRM field to store the tier on the contact record. That single week of classification work is what makes every downstream pipeline query possible.
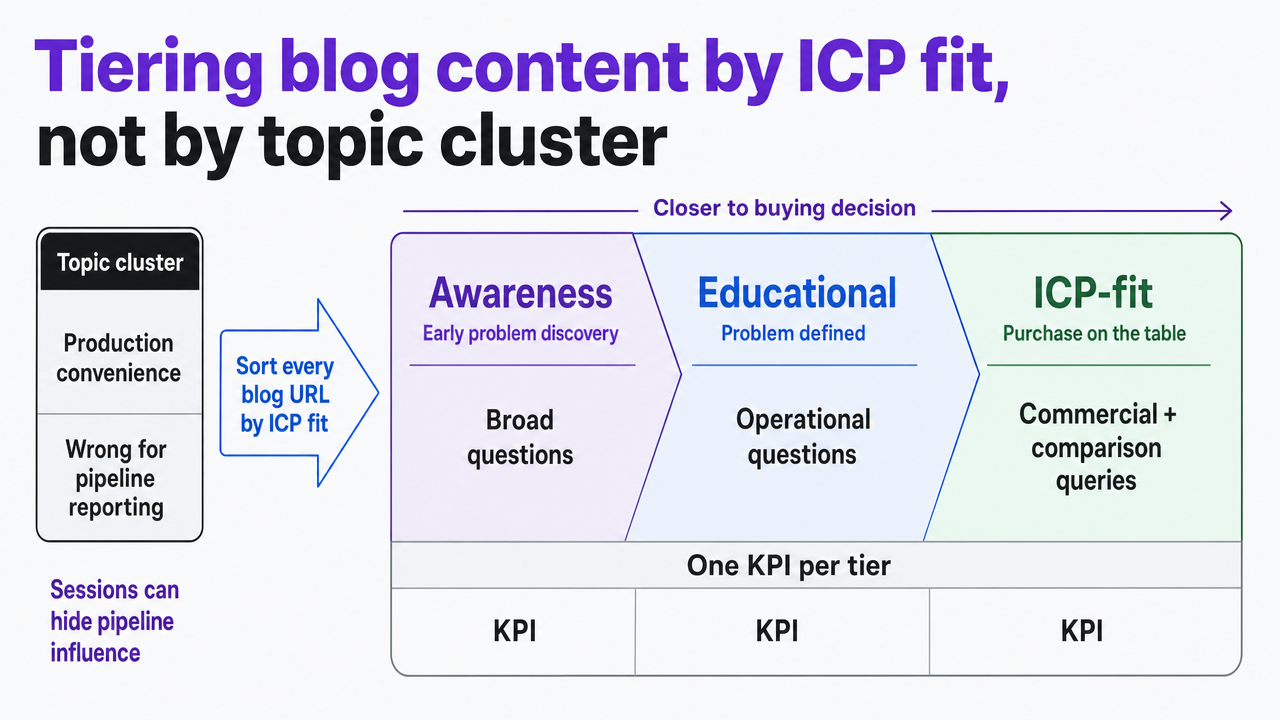 Visualize the three-tier content classification and the one-KPI-per-tier rule described directly in the section from ref_7
Test Predictable SEO Blog Workflows Yourself This Week
See how streamlined SEO blog execution drives measurable pipeline impact before you commit.
Organic-sourced vs. organic-influenced pipeline: the reporting split most programs miss
Most blog SEO reports show one number for pipeline: the deals where an organic session was the first-touch source. That number is almost always wrong in the direction of too small.
The distinction that fixes this is between organic-sourced pipeline and organic-influenced pipeline. Organic-sourced counts opportunities whose originating contact record lists an organic session as the first-touch source, captured through hidden form fields at the moment of conversion 9. Organic-influenced counts every open opportunity where at least one organic session appears anywhere in the contact's touch history within the attribution window, regardless of whether it was first or last 7.
The gap between the two is where blog programs live. A B2B SaaS playbook on MQL-to-pipeline attribution reports that organic-influenced pipeline is typically three to five times larger than first-touch pipeline for programs that instrument multi-touch tracking 8. That range comes from B2B SaaS teams running dedicated multi-touch attribution on organic content, so the multiplier will vary in other verticals and with different attribution windows. But the directional finding is stable: reporting only first-touch understates the blog's contribution by a wide margin.
The practical consequence for content managers is a reporting split, not a replacement. Organic-sourced belongs on the dashboard because finance recognizes it and it moves with new demand generation. Organic-influenced belongs next to it because it is what the blog actually does: it warms accounts, re-engages stalled deals, and sits in the middle of the touch history of opportunities that closed from paid or sales-led sources.
Content managers who run only one number lose the argument twice. When first-touch is flat, the blog looks stalled. When paid channels take credit for closed-won deals that had six organic touches in the middle, the blog looks irrelevant. Reporting both, side by side, makes the middle of the funnel visible and gives the content team a defensible answer when leadership asks what the program produced.
Building the split requires two CRM fields on the contact record: a first-touch source populated once and never overwritten, and a touch-history array that appends every organic session URL. The reporting queries then diverge cleanly. Neither number is the truth on its own. The pair is.
Wiring GA4 events to CRM lifecycle stages
The reporting split described above only works if the underlying instrumentation exists. That means a specific chain of events, hidden fields, and CRM writes that fires the moment an organic visitor takes an action on a blog post. Most programs have the first link in the chain and none of the rest.
- The chain starts in GA4. Every action a content team wants to count as a conversion has to be configured as a key event: form_submit, demo_request, trial_signup, resource_download, chat_open. Marking an event as a conversion is what makes it available in attribution reports and downstream analyses 3. Configuration is not optional. An event that fires but is not marked as a conversion cannot be reported against the content that drove it.
- The second link is the form itself. Hidden fields on every blog form capture the data the CRM needs to reconstruct the visit: the landing page URL, the referring source, the utm parameters if present, and the GA4 client_id. Those fields are written into the contact record on submission 9. Without them, the CRM sees a lead with no memory of the blog post that produced it.
- The third link is the lifecycle stage assignment. When the contact is created, the CRM sets an initial stage — typically Lead or Subscriber — and writes the originating content URL into a first-touch field that is never overwritten. When the contact returns and engages with more content, a separate touch-history field appends each new organic session URL. Marketing operations then defines the rules that move the contact from Lead to MQL to SQL based on scoring criteria the sales team has signed off on.
- The fourth link is the opportunity write-back. When sales creates a deal record, the CRM copies the contact's first-touch source and touch history onto the opportunity object. Reporting then queries opportunities directly and can answer two questions cleanly: which opportunities were sourced by organic, and which opportunities had any organic touch in their history 9. That mapping is what makes content-to-pipeline reporting possible at the URL level rather than the channel level.
Two failure modes are common:
- A form that fires the GA4 event but does not populate the hidden fields, which leaves the CRM blind.
- A lifecycle-stage automation that overwrites the first-touch source when a contact re-converts, which erases the blog's role in the record.
Both are fixable in an afternoon once identified, and both are worth auditing before any new dashboard work begins.
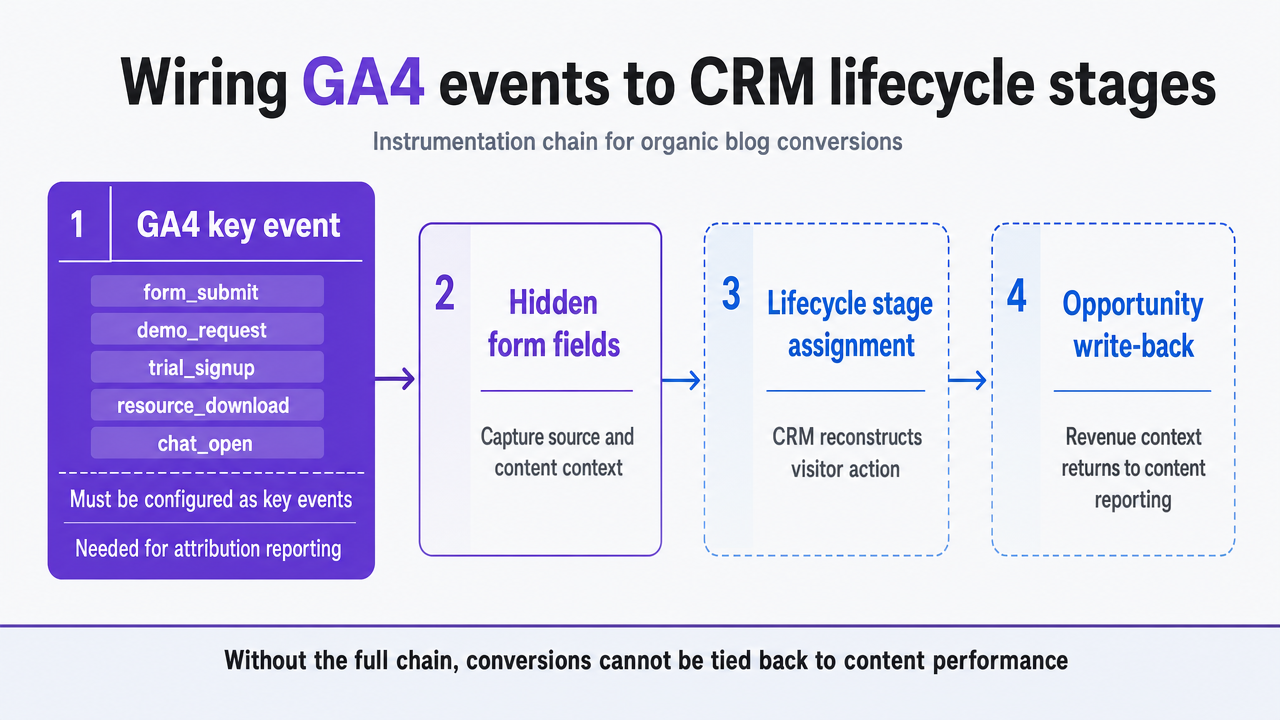 Show the four-link instrumentation chain described in the section (GA4 key event → hidden form fields → lifecycle stage assignment → opportunity write-back), which is a process workflow directly cited from ref_3 and ref_9
The dashboard a content manager can defend in a QBR
A defensible dashboard fits on one screen and answers three questions a CFO or VP of Sales will actually ask: how much pipeline did organic content produce, how much pipeline did it touch, and which URLs are doing the work. Everything else belongs in a secondary tab.
The top row carries the money metrics. Organic-sourced pipeline value, expressed in dollars of open opportunities where organic is the first-touch source. Organic-sourced revenue, closed-won attributed to those same first-touch records 9. Organic-influenced pipeline, the dollar value of open opportunities with at least one organic session in the touch history 7. These three numbers are the ones leadership will remember after the meeting.
The second row translates money into motion. MQL conversion rate on organic sessions, filtered to the educational and ICP-fit tiers. Traffic-to-lead ratio on ICP-fit content specifically, which isolates the conversion economics of the pages meant to close 5. Sales acceptance rate on organic MQLs, the percentage sales agrees to work, which is the single best signal of lead quality that a content team can move 11.
The third row is content-to-pipeline mapping: a ranked table of the top ten URLs by influenced pipeline dollars, with tier and publish date attached 8. This is the row that ends the debate about which posts to update, retire, or expand. When a comparison post from eighteen months ago sits at the top of the influenced-pipeline list, the roadmap writes itself.
What stays off the main view is as important as what goes on it. Sessions, keyword rankings, and time on page belong on a secondary diagnostic tab, not the executive read 11. They explain movement in the money metrics; they do not replace them. A dashboard that leads with sessions invites a conversation about traffic. A dashboard that leads with dollars invites a conversation about budget.
See How Enterprise Teams Operationalize SEO Blog Content Into Qualified Pipeline
Request a walkthrough of unified workflows that connect SEO-driven blog production directly to measurable pipeline growth—without adding headcount or slowing approvals. Ideal for agencies and enterprise content teams focused on predictable, ROI-driven outcomes.
Production ceiling vs. instrumentation: where the next unit of pipeline actually comes from
Content managers under quarterly pressure default to the same lever: publish more. Add two posts a month, hire a freelancer, spin up a second cluster. The math looks obvious until the CRM data comes back. A program publishing eight posts a month at a two percent organic conversion rate and a fifteen thousand dollar average opportunity value produces a knowable amount of pipeline. Doubling to sixteen posts, at the same conversion rate and the same tier mix, roughly doubles it. That is the production-ceiling model, and it assumes the instrumentation is already extracting every dollar the current library can produce.
It almost never is. A more useful exercise starts with three variables the content manager already has: monthly organic sessions on ICP-fit content, the current traffic-to-lead ratio on that tier, and the average opportunity value from sales 5. Multiply them and the result is organic-sourced pipeline. Then run the query for organic-influenced pipeline using the touch-history field on the opportunity object 7. The gap between the two numbers is the pipeline the program is producing but not reporting.
Closing that gap does not require new posts. It requires retagging the library into the three tiers, wiring the hidden fields on existing forms, fixing the lifecycle automation that overwrites first-touch, and adding the touch-history query to the dashboard 9. Those four fixes usually take a content ops resource two to three weeks. The pipeline that surfaces was there the whole time.
Only after the instrumentation is complete does incremental production become the right lever. New posts against a properly instrumented library compound: each ICP-fit piece enters the touch history of accounts already being warmed by the existing library, and the influenced-pipeline number moves faster than the sourced number. Publishing into a broken measurement stack, by contrast, adds cost without adding visible pipeline, which is the pattern that gets content budgets cut.
The sequence matters. Instrumentation first, then production. Content teams operating without headcount to spare get more pipeline from the second week of retagging than from the second freelancer, and the retagging keeps paying every quarter after.
Attribution under AI search and privacy constraints
The measurement model above rests on two assumptions that are eroding at the same time: that most organic sessions leave a traceable referrer, and that most visitors consent to the tracking that populates the touch history. Neither holds as cleanly as it did three years ago.
AI-mediated search surfaces — answer boxes, chat interfaces, and summarization layers — resolve buyer questions without a click, and when a click does happen the referrer often arrives stripped or generic. Combined with consent-mode drops and cross-domain tracking limits, this shifts a meaningful share of organic touches into an unattributed bucket that traditional analytics under-reports or misassigns 10.
Content managers should treat this as a design constraint, not a crisis. Three adjustments hold up:
- Widen the attribution window on the touch-history field so slower, fragmented journeys still resolve to the correct opportunity 1.
- Add a self-reported source field to high-intent forms — a single "how did you hear about us" question — and reconcile it against captured referrer data in the CRM.
- Report a known dark-traffic percentage alongside organic-sourced pipeline, so leadership sees the size of the unattributed segment rather than assuming it is zero.
The pipeline number does not have to be perfect to be defensible. It has to be consistent, scoped, and honest about what the instrumentation can and cannot see.
A 90-day sequence for rebuilding blog SEO around pipeline
Rebuilding a blog program around pipeline is a scheduling problem more than a strategy problem. The work fits inside a quarter if it runs in the right order.
- Days 1–30: instrument. Audit GA4 key events and confirm each conversion action is marked and firing 3. Add hidden fields to every blog form for landing page URL, referrer, and client_id 9. Fix any lifecycle automation that overwrites first-touch source on re-conversion. Add a touch-history field to the contact and opportunity objects in the CRM.
- Days 31–60: classify and query. Retag the URL library into ICP-fit, educational, and awareness tiers, and store the tier on the contact record 7. Write the two pipeline queries — organic-sourced and organic-influenced — and validate them against a known closed-won deal. Stand up the one-screen dashboard with money metrics on top, conversion economics in the middle, and the top-ten URL table at the bottom 11.
- Days 61–90: report and prioritize. Publish the new dashboard to leadership with a written scope note on attribution window and dark-traffic percentage. Use the influenced-pipeline URL ranking to set the editorial calendar for the next quarter, updating and expanding pages already doing the work rather than launching new clusters.
Content teams executing this sequence without expanding headcount often turn to AI-orchestrated execution platforms such as Vectoron to keep production moving against a properly instrumented library, so the measurement work compounds instead of stalling.
Frequently Asked Questions
References
- 1.Content Marketing Metrics: Measuring Content That Drives Revenue.
- 2.HubSpot State of Marketing Report 2024.
- 3.GA4 Developer Guide: Events and Conversions.
- 4.Use These 3 SEO Metrics To Measure Your Content Marketing ROI.
- 5.15 Digital Marketing ROI Metrics You Need To Know.
- 6.Which SEO metrics actually influence pipeline and revenue?.
- 7.Content Metrics: Organic Traffic, Conversion, Pipeline Influence.
- 8.B2B SaaS SEO Playbook: MQL to Pipeline Attribution.
- 9.SEO CRM Integration: How to Connect Organic Search to Revenue.
- 10.Measurement and Attribution in an AI-Shaped Funnel.
- 11.How to Measure Content Marketing: Metrics, KPIs, and Dashboards.